Table of Contents
Advertisement
Quick Links
Advertisement
Table of Contents

Summary of Contents for optel UG - S/A
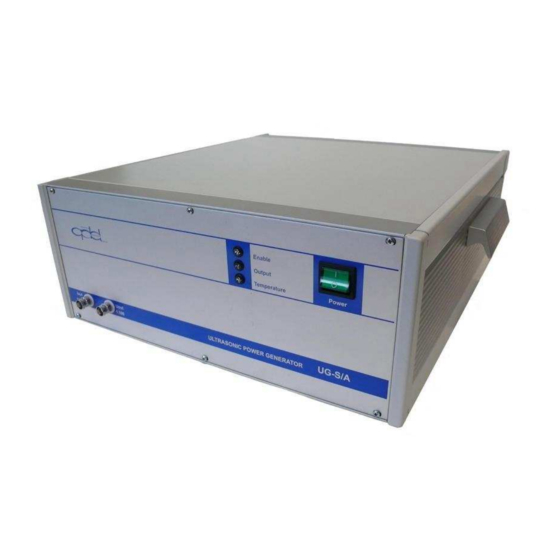
- Page 1 Przedsiębiorstwo Badawczo-Produkcyjne OPTEL Sp. z o.o. ul. Morelowskiego 30 PL-52-429 Wrocław tel.: +48 (071) 329 68 54 fax.: +48 (071) 329 68 52 e-mail: optel@optel.pl http://www.optel.pl Wrocław, 03.11.2009 ULTRASONIC GENERATOR UG - S/A rev. 4.0/03.07.2008 Technical Documentation...
-
Page 2: Table Of Contents
Contents Introduction. Warranty conditions Technical description Standard equipment Destination Construction Information plate Technical information Block diagram - principle of operation Getting started and using UG-S/A Description of connectors and indicators Guidelines for user Installation and first use Software description Communication protocol 1. -
Page 3: Destination
Destination UG-S/A generator is designed to power the ultrasonic ceramic transducers sinusoidal voltage/current with frequency in range 18 - 22kHz. This frequency is manually adjustable with 1Hz interval or automatically in automatic mode, where device is working in selected frequency range. This range is related to resonant frequency of the transducer. -
Page 4: Construction
• RS 232 communication control board Information plate Power Ultrasound Generator UG S/A Serial no.: 07.12.rev.4 www.optel.pl Date of production.: 03.2008 Ultrasound Frequency: 17 – 50kHz Power Supply: 220-240 VAC/50Hz Power Output: 600W Dimensions: 360 x 340 x 160mm Weight: app. 11 kg Standard: 67/308/Ce Fig. -
Page 5: Block Diagram - Principle Of Operation
• Interzoll Plus desk enclosure 3 HE IZP 36360 (BOPLA) • enclosure consistent with: IP40 to EN60529 All changeable parameters are adjustable by using digital lines (TTL standard, 5V). Block diagram - principle of operation Auxiliary supply 5V, ±12V Frequency µC synthesis RS232... -
Page 6: Description Of Connectors And Indicators
Description of connectors and indicators Fig. 4. Front panel Enable – power ON indicator Output – output enable indicator Temperature – overheat indicator Power – power ON/OFF switch Iout – diagnostic current output Uout – diagnostic voltage output Fig. 5. Back panel Power connector Glass body fuse 5x20mm 6.3A 250V (quick-acting) RS232 interface - DB9 female... -
Page 7: Installation And First Use
• accuracy and confidence of connections • condition of cable insulation • use only mains socket with fully efficient grounding pin • to attach load (ultrasonic transducer or model resistance), use only cables with appropriate insulation class If the device is in operation: •... -
Page 8: Software Description
analizer_f analizer_m protocol ug_sa.exe lissa.uir Software description After starting UG-S/A software, main panel appears on the screen. It is shown below: Fig. 6. Main panel. Main panel consist of following elements:... - Page 9 Fig. 7. Main panel 1. Graph of Lissajous curves 2. Voltage, current, power, impedance and phase graph in time domain (default 10 minutes range) 3. Measurements panel 4. Settings panel 5. Power measurement panel 6. Legend of generator condition panel 7.
- Page 10 device and PC are connected properly and if some other applications are using this communication port. After this kind of error occurs, the user should re-detect the device (F8 button and then “Find”). On this panel user also may found indicators: •...
- Page 11 Fig. 8. Main panel – connection with UG-S/A failed. Fig. 9. Main panel – generator works properly...
- Page 12 Normal working mode. • set desirable output voltage level (%) and start frequency • run the generator by START button (or F1 button) • during work the user may change voltage and frequency • if power, voltage or current exceed the maximum permitted level, generator is stopped (as STOP/F1) Measuring load frequency response.
- Page 13 Fig. 11. Analyzer panel – description 1. Graph of impedance and phase in frequency domain 2. Table of measured values: frequency, voltage, current, phase, impedance and power 3. Parameters for automatic mode on main panel 4. Function buttons 5. Generator condition panel 6.
- Page 14 „interval” parameter describes time duration between two single steps (frequency changes) of the scan. The smallest value of this parameter is 50 ms. In the window described as „Setting for automatic control“ the user may found values, which are changeable by cursor. They are used in automatic mode (tuning to the resonance).
- Page 15 About us Information about manufacturer Back Back to the previous panel In this graph is shown power in frequency domain. By cursor user may read every single point of this graph to get strict values. Measurement of impedance characteristic in power domain. The procedure is the same as for the characteristics in frequency domain (paragraph above) Fig.
- Page 16 Button Description Function Start/Stop Start acquisition and generation on the output - characteristic plotting Open Load settings and graph from file Save Save actual settings and graph to file Print Print screen About us Information about manufacturer Back Back to the previous panel Additional information.
Need help?
Do you have a question about the UG - S/A and is the answer not in the manual?
Questions and answers