Advertisement
Quick Links
Getting started with QTrace and a STM32F4 Nucleo demo board
This quick start guide shows how to begin evaluating QTrace in minutes using a very low cost STM32
Nucleo-F429ZI board from ST Microelectronics. The supplied demo project can easily be adapted to other
STM32 Nucleo-144 boards to allow tracing of different STM32 variants.
1. Overview
QTrace is a low cost instruction trace system for ARM Cortex M3/M4/M7 based processors. It gives an
exceptional insight into how a target application is running and aids locating hard-to-find bugs. The system
consists of a USB 3.0 powered trace probe and a Windows based trace analyser application.
The QTrace probe is supplied with the following components:
QTrace hardware probe
14-way 0.05" to 20-way 0.1" JTAG/SWD converter PCB
20-way split ribbon cable
USB 3.0 Type A to Micro-B cable
QTrace Analyser application (installed via a link sent to the email address given with the online order)
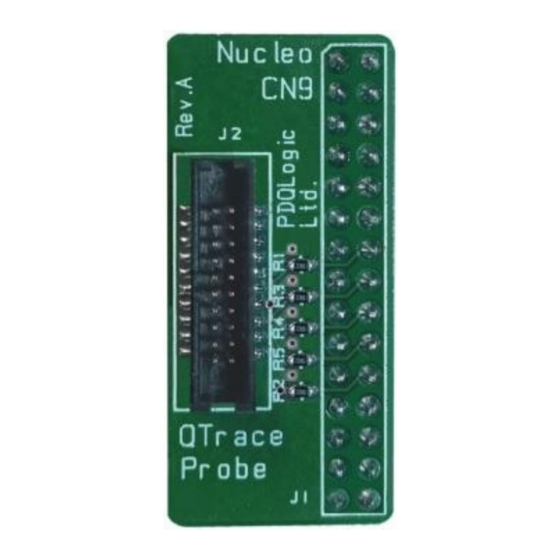
The ST Nucleo-144 converter PCB above (see
30-way 0.1" to 20-way 0.05" trace converter PCB* and is required for this quick-start guide. The other
prerequisites are:
Nucleo-F429ZI board*, see
Micro-USB cable*
RJ45 cable based network connection (optional)
QTrace Analyser is supplied with a demo application created with STM32CubeIDE v1.5 that can be flashed
onto the Nucleo board via a hex file. The demo doesn't require an IDE but if you already have STM32CubeIDE
installed then go ahead and import the supplied project into your workspace from:
C:\Users\Public\PDQLogic\QTraceAnalyser\Firmware\Examples\Nucleo_F429
Build and flash the image via the Nucleo's ST-Link debugger then skip to section 3 to begin evaluating QTrace.
If you aren't using STM32CubeIDE then flash Nucleo_F429.hex (located in the path above) with an existing
tool and skip to section 3. Alternatively, use the STM32CubeProgrammer from ST as detailed in Section 2.
* Purchased separately
QTrace Application Note 005
https://www.pdqlogic.com/documents/STM32-Nucleo-Trace-Board.pdf
https://www.st.com/en/evaluation-tools/nucleo-f429zi.html
Copyright © 2021 PDQLogic Ltd
Application Note 005
+
ST Nucleo-144
converter PCB
.
) is a
Page 1 of 11
Advertisement

Related Manuals for PDQLogic QTrace

Summary of Contents for PDQLogic QTrace
- Page 1 C:\Users\Public\PDQLogic\QTraceAnalyser\Firmware\Examples\Nucleo_F429 Build and flash the image via the Nucleo’s ST-Link debugger then skip to section 3 to begin evaluating QTrace. If you aren’t using STM32CubeIDE then flash Nucleo_F429.hex (located in the path above) with an existing tool and skip to section 3.
- Page 2 2) After STM32CubeProgrammer is installed, connect the Nucleo board to the PC via the ST-Link micro USB connector: ST-Link USB Connector 3) Launch STMCubeProgrammer. The ST-Link debugger embedded on the Nucleo should be detected and displayed: Page 2 of 11 QTrace Application Note 005 Copyright © 2021 PDQLogic Ltd...
- Page 3 Application Note 005 4) Click the green Connect button: 5) Once connected, select the Erasing & Programming screen: Page 3 of 11 QTrace Application Note 005 Copyright © 2021 PDQLogic Ltd...
- Page 4 6) Browse for the hex file to program: C:\Users\Public\PDQLogic\QTraceAnalyser\Firmware\Examples\Nucleo_F429ZI\STM32CubeIDE\Debug\Nucleo_F429.hex 7) Once the hex file is selected, tick the Run after programming checkbox then click the Start Programming button: Page 4 of 11 QTrace Application Note 005 Copyright © 2021 PDQLogic Ltd...
- Page 5 8) Once successfully programmed click Disconnect: After a short delay, a green LED (LD1) on the Nucleo board will start blinking. Remove the USB lead from the Nucleo board before connecting to the QTrace probe. Page 5 of 11 QTrace Application Note 005...
- Page 6 IDE/debugger to demonstrate QTrace features. 1) Launch QTrace Analyser after it has been installed and then connect the QTrace probe to a USB 3.0 port on your PC via the supplied USB-A to USB micro-B cable.
- Page 7 Application Note 005 6) The front panel LED on the QTrace probe will turn green when trace data is detected. The target clock speed and instruction execution rate in MIPS will also be displayed in the QTrace Analyser status bar: If the target is not detected then press the black Nucleo reset button board or unplug the Nucleo USB lead and reconnect it.
- Page 8 Nucleo board. This will also call ToggleBlueLED to illuminate the blue LED. In both cases the Trace Point will be triggered. Page 8 of 11 QTrace Application Note 005 Copyright © 2021 PDQLogic Ltd...
- Page 9 Application Note 005 12) At this point QTrace Analyser will have switched to the Code Capture view to provide a call stack history of up to 8M instructions executed before ToggleBlueLED: Source Stepping The vertical purple marker on the right hand side of the graph indicates the trigger point. The blue highlighted instruction and corresponding vertical blue marker in the graph identify the instruction being inspected.
- Page 10 Nucleo board for one second. This will deliberately cause a read from an invalid memory location and generate a hard fault. QTrace Analyser will switch to the Code Capture display to show the location of the fault both graphically and in disassembly / source code form, see below:...
- Page 11 ‘unnamed’ objects such as queues, semaphores, etc. 17) For further details of QTrace Analyser, press F1 in QTrace Analyser for online help or open the PDF user manual located at C:\Program Files\PDQLogic\QTraceAnalyser\Documents\QTrace-User-Manual.pdf...
Need help?
Do you have a question about the QTrace and is the answer not in the manual?
Questions and answers