Advertisement
Quick Links
Radona Expert+
Version: normal, without steering output
06.04.2021
Manual
The RadonTec Radona Expert+, is the new way measure your radon air level. The device not only
impresses with its attractive appearance, but also with its inner values. Thanks to the FTLAB
ionization chamber technology used by Waltec, the Radona radon measuring instrument can
achieve up to 20 times faster measuring times than
other
comparable
measuring
addition, the Radona can also be used for time-
resolved measurements, as the radon concentration
is measured every 10 minutes. The radon measuring
instrument Radona was developed especially for
professional users and interested private users. In
addition to the radon meter itself, the scope of
delivery includes a power supply unit and a USB-C
cable (for reading the data with the PC and for
charging). With the graphical display you have
different views on the measured data even without
transferring the data to a personal computer.
instruments.
In
Advertisement

Summary of Contents for RadonTec Expert+
- Page 1 06.04.2021 Manual The RadonTec Radona Expert+, is the new way measure your radon air level. The device not only impresses with its attractive appearance, but also with its inner values. Thanks to the FTLAB ionization chamber technology used by Waltec, the Radona radon measuring instrument can...
-
Page 2: Technical Details
Technical details ● Pulsed Ionization Chamber type from FTLAB RD200M ● Meaningful measured values in less than 1 hour ● Measuring and storage interval: 60-minutes ● Sensitivity : 0.5cpm/pCi/l at 10pCi/l (30cph/pCi/l) ● Operating range : 10~40℃, RH < 90% ●... - Page 3 Display and menu navigation 1] Allows scrolling down (function exists only in some views) 2] Use this key to navigate through the individual views. 3] To switch on, press the button briefly. To switch off, press and hold for approx. 3 seconds until Off appears on the screen.
-
Page 4: Main View
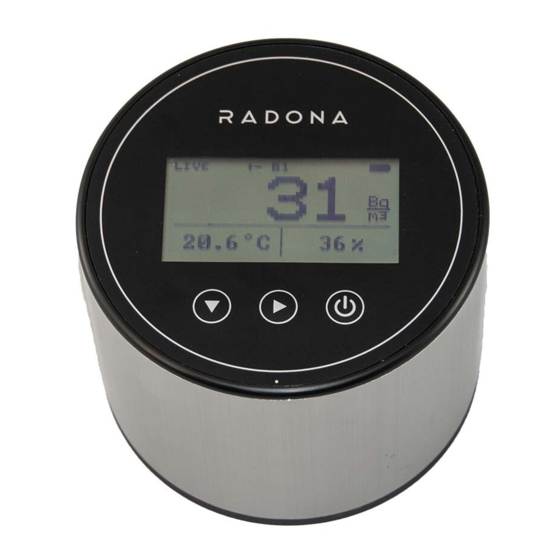
Mainview The unit can be switched on for approx. 2 seconds by pressing the 3] key. The first screen is the main screen. 1) Indicates that the displayed value is the real-time radon value (value is updated between 5-10 minutes) 2) Current / Live radon value 3) WLAN symbol, crossed out (as here in the picture) means that the device does not have a WLAN module. -
Page 5: Second View
Second view 1) Indicates the Radon mean value (over all measured values stored in the instrument) 2) Specifies the statistical inaccuracy/deviation for this value 3) The current radon value 4) The hook means that the measuring chamber is functioning correctly. 049 would indicate a problem with the measuring chamber. - Page 6 Further views The other views (sub-views) are divided into seven different views. 1) Indicates the running time of the measuring device (since the last reset). 2) Displays the Radon averages of the last day, the last 7 days, the last month and the last year.
- Page 7 Display of the radon value within the last 24 hours (x-axis is the hours, Y-axis is the height of the radon value). The Y-axis adapts to the highest radon value. On the far right there is always the bar which shows the current value (marked by an unfilled bar). An unfilled bar can still change in height until it becomes a filled bar.
- Page 8 Graphical representation of the radon value. The current value is always rightmost. The graph builds up from right to left and is continuous after 90 hours. With this view you always have the radon concentration of the last 2 days at a glance. Graphical bar display of the radon value of the last 31 days.
- Page 9 Graphical bar display of the radon value at month level. On the right is the current month, this bar changes until the month measurement is completed and another bar is displayed.
- Page 10 The last view in the meter 1) Indicates the voltage of the battery. The device switches off automatically when the voltage falls below 3.05V. 2) Specifies the status of the software version. 3) Displays the time and date used in the meter. This time is also used when saving the measured values.
- Page 11 Menu items 4 and 5 can be selected with this key: This action can then be performed by pressing the center button. However, to reset all data, the center button must be held down for approx. 5 seconds.
- Page 12 PC Radona download tool The Radona Expert+ comes with the Radona Data Download Tool free of charge. The current version is enclosed with the measuring device on a USB stick. The above package already includes the USB driver, which can also be downloaded directly from the manufacturer if required: https://www.silabs.com/products/development-tools/software/usb-to-uart-bridge-vcp-drivers...
- Page 13 10) This bar can be moved with the left mouse button to select the zoom area. 11) have a look at 10) 12) Radon, humidity, temperature and air pressure can be faded in/out. 13) Log window RadonTec GmbH Hauptstrasse 5 89426 Wittislingen info@radontec.de...
Need help?
Do you have a question about the Expert+ and is the answer not in the manual?
Questions and answers