Table of Contents
Advertisement
Advertisement
Table of Contents

Summary of Contents for 3B SPECTRA-1
- Page 1 Spectrometer Visible Light Spectrometer V4.4...
-
Page 2: Table Of Contents
Dynamic measurement ......................... 23 Multiple charts ..........................24 System requirements ........................26 Minimal system requirements ....................... 26 Software (operating system) ..................... 26 Hardware ..........................26 Recommended system requirements .................... 26 Software (operating system) ..................... 26 Hardware ..........................26 Copyright 3B ©2011... -
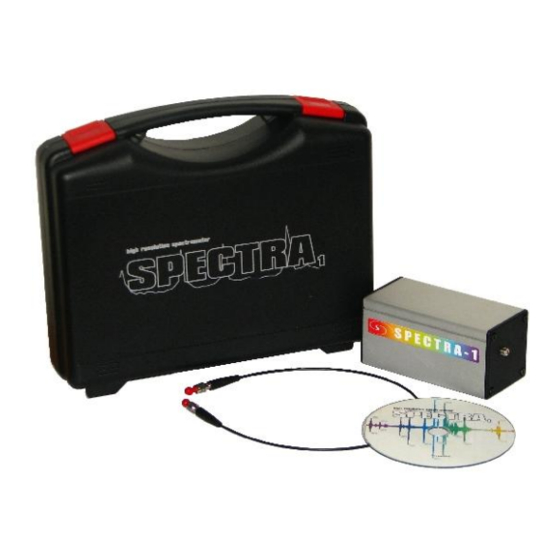
Page 3: Package Contents
Documentation Calibration report (separate paper or label on the Spectrometer device) Installation CD The Spectrometer device Fiber optics cable If any of the above items is damaged or missing, contact your retailer. Copyright 3B ©2011... -
Page 4: Trademarks
All trademarks used in this manual are the sole property of their respective owners. StarCam is a trademark of International Business Machines Corporation. Pentium is a registered trademark of Intel Corporation. Windows is a registered trademark of Microsoft Corporation. Copyright 3B ©2011... -
Page 5: Manual Driver And Application Installation
4. Follow the on-screen instructions to continue the application installation. 5. Connect the Spectrometer device to the USB port (if not already connected). 6. Once the Spectrometer device is connected to the computer, the system will detect the new USB device and configure the device automatically. Copyright 3B ©2011... -
Page 6: Manual Application Installation
Spectrometer Manual Application Installation 1. Before installing the Spectrometer, uninstall any previously installed versions of the application: Go to the Control Panel Double click on the ‘Add or Remove Programs’ Copyright 3B ©2011... - Page 7 Spectrometer Find the Spectrometer application and click ‘Remove’ 2. Run ‘autorun.exe’ from the root folder on the CD and follow the instruction. Copyright 3B ©2011...
-
Page 8: First Start Of The Application
Calibration data are printed on the Calibration report included with the spectrometer device. Example of the Calibration report (the Calibration report on your spectrometer device could differ from the one provided on the figure below): Copyright 3B ©2011... - Page 9 Spectrometer It is important to enter the numbers from the Calibration report at the exact position to the dialog: After entering the data the main application window appears and the Spectrometer is ready for use. Copyright 3B ©2011...
-
Page 10: Running The Spectrometer
Spectrometer Running the Spectrometer To run the spectrometer, follow these steps: Select video device Press the ‘Play’ button The spectrometer displays the recorded light spectrum in upper left corner of the preview window Copyright 3B ©2011... - Page 11 Spectrometer and also the chart representation of the spectrum. Copyright 3B ©2011...
-
Page 12: Custom Calibration
Spectrometer Custom calibration 1. Make sure the spectrometer is running (if not, press the ‘Fast Forward’ button). In ‘Calibration’ menu, select ‘Calibrate…’. Copyright 3B ©2011... - Page 13 3. Now, a black chart appears. Specify calibration points by clicking on the black chart and enter the corresponding wavelength. Specifying calibration points (three or two – depending on the step 3): a. Click on the peak label with known wavelength. Copyright 3B ©2011...
- Page 14 A message box appears. Enter the corresponding wavelength for the point (peak) specified in step a. Click ‘OK’. c. Repeat steps a, b for further point(s). 4. After setting all calibration points a notification message appears. Click ‘OK’ for finishing the custom calibration. Copyright 3B ©2011...
-
Page 15: Switching The Calibrations
Spectrometer Switching the Calibrations In case the custom calibration is already set, option to choose between default and custom calibrations is enabled in ‘Calibration’ menu. Choose the calibration you want to use. Copyright 3B ©2011... -
Page 16: Zooming & Scrolling
Zooming is not available during calibration process. Zooming In order to zoom in press the left mouse button and drag to the right, to zoom out, press the left mouse button and drag to the left. Zooming in: Zooming out: Copyright 3B ©2011... -
Page 17: Resetting Zoom
Spectrometer Resetting Zoom To reset the zoom, click the ‘1:1’ button. Scrolling While zoomed in, hold and drag the right mouse button to scroll the chart. Copyright 3B ©2011... -
Page 18: Other Controls
Automatic Y axis scaling Y axis scaling is available in automatic mode. Scaling can be used in both cases – while spectrometer is running or stopped. To turn the automatic scaling on or off, press the ‘Scaling’ button. Copyright 3B ©2011... -
Page 19: Export & Quick Export
The export functionality is available only in case the spectrometer is stopped. Execute ‘Export’ and specify export file name and destination directory. Once export file name and directory are specified, you can use ‘Quick Export’ without additional specification (saved files will be automatically marked by ascending numbers). Copyright 3B ©2011... -
Page 20: Cursor Position
The cursor position functionality is available only in case the spectrometer is stopped. The functionality displays intensity for corresponding (specified) wavelength. The cursor shows the specified wavelength position in the graph. ‘Arrow’ buttons can be used to move the cursor in the graph. Copyright 3B ©2011... -
Page 21: Transmissivity Measurement
Spectrometer Transmissivity measurement Initial setup of transmissivity measurement: 1. Press the ‘Fast Forward’ button 2. Record the dark spectrum 3. Record the reference spectrum Copyright 3B ©2011... - Page 22 Spectrometer 4. Start transmission measurement In order to stop the transmission measurement, uncheck the ‘Calculate transmission’ In order to save the dark or reference spectrum use the save options in the menu. Copyright 3B ©2011...
-
Page 23: Dynamic Measurement And Multiple Charts
Spectrum is displayed during the dynamic measurement in the background. The progress of the operation is defined by the elapsed time indicated in the notification window. Press the ‘Stop’ button in the progress window to stop the dynamic measurement. Copyright 3B ©2011... -
Page 24: Multiple Charts
The spectrum image used in ‘Line 1’ will be used also for the preview (to be able to specify the range for spectrum calculation) and spectrum calculation area. During multiple charts mode, some chart features (show peaks, fill chart …) are disabled. To clear multiple charts tab, press the ‘Clear all lines (multiple charts)’ button Copyright 3B ©2011... - Page 25 Spectrometer To leave the multiple charts mode, click the ‘Collapse’ button in the multiple charts tab. Or press the ‘Stop multiple charts mode’ button. Copyright 3B ©2011...
-
Page 26: System Requirements
Processor: Intel Pentium Core 2 Duo 2 GHz or equivalent Graphics resolution: 1024 x 768 Video accelerator with 256 MB Hard driver: 300 MB free space USB 2.0 connector CD-ROM drive for software installation Copyright 3B ©2011...
Need help?
Do you have a question about the SPECTRA-1 and is the answer not in the manual?
Questions and answers