Table of Contents
Advertisement
Advertisement
Table of Contents

Subscribe to Our Youtube Channel
Summary of Contents for IDEAL ThermalVision
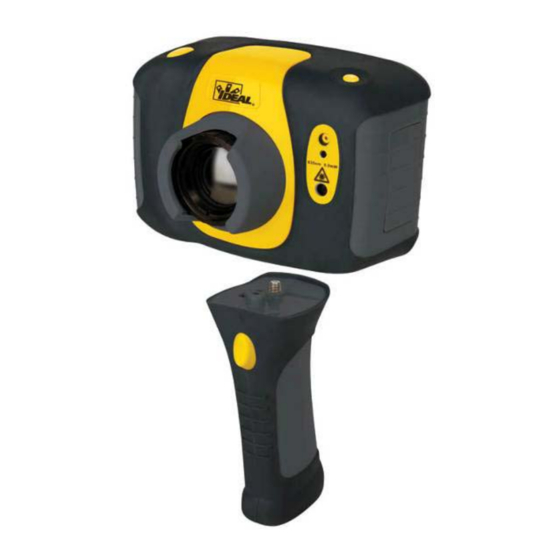
- Page 1 #61-844SW ThermalVision™ Software Instruction Manual ND-7035-1 Page 1 of 23...
-
Page 2: Table Of Contents
#61-844SW Contents 1. Installing the ThermalVision™ software onto a PC............3 2. Transferring saved images from the camera to the PC..........3 2.1. Direct from Camera ................... 3 2.2. From the Micro SD Card ..................4 3. Using the ThermalVision™ software................5 3.1. -
Page 3: Installing The Thermalvision™ Software Onto A Pc
#61-844SW 1. Installing the ThermalVision™ software onto a PC. To install the ThermalVision™ software onto a PC: Insert the CD into the PC. Use Windows Explorer to view the files on the CD. Open and run the file “ThermalVision™ PC setup.exe”... -
Page 4: From The Micro Sd Card
The folder is not necessary to include as an attachment on an email document. Both images are necessary, and ThermalVision™ software will automatically match the two images as long as they are both included as attachments. -
Page 5: Using The Thermalvision Software
Report Writer - Allows the user to create a report of the thermal images for records and administration and operational use. 3.1. Starting the Software. Double Click on the ThermalVision™ icon to start the software ™. The following window will appear. - Page 6 #61-844SW Once the folder is located, double click on the image to be loaded. Opening Screen shot. The window format shown below should be displayed. Maximize the window in order to see all the features. Tabs for Display, Cursors, Settings Tool bars and Properties.
-
Page 7: Analysis Tools
#61-844SW Image Description The thermal image is seen on the right hand side of the screen. A temperature scale relating to the Color Pallet is displayed to the right of the image. An adjustable span, also showing a histogram of temperatures in the image is shown at the bottom of the screen. There is a drop down menu bar and an icon toolbar. - Page 8 #61-844SW ND-7035-1 Page 8 of 23...
- Page 9 #61-844SW 1. Visible span allows the span values to be altered manually by clicking on the Figures in the boxes and changing them. Auto span sets the visible span values based on the temperature values in the image. The visible span can also be adjusted using a mouse in the level and span adjustment bar.
- Page 10 #61-844SW 3. Interpolation. To change the interpolation, click on the arrow button. Lower values of interpolation give a more pixelated display. The following settings are available. x1 (47 x 47) (see below). x2 (94 x 94). x4 (188 x 188).and x8 (378 x 378) (see below) x1 (47 x 47) x8 (378 x 378)
- Page 11 #61-844SW Cursors tab Up to 10 cursors can be added to the display. 1. To add a cursor to the image, double click on the image on the screen. 2. To remove cursors highlight the cursor in the box and click remove. The list of cursors within the box shows: - 1.
- Page 12 #61-844SW Settings tab 1. Units: F, K. Change using the arrow button. 2. Reflected Temp: Change using the arrow buttons. 3. Emissivity: 0.05 to 1.00. Change using the arrow buttons. 4. Capture Time: Change if required using the arrow buttons. 5.
- Page 13 #61-844SW Properties tab Shows the properties of the image and allows playing of the voice annotation associated with the image. If a text caption is entered when saving the image it is shown here. ND-7035-1 Page 13 of 23...
-
Page 14: Menus And Toolbars
#61-844SW 3.4. Menus and Toolbars Use either the drop down menus or the icons on the toolbar to carry out various operations. Drop down menus Icons toolbar. File Items 1 and 2 below are also available via the icons on the toolbar. 1. - Page 15 #61-844SW Edit 1. Copy… 2. Copy To Bitmap… This offers the option to copy the image to the clipboard or to save as a bitmap. Both of these options will allow three choices - Full window, Snapshot or Snapshot+. Full window. Snapshot.
- Page 16 #61-844SW View Items 3 to 9 and 11 below are also available via the icons on the toolbar. 1. Toolbar. Turns on/off the icon toolbar. 2. Status Bar. Turns on/off the status bar at the bottom of the screen. 3. Measurement Cursor List. Toggles to show the temperature value and position of the selected cursors.
- Page 17 #61-844SW 5. Hot & Cold Cursors. Toggles between displaying the hottest and coldest point of the whole image. 6. Area Select. Selects an area in the middle of the image. The maximum, minimum and average temperatures of the area box are displayed in the cursor list (item 3 above).
- Page 18 #61-844SW The red and blue isotherms can be set by adjusting the red and blue blocks level span adjustment bar. This can be done using a mouse. To adjust the isotherm width, click on the color block edge and drag. To adjust level, click in the color block and move.
- Page 19 3. Language. The following languages can be selected. English, German, French, Spanish, Italian, Chinese, Japanese, Korean, US English and Portuguese Once a language is selected exit the ThermalVision™ software and re-start it to activate the selection. Help 1. About. Shows the software version.
-
Page 20: Report Writer
#61-844SW 4. Report Writer It is possible to toggle between the ThermalVision analysis software and the Report Writer software from the drop down view menu or the toolbar. There are three steps to create a report. There is a separate tab for each function. -
Page 21: Image Select Tab
#61-844SW 4.2. Image Select tab. 1. The screen shown below appears. 2. Click on the browse button to open Windows Explorer. 3. Highlight an image and click on the open button. All the Images in that folder will now appear in the browser selection on the left of the window. - Page 22 #61-844SW Click on a selected image in the browser section and it appears in the image preview section on the right of the window. The add/add all remove/remove all buttons allow the selection and removal of images as required. Selected Image/s will appear in the inspection section in the center of the window. ND-7035-1 Page 22 of 23...
-
Page 23: Inspection Data Tab
#61-844SW 4.3. Inspection Data tab. 1. The inspection window will appear. 1. Complete and enter data as required for the report. Tip - Before generating the report it is advisable to save the report project as this can then be changed later. 2.
Need help?
Do you have a question about the ThermalVision and is the answer not in the manual?
Questions and answers