Table of Contents
Advertisement
Quick Links
Advertisement
Chapters
Table of Contents

Related Manuals for Solare Datensysteme Solar-Log Base

Summary of Contents for Solare Datensysteme Solar-Log Base
- Page 1 Solar-Log™ Manual Solar-Log Base...
- Page 2 Publisher: Solare Datensysteme GmbH Fuhrmannstr. 9 72351 Geislingen-Binsdorf Germany International support Tel.: +49 (0)7428/4089-300 e-mail: info@solar-log.com Contact: https://www.solar-log.com Italy Technical support: +39 0471 631032 France Technical support: +33 97 7909708 Switzerland Technical support: +41 565 355346 United States Technical support: +1 203 702 7189...
-
Page 3: Table Of Contents
Connector Assignments and Wiring ��������������������������������������������������������������16 Notes on wiring the connections ........................ 16 General PIN Assignment .......................... 17 MOD I/O �������������������������������������������������������������������������������������������������������������18 Connecting the Solar-Log Base to the MOD I/O ................... 18 PIN assignments MOD I/O general ........................ 19 LEDs MOD I/O .............................. 19 Connecting the inverters ���������������������������������������������������������������������������������21 8.1... - Page 4 9.4.1 External power meters/accumulating meters ....................30 Wiring for RS485 meter ........................... 30 Installation Utility Meter / Janitza UMG 104 / UMG 604 (only Solar-Log Base 2000) ....... 32 9.6.1 Connecting the Utility Meter to the power grid ....................33 Solar-Log™ Smart Relay Box ........................... 36 WeMo Insight Switch ............................ 38...
- Page 5 13.5.1.2 Interface ETH 1 ..............................69 13.5.1.3 Interface ETH 2 ...............................71 13.5.2 Proxy ................................72 13.6 Internet ................................ 73 13.6.1 Portal ................................73 13.6.2 Export (only with license) ..........................75 13.7 Configuring connected devices ........................ 76 13.7.1 Device definition ............................77 13.7.2 Device Detection ............................79 13.7.3 Configuring devices ............................80 13.7.4 Generation Information on PAC Correction Factor ...................81 13.7.5 Configuring power meters ..........................82 13.7.6 Configuring sensors ............................83 13.7.7 Configure the battery ............................83...
- Page 6 13.12.6 Variable reactive power via the characteristic curve Q(U) ................123 13.12.7 Remote controlled variable shift factor cos(Phi) (only with additional Mod I/O module) .....125 13.12.8 Linking - Master/Slave (Solar-Log Base 2000) .....................128 13.12.9 Profile ................................129 13.13 ModbusTCP PM .............................. 130 13.14 Direct Marketing ............................ 130 13.15 Data ................................. 131 13.15.1 Initial yield ................................132 13.15.2 Data correction ...............................133 13.15.3 System backup ..............................133 13.15.4 Backup ................................135 13.15.5 Reset .................................137 13.16 System Configuration ............................ 138 13.16.1 Access control ..............................138 13.16.2 HTTPS ................................139...
- Page 7 Status ................................ 201 16.4 Configuration .............................. 202 16.5 Installation .............................. 203 16.6 QR Code ................................. 204 16.7 Solar-Log Base LEDs ............................. 205 Faults ���������������������������������������������������������������������������������������������������������������206 17.1 Error messages.............................. 206 17.1.1 Fault messages time ............................206 17.1.2 Fault messages Internet ..........................206 17.1.3 Portal Transfer Fault messages ........................207 Cleaning and care �������������������������������������������������������������������������������������������208...
- Page 8 20.2.1 Variation with 4 relays (ENBW >100kWp) ....................212 20.2.2 Variation with two relays ..........................214 20.2.3 Variation with three relays ........................... 216 20.2.4 Variation with 5 relays (including emergency stop) .................. 218 20.3 Digital Interfaces ............................ 220 20.3.1 Modbus TCP ..............................220 20.3.2 Open JSON Interfaces ............................
-
Page 9: Introduction
Introduction 1 Introduction This manual is intended for use by solar energy technicians and professional electricians, as well as Solar-Log Base users. The installation and commissioning of components may only to be performed by properly trained special- ists. Refer to Chapter 4 "Safety information" for more information. -
Page 10: Safety Information
Safety information 2 Safety information In order to protect people, the device itself, and other equipment, please pay attention to the following before handling the product: • the content of this manual, • the safety information, • the warning signs and type plates attached to the product. Note: All the actions described in this manual for wiring and working on the individual components must be carried out only by specially trained electricians. All repairs should only be carried out by similarly trained personnel, or by the manufacturers themselves. -
Page 11: Electric Current
Electric current 3 Electric current Danger Risk of death by electric shock if inverters are opened. Never open the inverter housing when the inverter is connected to power. Refer to Switching inverters off. Always read the installation and safety instructions given in the manual for the corresponding inverter. Danger Danger of death if there is condensation in the power supply unit when started! Condensation can occur if the power supply unit is moved directly from a cold environment to a warm environment. Wait until the temperatures have equalized before doing this. Caution Damage to the electrical components in inverters and on interface cards due to electrostatic discharge. Avoid contact with component connections and plug contacts. Before picking up the component, ground yourself by holding the protective conductor (PE) or the unpainted part of the inverter housing. Caution Damage to the electrical components of the Solar-Log™ due to the wiring of the Solar-Log™! Disconnect the Solar-Log™... -
Page 12: Package Contents And Installation
Package Contents and Installation 4 Package Contents and Installation Check the package contents before proceeding to assembly and installation. Report any damage or missing parts to the forwarding agent and dealer immediately. The device is produced according to protection class IP20 and is intended only for installation in interior areas that are dry and dust-free. It can mounted on the wall (see illustration below) or on a top-hat rail (refer to the Solar-Log™ dimensions in chap- ter 23). -
Page 13: Solar-Log Base Connections
Solar-Log Base Connections 5 Solar-Log Base Connections 5�1 Top Connections Solar-Log Base Fig.: Solar-Log Base connections - 2 x RS485 (A and B) or 1 x RS422 - colored PIN connection on the device Solar-Log Base Top connections 2 x RS485 or 1 x RS422 Connection for accessories according to the Component Connection Manual. 1 x S0 Connection for S0 meter... -
Page 14: Solar-Log Base Leds
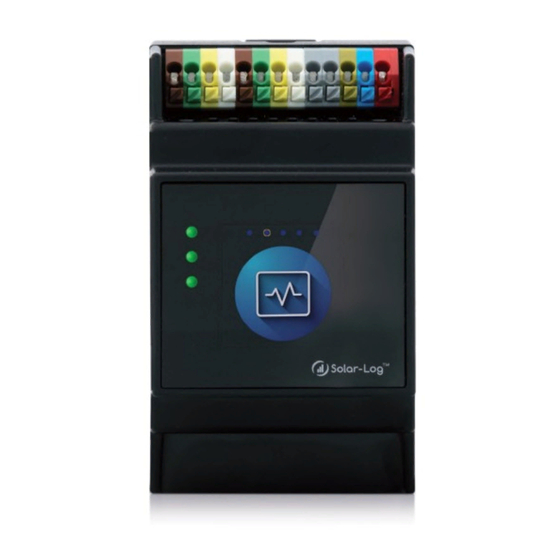
Input 5�2 Solar-Log Base LEDs Fig.: Display with LEDs Depending on the operating state, the LEDs can be lit up continuously in different colors. Normal operation Solar-Log Base - LEDs (from top to bottom) Name Color Meaning Power (top) is green... -
Page 15: Bottom Connections Solar-Log Base
Solar-Log Base Connections 5�3 Bottom Connections Solar-Log Base Fig.: Bottom Connections Solar-Log Base Top of the Solar-Log Base 2 x USB USB connection. Suitable for USB sticks. Not suitable for a connection to a PC / laptop. 2 x Network... -
Page 16: Connector Assignments And Wiring
Connector Assignments and Wiring 6 Connector Assignments and Wiring The following connection cables are required as needed: • To connect a router, you need a network cable with the appropriate length. • If you want to connect the Solar-Log™ directly to your PC or laptop, you need to use a crossover cable. • Cable to connect the Solar-Log™ to an inverter. • Sets of prefabricated cables for particular inverters are available from our Solar-Log™-Shop. The length of these cable sets is 3 m. • If you want to connect several inverters to Solar-Log™, you need suitable cables and connectors to connect the inverters to each other. -
Page 17: General Pin Assignment
Connector Assignments and Wiring 6�2 General PIN Assignment Pin assignment Power RS485 A/B RS422 Assignment 1 (red) (24 V 2 (blue) Ground 3 (lime green) Functional earth 4 (grey) 5 (grey) 6 (white) Data+ T/RX+ 7 (yellow) 8 (olive green) 9 (brown) Data- T/RX- 10 (white) -
Page 18: Mod I
7 MOD I/O 7�1 Connecting the Solar-Log Base to the MOD I/O Use the accompanying bus connector to connect the Solar-Log Base and the MOD I/O. (Refer to the illustrations below) Fig.: Solar-Log Base and MOD I/O without a bus connector Fig.: Solar-Log Base and MOD I/O with a bus connector... -
Page 19: Pin Assignments Mod I/O General
D_IN_3 Control input 3 D_IN_4 Control input 4 Control voltage for reactive power reduction. Note The MOD I/O module will be automatically detected after the Solar-Log Base has been restart- ed. With the first firmware version of the MOD I/O, the connection to a ripple control receiver can be configured. Refer to Chapter 13.11.2 “Remote controlled active power reduction (only with MOD I/O” start- ing on page 110. Note In the case of wall installation, be sure to use a piece of rail to stabilize the bus connec- tors. - Page 20 MOD I/O Table LEDs - MOD I/O MOD I/O - LEDs (from top to bottom) Name Color Meaning Power (top) green The MOD I/O is receiving power. Communication (middle) blinking / lights up green Communication with the MOD I/O has been established. Operating status (bottom) The MOD I/O is starting.
-
Page 21: Connecting The Inverters
Connecting the inverters 8 Connecting the inverters As each inverter manufacturer uses different wiring connections and connectors, the corresponding data cables must be adapted correctly. • See Chapter 6 „Belegung und Verkabelung der Anschlüsse“ for terminal block connector wiring diagrams for the connection to the Solar-Log™ • Please refer to the Component Connection Manual when connecting inverters supported by the Solar-Log™. (Download from https://www.solar-log.com/en/support/downloads/manuals/) Note Solare Datensysteme GmbH supplies suitable connection cables for most inverter manufactur- ers. Always read the manufacturer-specific instructions for connecting the data cable. You will find these instructions in the manufacturer's documentation. -
Page 22: Switch Off The Inverters And The Solar-Log Base
Connecting the inverters 8�1 Switch off the inverters and the Solar-Log Base. Switching inverters off Before a making a cable connection between the Solar-Log and the connections inside the inverter and before installing an interface card in the inverter, always turn off all of the inverters first. To do this, read the manufacturer's documentation for the inverter, and proceed as follows: • Disconnect the AC side. • Disconnect the DC side. • Wait at least 5 minutes until the condensers in the inverters have discharged. Switch off the the Solar-Log Base. • Disconnect the Solar-Log Base from the power supply. -
Page 23: Connecting Accessories
Connecting accessories 9 Connecting accessories 9�1 Sensor Box Basic and Professional These sensors record both Irradiation sensor and module temperature values. The solar radiation sensor must be fitted in such a way that the sensor's solar cell and the plant's modules are aligned as similarly as possible to the sun, i.e. the sensor must have the same alignment and inclination. The sensors should be positioned in a way to best ensure that: • as little overshadowing as possible occurs • and snow cover does not interfere disproportionately with the sensor functions. To achieve this, it is best to fit the sensor on the side or above the solar module. Fitting bars can normally be used as a fitting surface with modules that are parallel to the roof protrusion. In other cases, a suitable fitting support may have to be added. - Page 24 The connection assignments are printed on the back of the sensor. Connect the wires according to the following diagram Important! Replacing the connection wires may cause damage to the sensor. Sensor Box Professional Solar-Log Base RS485 A/B Sensor connection cables PIN Interface A PIN Interface B Assignment...
-
Page 25: Sensor Box Professional Plus
Connecting accessories 9�2 Sensor Box Professional Plus The Sensor Box Professional Plus is used to record the Irradiation from the sun. This accessory allows the So- lar-Log™ to calculate the deviations in the current output compared to the potential output. Up to 9 Sensor Box Professional Pluses can be connected to the Solar-Log™. The solar radiation sensor must be fitted in such a way that the sensor's solar cell and the plant's modules are aligned as similarly as possible to the sun, i.e. the sensor must have the same alignment and inclination. - Page 26 Connecting accessories Fitting optional sensors The ambient temperature sensor must be fitted in a shady place with a wall bracket. The connection plug is screwed firmly into the 3 pin input on the Sensor Box Professional Plus. It is best to install the wind sensor in a high, exposed position using the mounting bracket. The connection plug is screwed firmly into the 2 pin input on the Sensor Box Professional Plus.
- Page 27 Connect the wires according to the following diagram: Important! Replacing the connection wires may cause damage to the sensor. Sensor Box Professional Plus Solar-Log Base RS485 A/B Connection cable Sensor Box Professional Plus PIN Interface A PIN Interface B Assignment...
-
Page 28: Large External Displays
Wiring for displays made by Schneider Displaytechnik The wiring consists of a 3-pin control cable, (3 × 0.5 mm ) and terminal block connector. Schneider Large displays Solar-Log Base RS485 A/B Terminal block connector Schneider Display PIN Interface A PIN Interface B... -
Page 29: External Power Meter
Wiring for displays from RiCo Electronic The wiring consists of a 2-pin control cable, (2 × 0.5 mm ) and terminal block connector. RiCo Large displays Solar-Log Base RS485 A/B Terminal block connector RiCo Display PIN Interface A PIN Interface B... -
Page 30: External Power Meters/Accumulating Meters
Configuration | Device | Configuration • Generator • Total yield meter • Consumption Meter • Utility Meter (U) (only Solar-Log Base 2000) • Utility Meter (U+I) (only Solar-Log Base 2000) • Utility Meter (U+I) + Consumption meter (bi-directional) (only Solar-Log Base 2000): • Sub-consumer... - Page 31 Connecting accessories Note Only one Inepro 75D or 1250D RS485 meter can be used for each Solar-Log Base interface. Note These meters cannot be used together at the same bus input with inverters that are connected to RS422 (e.g. Fronius). Note Inepro 1250D All three phases have to be connected for the Solar-Log™ to accurately detect the meter. If an Inepro 1250D is used, the PRG button on the meter must be pressed and held down during entire detection process.
-
Page 32: Installation Utility Meter / Janitza Umg 104 / Umg 604 (Only Solar-Log Base 2000)
Current: Secondary 5A e.g. 100:5A. Note The Utility Meter that we use is produced by the company Janitza. Refer to the Janitza UMG 104 / UMG 604 manual for further technical details. We cannot guarantee the functionality of other Janitza devices. ► The operating modes Utility Meter (U / U+I) are only available with the Solar-Log Base 2000. Note The Utility Meter cannot be connected to the inverters with a single bus. For this reason, use one RS485 connection for the inverters and one RS485 connection for the Utility Meter. -
Page 33: Connecting The Utility Meter To The Power Grid
Connecting accessories 9�6�1 Connecting the Utility Meter to the power grid Fig.: Utility Meter connection diagram for voltage measurements in low-voltage power grids Fig.: Utility Meter connection diagram for voltage measurements with current transformers (medium voltage) -
Page 34: Fig.: Utility Meter Connection Diagram For Current Measurements With Current Transformers
Connecting accessories Fig.: Utility Meter connection diagram for current measurements with current transformers Procedure • Enter the supply voltage into the Utility Meter Note We recommend using a fuse to safeguard the connection lines for the supply voltage. Please follow the instructions in the Janitza UMG 104 / UMG 604 manual. Note Supply voltages that do not correspond to the specifications on the rating plate can cause mal- functions and damage the device. Important! The inputs for the supply voltage are dangerous to touch. • Connect the measurement lines for current and/or voltage to the bottom of the Utility Meter. - Page 35 • Connect the Utility Meter to the RS485 bus of the Solar-Log™ according to the following diagram: Wiring the Utility Meter Solar-Log Base RS485 A/B Utility meter Terminal block connector Article Number: 255385 PIN Interface A PIN Interface B...
-
Page 36: Solar-Log™ Smart Relay Box
0.3 A @ 110V Procedure • Connect the Relay Box to the RS485 bus of the Solar-Log™ according to the following diagram: Relay Box Wiring Solar-Log Base RS485 A/B Relay Box Terminal block connector Article Number: 255656 PIN Interface A PIN Interface B... -
Page 37: Fig.: Smart Relay Box Relay Output (Change-Over Contact) Diagram
Connecting accessories Note The Solar-Log™ Smart Relay Box cannot be connected together with PM+ packages on a So- lar-Log™. Relay output assignments Fig.: Smart Relay Box relay output (change-over contact) diagram Fig.: Smart Relay Box relay output (make contact) diagram... -
Page 38: Wemo Insight Switch
Connecting accessories 9�8 WeMo Insight Switch With the WeMo Insight Switch, home appliances and electronic devices can be connected to a Wi-Fi network, allow- ing the devices to be remotely turned on and off. The Wemo Insight Switch can also monitor the devices and will send information about the device’s energy usage directly to your smartphone or tablet. Follow the subsequent instructions to be able to use these functions with the Solar-Log™. Procedure: Connect a desktop/laptop and the Solar-Log™ to the router with a LAN cable. Download the WeMo app to your smartphone or tablet. Reset the WeMo Insight Switch (press the reset button for 5 seconds while turning on the power for the WeMo Insight Switch). -
Page 39: Allnet Network Power Socket
Connecting accessories 9�9 Allnet Network Power Socket Allnet network power sockets can switch connect electronic devices on and off. These switching operations can be set manual, time-controlled or based on consumption levels. Allnet network power sockets can be integrated into the local network with a LAN cable connection. Follow the following steps to be able to use these functions with the Solar-Log™: Procedure: Connect the Allnet socket to a laptop or PC with a LAN cable and plug the Allnet device into a power socket. Click on Control Panel and then go to the Network and Sharing Center (for other operating systems, refer to the instructions for setting the IP address). -
Page 40: Connecting The Allnet Network Power Socket To The Solar-Log Base
Connecting accessories 9�9�1 Connecting the Allnet network power socket to the Solar-Log Base The Allnet socket has to be defined with the device detection function to connect to the Solar-Log Base. From Configuration | Devices | Definition the WEB interface of the Solar-Log Base go to and select the device class "Switch" with the blue plus symbol and then Allnet as the manufacturer followed by the type and number of de- Configuration | Devices | Detection vices. Confirm the selection with... -
Page 41: 10 Other Connections
Other connections 10 Other connections 10�1 USB The Solar-Log Base comes with two USB connections. This USB connection can only be used for USB sticks and not, for example, for a direct PC or laptop connection. Note When a USB stick is connected, the Solar-Log™ automatically saves a backup in the backup folder. A maximum of 10 backup files are saved in the directory. Older backup files are auto- matically deleted. -
Page 42: 11 Installation
11�1 Connect the Solar-Log Base to a network / PC� The Solar-Log Base is equipped with two standard Ethernet RJ45 sockets, which can be connected through any commercially available network cable. Speeds of 10 Mbit and 100 Mbit are supported. In general, any PC networking technology can be used for connecting the Solar-Log Base. The following technolo- gies are available: • Connection through an Internet router: Ethernet RJ45 network cable. -
Page 43: Solar-Log™ Replacement
Installation Note Please also be sure to carry out a system backup on a harddrive after initial start-up. We recommend regular data back-ups and also that a system back-up should be carried out if changes are made in the configuration of the plant. To carry out a backup and system backup, proceed as follows: Carrying out a backup: Configuration | Data | Backup Access the menu item on the Solar-Log™... -
Page 44: Component Replacement
Installation 11�4 Component replacement To ensure that data recording can continue to function correctly when a device is replaced, the device to be re- placed must be installed with exactly the same sequence and at the same interface as the old device. Subsequent- ly, the previously created system back-up is simply restored. To restore a system back-up to the Solar-Log™, the following steps are necessary: Restoring the system backup: Configuration | Data | System Backup Access the menu item on the Solar-Log™ in the web interface. Search Restore system settings from hard disk Click the “... -
Page 45: 12 Go To The Main Menu
Enter http://169.254.wx.yz in the address bar and press the ENTER key: Here wxyz stands for the last 4 digits from serial number of the Solar-Log Base. The serial number is located on the service (see left device side). • The main menu of the Solar-Log Base is displayed. IP address that was entered during the initial configuration • Start the web browser. -
Page 46: Fig.: Pop-Up Window With Security Information
Start the web browser. • Enter http://solar-log-wxyz in the address bar and press the ENTER key: Here wxyz stands for the last 4 digits from serial number of the Solar-Log Base. The serial number is located on the service (see left device side). • The main menu of the Solar-Log Base is displayed. -
Page 47: Fig.: Configuration Page "Access Control
Go to the Main Menu. Click on "Yes" here to directly define a user password. The following configuration page appears: Fig.: Configuration page "Access control" In the Access protection for the browser section, the user password can be activated and defined. Click on "save" after the defining the password. Set password later (not recommended) It is possible to define the user password later by clicking on "No" or by clicking on "No" after checking the box "I am aware of the security risks."... -
Page 48: Operating The Main Menu Of The Solar-Log Base
Go to the Main Menu. 12�1 Operating the Main Menu of the Solar-Log Base The main menu of the Solar-Log Base functions like a website and is divided into four main sections: • Header bar (A) • Left navigation (B) • Tab (C) • Configuration page (D) Various control elements are used. (See the explanation below). Fig.: Structure of the Solar-Log Base’s Main Menu... -
Page 49: Control Elements
Go to the Main Menu. 12�1�1 Control elements The following control elements are used: Control elements Control element Meaning Text field Text field with incorrect or missing entry. Drop-down selection list Switch deactivated and activated The question mark boxes display additional information Check boxes Several boxes can be selected at one time Command buttons for various functions Fig.: Control elements... -
Page 50: Explanations Of The Names In The Main Menu
Go to the Main Menu. 12�2 Explanations of the names in the main menu� 12�2�1 Header bar The header contains four main sections: • Login symbol ( Clicking on the login symbol, for example, allows you to access the info center or assistant. •... -
Page 51: Login Section Menu
Go to the Main Menu. 12�2�4 Login Section Menu You can entered a password protected section by clicking on the log in button (to the right of the confirmation in the web interface) and entering your user and password. There is a gray line below the login button that indicates Access Control if you are logged in and with which user level. (Refer to the section for more information) -
Page 52: Fig.: System Info With Example Plant
Go to the Main Menu. Data transfers: • Last transfer with the time and date and state message (in the example: OK) Fig.: System Info with example plant Info Center Information on the following sections can be accessed here: • Solar-Log™: The information about the Solar-Log™ such as the serial number, Easy Code and MAC address is located here. •... -
Page 53: Hide Arrow
Go to the Main Menu. 12�2�5 Hide arrow The "Hide Arrow" (on the right of the header bar) allows you to increase the amount of the page displayed in the browser by hiding the Welcome header. Fig.: Header bar with the "Hide Arrow" 12�2�6 New Firmware A notification is sent via the web browser when a new firmware is version available; a green triangle with an excla- mation mark is displayed at the top in the status line. -
Page 54: Fig.: Automatic Firmware Update Check With Notification Text Displayed
Go to the Main Menu. Fig.: Automatic Firmware Update Check with notification text displayed The following notification text is displayed by clicking on the question mark: "This settings allows firmware versions with critical errors to be automatically updated. However, generally, this setting only indicates that a new firmware version is available (green exclamation mark at the top). When clicking on the green exclamation mark in the header bar, a window with the new firmware version will appear. Selecting "OK" redirects you to the page of the Solar-Log Base for firmware updates. Selecting "Cancel" closes the window. -
Page 55: Installation Mode
Go to the Main Menu. 12�2�7 Installation Mode The installation mode is used for a smooth initial installation and configuration without having import licenses right away. The installation mode is valid for 30 days and is automatically activated when using a function that requires a license. The installation mode is indicated with a blue information symbol in the top-right corner of the header. Move the mouse cursor above the symbol to see how long the mode is still valid. Click on the symbol to go to the License menu. The menu can also displays which licenses are currently active. It can also be accessed Configuration | System | Licenses from ). Once the valid period has been passed, the installation mode becomes inactive. The Installation Licenses are grayed out in the Licenses menu and no longer displayed after 10 days. Fig.: Info symbol with activate Installation mode Inactive Installation Mode The installation mode becomes inactive 31 days after the initial installation and the licenses loss their validity. As a result, restrictions occur, such as no transmission of the recorded measured values via FTPS and graphics are Configuration | blocked on the local web interface. The licenses can also be viewed from the Licenses menu ( System | Licenses Note If a driver license needs to be purchased, this indicated with the information symbol and information text under the Interface Assignment Definition (Device Detection) when adding components. Required Licenses These licenses need to be purchased in order to operate without any limitations. The required licenses can be displayed, forwarded and edited in various form in the tab. The required licenses are displayed with a red triangle next to the blue information symbol in the header (see illustration). -
Page 56: Fig.: "Licenses" Menu With The "Required Licenses" Section (Example)
Go to the Main Menu. Fig.: “Licenses” menu with the “Required Licenses” section (example) The required licenses can be displayed, forwarded and edited in various form in the tab. Licenses: The required licenses are displayed in tiled form. List: This function displays the required licenses in text form which can be saved in a file. List (QR Code): The QR code list allows the required license list to be transfer to a smartphone app. E-Mail: This menu allows the required licenses to be sent as a text list with the e-mail client. E-mail (QR Code): This menu allows the required licenses to be sent as a QR code list with the e-mail client, which can be used by a smartphone app. Note! A QR code scanner has to be installed on the smartphone in order to read the QR code license list. Refer to the chapter 13.16.4 “Licenses” on how to purchase and install licenses. -
Page 57: Setting Up Of The Solar-Log™ With The Configuration Assistant
Go to the Main Menu. 12�3 Setting up of the Solar-Log™ with the configuration assistant After the initial set up of the Solar-Log™, the Solar-Log™ starts to ask about the following settings: • Language • Country, Time, Set Time automatically (via NTP server) • Display access control At the end, a pop-up window appears where you can start the Solar-Log™ configuration wizard. (Refer to the fol- lowing image: “Startup screen of the Solar-Log™... -
Page 58: Fig.: Solar-Log™ Ethernet Settings From The Solar-Log™ Configuration Wizard
Go to the Main Menu. Start Ethernet Settings Click on the " " button to run the configuration wizard. Once started, the menu appears (see image "Solar-Log™ Ethernet Settings). Here there is the option to activate a second Ethernet interface in order to separate the IT network from the PV plant. Since the Solar-Log™ has DHCP (obtain IP address automatically) active by default, check whether the DHCP server has been activated on the router. If the DHCP server is disabled in the router, the network settings must be configured manually. If necessary, please consult a network specialist who can assign a suitable network address in regard to IP address, Subnet mask and Gateway, for example. - Page 59 Go to the Main Menu. Fig.: Example with the second Ethernet interface active As with Ethernet 1, there are two options for IP address: Either a dynamic IP assignment with DHCP (Obtain IP address automatically (DHCP) or assigning a static IP ad- dress. The following boxes need to be defined: The IP address of the Solar-Log™, the subnet ask of the second network and the assignment of the functions for the interface.
-
Page 60: Fig.: Example Of A Successful Connection Test
Go to the Main Menu. Connection Test Use the "Connection Test" button to determine if the entries are correct and if a connection can be successfully established. The message indicates if the connection was successful or not. (See the following illustrations) Fig.: Example of a successful connection test Fig.: Example of an unsuccessful connection test Note... -
Page 61: Fig.: Displayed Firmware Update Window
Go to the Main Menu. Fig.: Displayed Firmware Update Window Yes, By clicking on " " the configuration wizard checks for a new firmware version and can install it after that. At the end, the interface detection is performed. When not confirmed, the interface assignment appears. Note The device detection is to be performed after the components have been connected. Other- wise the corresponding boxes for the components are grayed out. Interface assignment The connected components have to be assigned in the interface assignment section. -
Page 62: Fig.: Example - Configuration Wizard - Device Configuration
Go to the Main Menu. Note The device detection can be canceled by clicking on the "Skip" button – for example, when there is incorrect interface assignment or number of detected devices. Note The Solar-Log™ operates in installation mode for 30 days after the device detection. On day 31, “Yield Data” and “Diagnostic” no longer appear (refer to “Maximum Plant Size”). The following message appears: “Attention - import Plant Size License.” Next. Click on " " after a successful detection. Then click on " " The device configuration menu appears. In the device configuration, one can, for example, define the generator output, the module fields and the names of the Device Configuration... -
Page 63: Fig.: Example - Configuration Wizard Summary
Wizard Summary") Fig.: Example – Configuration Wizard Summary Access the menu “Yield Data” under the “Table” tab with the “End” button. Maximum Plant Size Model Plant size Solar-Log Base 15 15 kW Solar-Log Base 100 100 kW Solar-Log Base 2000 2000 kW Refer to the data sheet on our website... -
Page 64: Manual Configuration Of The Solar-Log Base
Go to the Main Menu. 12�3�1 Manual Configuration of the Solar-Log Base After the device connection has been established and the Solar-Log™ has been connected to the Internet router, the basic configuration of the Solar-Log Base is done via a web browser. All settings made at the initial startup can be changed later at any time. Procedure: • http://solar-log-wxyz Enter in the web browser address bar (wxyz stands for the last 4 digits from serial num- ber of the Solar-Log™). -
Page 65: 13 Main Menu
Main menu 13 Main menu The main menu on the Solar-Log™ is divided into three sections: • Configuration • Diagnostics • Yield data In addition, the following sub-menus are displayed in this view: • Cockpit • Energy flow • Table These are also located on the left side of the of the VLCD Display (see "VLCD Display" section for more details) and in additional sub-menus (depending on connected the devices) and as a selection in the main navigation menu. -
Page 66: Meaning Of The Symbols On The Virtual Lcd Display (Vlcd Display)
Main menu 13�2 Meaning of the symbols on the virtual LCD display (VLCD Display) The following symbols are shown on the Solar-Log™ virtual LCD display: Meaning of the symbols on the virtual LCD display Symbol Meaning Inverter Internet or Network Meter Booting progress Time Input box for fault codes Fig.: Virtual LCD Display - Meaning of the symbols... -
Page 67: Fault Messages
Main menu 13�3 Fault messages Fault messages from the connected devices If a device cannot be contacted by the Solar-Log™ (offline), the respective symbol blinks. OK is not displayed. Fault codes for connected devices The respective component symbol blinks and an "E" is in the first position of the text box. A blinking code is displayed in the second position of the text box. The fault code sequence always starts with "R." That is followed by a blank and then the code numbers are displayed in the sequence. Fig.: Example for a blinking code sequence for Internet - Fault 4 13�4 Normal operation The symbol for the connected components is continuously illuminated. When there are no problems or faults, OK is displayed on the virtual LCD display. -
Page 68: Configuration
Main menu 13�5 Configuration Configuration menu is divided into the following sub-sections: • Network • Internet • Devices • Plant • Smart Energy • Feed-In Management • Direct Marketing • Data • System The following sub-sections of the menu will be explained separately in the following chapters. 13�5�1 Network Configuration | Network The network settings can be accessed from the... -
Page 69: Ethernet
Main menu 13�5�1�1 Ethernet Fig.: Ethernet settings for the first Ethernet interface The network settings for the Solar-Log™ can be defined in the Ethernet menu. 13�5�1�2 Interface ETH 1 This chapter describes the setting options for the first Ethernet interface. Obtain IP address automatically (DHCP) Here the following options are available: • Activate Obtain IP address automatically •... -
Page 70: Fig.: Example Of An Unsuccessful Connection Test
Main menu Primary DNS server In some networks, the DNS server is a separate address for resolving Internet addresses. In this case, the IP ad- dress of the DNS server is entered here. Secondary DNS server Enter a secondary DNS server here if it is required for the network. The secondary DNS server is used to resolve Internet address names when the primary DNS server is not available. Save Once finished, click on Connection Test Use the "Connection Test" button to determine if the entries are correct and if a connection can be successfully established. The message indicates if the connection was successful or not. (See the following illustrations) Fig.: Example of a successful connection test Fig.: Example of an unsuccessful connection test... -
Page 71: Interface Eth 2
Main menu 13�5�1�3 Interface ETH 2 Here there is the option to activate a second Ethernet interface in order to separate the IT network from the PV plant. Note The Ethernet interface does not have any switch functions. Fig.: Active second Ethernet interface As with Ethernet 1, there are two options for IP address: Either a dynamic IP assignment with DHCP (Obtain IP address automatically (DHCP) or assigning a static IP ad- dress. -
Page 72: Proxy
Main menu Note When a second Ethernet interface is required, it is important to note that the IP address of the Solar-Log™ for the second Ethernet interface needs to be “logically” separated network and cannot be the same IP address as defined for the first ethernet interface. Explanation of the example: If the IP address of the Solar-Log™ for the first Ethernet interface is 192.168.0.1 and the subnet mask 255.255.255.0, then the IP address for the second Ethernet interface has to be in another network (logically separated), for example 192.168.2.1 with 255.255.255.0 as the subnet mask. -
Page 73: Internet
Main menu 13�6 Internet Configuration | Internet Select the Internet from the menu. The following tabs are displayed: • Portal • Export (only with license) 13�6�1 Portal The following functions are available in this tab: • Activate/deactivate transfers. • Activated: • Status • Test Note Please download the Solar-Log WEB Enerest™ Home User Manual from our website to efficient- ly use and configure the Solar-Log WEB Enerest™... -
Page 74: Fig.: Example - Transfer Test With An Error Image
Main menu Test section A connection test can be performed in the Test section. A separate pop-up window is displayed with the progress of test. The connection test also indicates if the test was successful or not. If it was not successful, it displays the error. -
Page 75: Export (Only With License)
Main menu 13�6�2 Export (only with license) The automatic data export allows the yield data to be periodically transferred to the server. Various data formats and export intervals are available. Note A 30-day license is available for a new installation. If this function is required beyond that, a license must be purchased. See Chapter 13.16.4 for more information. FTP/FTPS Export Settings section Procedure • Activate Export switch. • Enter server the name of the server name in the box. • Enter user name password from the server access data. -
Page 76: Configuring Connected Devices
Main menu Fig.: Export with deactivated encryption (switch is set to activated) SSL certificate Under SSL certificate, an SSL certificate can be uploaded for a more secure connection. Please refer to the help text for more information about certificates. Status & Test section In this section, the export settings can be tested The information from the last export is displayed. •... -
Page 77: Device Definition
Main menu 13�7�1 Device definition Configuration | Devices | Definition menu is divided into the following sub-sections: • Interfaces • Large External Display • SCB (license required) Configuring the device interface section Configuration | Devices | Definition | The interface for the connected devices needs to be defined from the Interfaces menu before performing a device detection. Procedure: • Go to the plus symbol under " Interface assignments" Fig.: Interface definition via the plus symbol The following window appears: Fig.: Adding components The connected components are selected in the Device class box. The following device classes can be defined:... -
Page 78: Fig.: Overview Of The Selected Components
Main menu • Heat pump • Meter Manufacturer Depending on the device class and/or the selected , additional boxes visible: Type Interface Baud rate Wireless Package Furthermore, an existing can be activated here and the expected reply time for a device con- nected to this bus is increased. Note Caution: Using different manufacturers on the same serial bus may cause communication problems. Only the network interface (Ethernet) can have multiple assignments according to our compo- nent database at https://www.solar-log.com/en/support/. -
Page 79: Device Detection
Main menu • Interface Interface indicates which interface and baud rate the devices are using. SAVE Click on if all of the definitions are correct. Note The number behind the interface (e.g. x1) indicates the number of switching devices for this device type. Note If a driver license needs to be purchased, this indicated with the information symbol and information text under the Interface Assignment Definition (Device Detection) when adding components. 13�7�2 Device Detection During the Device Detection, all of the components that have been predefined in the Configuration | Devices | Definition are searched for and detected. The internal data structure of the Solar-Log™ is prepared for the detect- ed components. -
Page 80: Configuring Devices
Main menu Status message: New device detected, the data is being reformatted. • The Solar-Log™ reboots itself. Note Once the detection has been successfully completed, individual device classes can be removed with the symbol without having to initialize the complete device configuration. 13�7�3 Configuring devices After the Device Detection has been successfully completed, the detected devices have to be defined Configuration | Devices | Configuration in the menu. Depending on the device, different settings might be needed for the configuration. Procedure: • Select the device that needs to be configured in the Device Configuration section. • Depending on the device type, different configuration boxes appear. • The entries for the sections below – Module Fields, Power Output and Descriptions – are mostly identical. Configuring inverters The following values have to be configured for inverters: • Maximum AC Power. • Pac Correction Factor. • Module field. -
Page 81: Generation Information On Pac Correction Factor
Main menu 13�7�4 Generation Information on PAC Correction Factor At photovoltaic plants, several measuring points and power generators (inverters) are combined with one another. The Solar-Log™ evaluates this data and partially looks for any correlations. For example, if the total amount of energy produced based on what the inverters display is compared with the values from calibrated power meters, deviations of up to 8 % can arise. In practice, meters and inverters both can display too much or too little kWh. To correct these inaccuracies in the medium term, the Solar-Log™ firmware uses a PAC correction factor. Calculating the PAC correction factor All yield data are always stored internally without any correction factor. This factor is applied only when the data are displayed. -
Page 82: Configuring Power Meters
Main menu 13�7�5 Configuring power meters An operating mode needs to be assigned to power meters to configure them. Possible operating modes for power meters: • Generator (records the individual producers, e.g. PV inverter or CHP. • Meter for the entire plant (records the complete PV plant output). • Consumption meter (records the complete consumption). •... -
Page 83: Configuring Sensors
Main menu 13�7�6 Configuring sensors Under sensors, the configuration only comprises of activating other sensors. Procedure: • Ambient Temperature Wind activate Use the and/or button to the sensors. • If needed, make assignments to the module field. • SAVE the settings. 13�7�7 Configure the battery The following configurations can be made here for the connected battery. •... -
Page 84: Configuring Ego Smart Heaters
Main menu 13�7�8 Configuring EGO Smart Heaters The EGO smart heater can be selected and configured accordingly from the Device Configuration section in the Configuration | Device | Configuration menu. Procedure: • Select the Smart Heater from the drop-down menu under devices. • Enter the maximum storage temperature [C°]. The maximum storage temperature can range from 40°C to 80°C . When 0 is entered, the settings from the Smart Heater for its potentiometer are used. •... -
Page 85: Configuring Idm Heat Pumps
Main menu 13�7�9 Configuring IDM Heat Pumps Con- The IDM heat pump can be selected and configured accordingly from the Device Configuration section in the figuration | Device | Configuration menu. Procedure: • Select the IDM heat pumps from the drop-down menu under devices. • Select the operating mode from the meter configuration menu. • Configure the device. • SAVE the settings. The following configuration options are available for the operating mode. Operating modes: • Consumption meter mode: • Group selection for PM control with self-consumption. •... -
Page 86: Configuring The Keba Power Charging Stations
Main menu 13�7�10 Configuring the Keba Power Charging Stations The Keba power charging station can be selected and configured accordingly from the Device Configuration sec- Configuration | Device | Configuration tion in the menu. Procedure: • Select the Keba power charging station from the drop-down menu under devices. • The model, address and serial number are automatically applied and cannot be modified. • The following configurations can be made under Charge control: current limiting function •... -
Page 87: Module Fields, Power Output And Descriptions
Main menu 13�7�11 Module Fields, Power Output and Descriptions Module Depending on the device type (power meter, inverter, etc.), different settings can adjusted from the Fields, Power Output and Descriptions menu. See the following chapters: • Configuring inverters, • Configuring power meters and • Configuring sensors. In this section, for example, the device name can be changed and the nominal power (maximum AC output) of the individual devices can be defined. The nominal power (maximum AC output) if the average consumption or the average energy production of a de- vice and is used, for example, for the profile controls (Smart Energy). Note The most exact that the configured nominal power corresponds to the actual consumption, the more accurately the control of consumption via Smart Energy is. - Page 88 Main menu This results in two module fields according to the following table: Division of the module fields Location Inverter MPP Tracker Module field output Barn 1. SB5000TL 2000 Barn 1. SB5000TL 2000 Barn 1. SB5000TL 2200 Barn 2. SB5000TL 2000 Barn 2. SB5000TL 2000 Barn 2.
-
Page 89: Configuring Plant Data
Main menu 13�8 Configuring Plant Data Plant There are settings for the following sections in the menu: • General • Plant groups • Graphic • Forecast 13�8�1 General Environmental performance The CO2 factor per kWh can be setup for each electricity tariff. The value is displayed in g/kWh. Contact your pow- er company for the exact number for this value. The default setting for this value is 700g/kWh. 13�8�2 Plant groups Since the Solar-Log Base can manage up to 100 inverters at the same time, it is helpful to divide these inverters into groups. To provide a clearer overview, these groups are then shown in all selection dialog boxes. The data from each plant group can be presented on its own large external display. Each plant group can also be combined with its own consumption meter. -
Page 90: Graphic
Main menu Procedure: • Configuration | Plant | Plant groups Select from the menu. • use Plant buttons activated , the button needs to be • Name labeled. Under , a plant group can be uniquely • The devices recognized during the Device Detection are now allocated into the device groups. • display list Click on of all of the devices. • check Apply Place a in the box next to the devices that belong to this plant group and select... - Page 91 Main menu Yearly target section Enter the yearly target value from the installer's plant project planning. The unit of this value is kWh/kWp. Funda- mentally, this value depends on the overall irradiation at the plant's location and local factors such as the plant's alignment and shadowing. In Central Europe, this value is roughly in the range from 800 to 1000 kW/kWp. separate yearly target for each for each plant group. If plant groups are used, it is possible to define a Monthly shares & course of sun section In this section, the settings for the following can be configured for each month: •...
-
Page 92: Smart Energy
Main menu 13�9 Smart Energy 13�9�1 Defining Smart Energy Switching The switches that are to be used for the Smart Energy function - switching on appliances in certain consumption or production scenarios - have to be defined and configured (see Chapter "Configuring the device interface"). These switches, as described below, can be configured under the device class definition. Up to 10 switches are available. They can be assigned to either the same manufacturer/model or to different com- binations of manufacturers/models. Procedure: • Configuration | Devices | Definition Switch Go to the menu. -
Page 93: Configuring The Switches
Main menu • Gude: • 1002 • 1100/1001 • 2104 • 2110 • 2301 • Solar-Log: • Smart Relay Box • Smart Relay Station 1x 3.5kW • Smart Relay Station 3x 3.5kW After that, the number of devices still has to be defined; up to 10 devices are available in total. The Smart Relay Box is the only exception here, instead of the device number box, the interface has to be selected. • If the definition is complete, confirm by selecting •... -
Page 94: Smart Energy Switching Groups
Main menu 13�9�3 Smart Energy Switching Groups Configuration | Smart Energy There are two tabs under • Switching groups • Surplus management Switching groups menu is divided into the following sub-sections: • Hardware: All of the detected switches are displayed in this section. • Switching groups: The switch contacts for the switching groups can be added in this section and new switching groups can be created and configured. Switching contacts in the switching groups are activated by the Solar-Log™. Unas- signed contacts are only recorded – as long as the values can be recorded (depends on the hardware). -
Page 95: Fig.: Example - Creating Switching Groups
Main menu Fig.: Example - Creating switching groups Note Click on this symbol to display all of the hardware data that can be accessed and recorded by the Solar-Log™ and to display the target state. - Page 96 Main menu Switch states / Color Definition The switching state of each contact is displayed with the following symbols: Symbol Explanation Text Notes Target state: On If the hardware does not support the current state being read, this symbol Actual state: On is also used to clearly identify a fault case.
-
Page 97: Fig.: Adjustable Switch With Help Text
Main menu Switch definitions There is the option to assign one of the following states with a mouse click. (See illustration: "Adjustable switch with help text"): • All of the contacts are permanently switched off (switch position "left"). • The contacts are switched on according to the configured automatic switching rule. •... -
Page 98: Configuring Switching Groups
Main menu 13�9�4 Configuring switching groups Use this symbol to configure the switching group. The following window appears after clicking on the symbol: Fig.: Control logic configuration window The configuration is divided into two section. The top section contains the following boxes: • Category • Type and • Consumption determination. If the Consumption meter option is selected for the Consumption determina- tion, an additional selection box is displayed with all of the available (sub) consumption meters. For the tem- perature profiles, an additional selection box is displayed with all of the available temperature sensors. - Page 99 Main menu Surplus The following types can be configured under the Surplus category: • Surplus management • Surplus management and Temperature Control • Surplus management and Time Control • Surplus management and Runtime Control • Surplus matrix • Surplus visualization Surplus management: The following consumption definition can be selected in the Surplus management section: •...
- Page 100 Main menu The following settings can be made and/or activated under temperature configuration: • Switch on when temperature is (C°): • greater • less • Runtime (min.): If the appliance was activated because of the temperature threshold, it will be deactivated after this time has passed, even if the minimum/maximum temperature has not been reached. • Minimum/Maximum temperature (C°) (depends on the selection for "Switch on when temperature is (C°) greater or less"): It is applied even if the appliances are activated because of a surplus or the temperature. Surplus management and Time Control: This Consumption determination is identical to Surplus management.
- Page 101 Main menu Note The daily runtime will be set to the value of the new day starting at 0:00 (midnight). That is why it is not possible to have a runtime extending past the particular day. The devices controlled in this section will be turned off at 0:00 (midnight). Surplus matrix: At least two and no more than three contacts have to be assigned to the switching group to use this function. This Consumption determination is identical to Surplus management. In the bottom section, there is a matrix to determine the output of the appliances and with which contacts are linked to in the switching group.
- Page 102 Main menu Consumption With Consumption visualization, its own consumption threshold can be configured for every contact (1-8) assigned to the group. Note This function is only for the visualization and no loads may be switched on since the Solar-Log Base would then have incorrect calculations which would lead to faulty switching operations. Device-specific The following types can be configured under the Device-specific category: • Heat pump with a grid company blocking signal. • Vaillant heat pump with a grid company blocking signal. • Heating rod three level digital. Heat pump with a grid company blocking signal: Heat pumps can have a control input for a grid company blocking signal. This input is used by grid operators via ripple control receivers to release heat pumps at a certain time. If a heat pump can now be run with PV power, this input can be used to switch on the heat pumps in relation to the amount of power being produced.
- Page 103 Main menu Other The Automatic timer type under Other category operates independent of the current PV production and measured consumption. Up to ten daily runtimes can be created by clicking on the plus symbol. Levels that are not needed can be deleted by clicking on the trash can symbol. Generation Information on Thresholds Average values (every 5, 10 or 15 minutes) are generated to balance the fluctuations in PV production (e.g. due to clouds) for managing appliances. The average value is aligned to the threshold set in the respective logic control.
-
Page 104: Control Logics Definition - Operating Mode Generator
Main menu 13�9�6 Control Logics Definition - Operating Mode Generator Various control logics can be defined with the input boxes. The individual boxes can be combined differently, depending on the control is used. The following rules can be selected from the Category box: • Power from the grid • Other Power from the grid The following types can be configured under the Grid Power category: •... - Page 105 Main menu Power from the grid and Time Control: This production determination is identical to that of the grid power. After selecting the production determination, the following sections are to be configured: • Power from the grid • Time The configuration of grid power (see the section "Grid Power" above). Time Up to two daily runtimes can be set in the configuration.
-
Page 106: Smart Energy Surplus Management
Main menu 13�9�7 Smart Energy Surplus Management The Surplus Management menu is divided into the following sub-sections: • Settings and • Surplus priority. (See illustration: "Surplus management") Fig.: Example – Surplus management Settings The following values can be defined in the section: • Measurement values for control logic. • Surplus offset [%]. • Battery charging suspension (only displayed when a hybrid or battery system has been detected). •... - Page 107 Main menu Note Depending on the number of connected inverters, the average value is based on 5, 10 or 15 minute values. < 30 INV: 5 minutes, 30-59 INV: 10 minutes, >= 60 INV: 15 minutes Battery charging suspension: When activated, the Solar-Log™ switches appliances on to prevent the battery from being charged. The battery will only be charged when the respective appliances are deactivated again or when there is still a power surplus despite the consumption from the appliances. Battery discharging suspension: When activated, the Solar-Log™ turns on the generators to provide enough power production to cover the amount required for consumption. This means that the battery is only discharged when the power production cannot cover the consumption. Note Battery (dis)charging suspension The “...
-
Page 108: Feed-In Management
When using the Utility Meter, these additional boxes need to be defined • In this field the agreed grid voltage in the grid operator's medium-voltage network is entered. This value is specified by the grid operator. As a rule the network voltage at medium voltage levels corresponds to 20,000 • UNS: The reference voltage to be entered depends on the sensor used. The medium voltage measuring factory setting is 100.0 V for the Solar-Log™ Utility Meter. UC and UNS settings Medium voltage Medium voltage Utility Meter (U) Utility Meter voltage (U+I) 20000 20000 20000 20000 Note In a master-slave setup, only the connected power on the particular device may be entered for each Solar-Log Base 2000. - Page 109 Main menu Plant passwords Configuration | Feed-in Management | Plant Parame- The log-on data can be entered for the inverters in the ters | Plant Passwords menu – as long as the devices configured support this function.. • Inverter Password: Plant password, if service password is required to access the inverters. • Log-on Mode: If supported by the inverters, a difference can be made between normal and privileged access. With individual modules, privileged access can be required to gain access to power management functions. • Parameter Password: Password which is needed to change critical settings for the inverters, e.g. the GridGuard-Code for SMA invert- ers. Note Please make sure that the inverter password matches the log-on mode. If separate passwords for an inverter can be assigned to users and installers, the correspond- ing password has to be assigned to the log-on mode. Note The Plant Password menu is only displayed when the inverters connected required a password to access the inverters and/or a password to change critical settings.
-
Page 110: Active Power
Main menu 13�11 Active power modes Feed-in Management | Active power The following are available from the menu: • Deactivated • Remote controlled (only with additional Mod I/O module) • Remote controlled with the calculation of self-consumption (only with additional Mod I/O module) • 70% fixed reduction •... - Page 111 Main menu LCD Display section (VLCD Display) In the VLCD Display section, the values that are displayed can be defined. The following values can be selected: • Only error: This is displayed when there are PM control errors. • Target power (% DC): This is the value (%DC) that has been selected for the reduction (e.g. 70%). • Percentage of consumption (only selectable when the "Percentage of consumption for an adjustable reduc- tion"...
-
Page 112: Active Power Deactivated
Main menu 13�11�1 Active power deactivated When this menu item is selected, active power is deactivated. After that, the controllable interfaces can be selected when control is via the Modbus PM or via a PM Profile. 13�11�2 Remote controlled Active Power Restriction (only with additional Mod I/O module) This option should be selected if you want the active power reduction to be remotely controlled by the grid opera- tor. To enable this function, a ripple control receiver or similar device is required. Typically, these devices are provided by the grid operator for a fee. The type of ripple control receiver or telecontrol technology used depends on the level of development of the respective grid operator. The control signals emitted by the grid operator are converted to potential-free signal contacts by the ripple control receiver and can be evaluated via the interface of the Mod I/O add-on module. Note The function of the PM+ interface is only possible when the contacts of the ripple control re- ceiver are potential free and are wired with a supply voltage of 5VDC from the PM+ interface. -
Page 113: Fig.: Schematic Diagram Of A Ripple Control Receiver With Four Relays
Main menu Fig.: Schematic diagram of a ripple control receiver with four relays. These relays are wired to the PM+ interface of the Mod I/O add-on module for active power control. Note The function of the PM+ interface is only possible when the contacts of the ripple control re- ceiver are potential free and are wired with a supply voltage of 5VDC from the PM+ interface. In practice, various ripple control receivers with varying numbers of relays and different signal codes are used. The configuration matrix of the additional module Mod I/O therefore offers maximum flexibility – most common versions can be configured. Ripple control receivers generally possess 2 to 5 relays. The assignment of the individual relay states for certain reduction levels is specified by the respective network operator and stored in the Solar-Log Base using this matrix. In this way the connected inverters can be adjusted to meet the specified reduction levels. -
Page 114: Fig.: Channel Settings For Power Reduction
Main menu Fig.: Channel settings for power reduction For each level, the input signal combination and a value for the power in % is entered. Checking the box next to the digital inputs of the PM+ interface (D_IN_1 to D_IN_4) means that theses inputs are supplied with 5V from pin1 to reduce to the percentage of the set in the box "Power in %". Four levels are shown in the basic setting. The "+" sign can be used to extend the list by additional levels. -
Page 115: Remote Controlled Reactive Power Restriction With The Calculation Of Self-Consumption (Only With Additional Mod I/O Module)
Main menu 13�11�3 Remote controlled reactive power restriction with the calculation of self-consumption (only with additional Mod I/O module) Remote controlled active power reduction This function is an enhancement to the function described in the previous chapter. This function does not correspond to provisions of the German EEG laws and has to be arranged with the grid operator before being used. Note The Solar-Log PM+ needs to be linked to a consumption meter to implement this function. -
Page 116: 70% Fixed Reduction With The Calculation Of Self-Consumption
Main menu Procedure • Select fixed reduction • Select Interface assignments the inverter(s) to control in the section. • SAVE the settings. Note Maximum AC Power Configuration | Devices | Configura- Changes to the of the inverter in tion menu are disabled. Enter your password via the Log-on as Installer / PM to enable changes. Note The 70% reduction is always applied to the entire plant. All of the inverters are controlled on the same level by the Solar-Log™, independent of their alignments (east-west orientation). -
Page 117: Adjustable Reduction
If the difference between the current production and consumption is lower than 70% of the module‘s power out- put, the inverters are regulated accordingly, so that the amount of power at the feeding point is still only at 70% of the connected generator power. 13�11�6 Adjustable reduction This function allows the maximum amount of grid feed-in power to be configured. The reduction level in regard to the amount of connected generator power can be freely defined as a percentage (X%). The Solar-Log Base only regulates the inverters when the amount of feed-in power for the grid has reached the limit. Procedure: • Select Adjustable reduction. -
Page 118: Fixed Reduction In Watts
Main menu 13�11�8 Fixed reduction in watts This function allows the maximum amount of grid feed-in power to be configured. The reduction level in regard to the amount of connected generator power can be freely defined to a particular output level (W). The Solar-Log Base only regulates the inverters when the amount of feed-in power for the grid has reached the limit. Procedure: • Select Adjustable reduction. • Output (W) adjustable reduction Enter the for the • Select Interface assignments the inverter(s) to control in the section. • SAVE the settings. 13�11�9 Fixed reduction in watts with the calculation of self-consumption This function allows the maximum amount of grid feed-in power to be configured. The reduction level in regard to the amount of connected generator power can be freely defined to a particular output level (W). The amount of self-consumption is taken into account for this calculation. The Solar-Log Base only regulates the inverters when... -
Page 119: Reactive Power
• Deactivated. • Fixed value cos (Phi) shift factor. • Fixed reactive power in Var. • Variable cos (Phi) shift factor over characteristic curve P/Pn. • Variable shift factor cos(Phi) (U) (only Solar-Log Base 2000 with Utility Meter). • Variable reactive power via the characteristic curve Q(U) (only Solar-Log Base with Utility Meter) • Remote controlled variable shift factor cos(Phi) (only with additional Mod I/O module). Note The active power reduction mode that needs to be implemented for a particular PV plant is determined by the national laws and guidelines. -
Page 120: Reactive Power Deactivated
Main menu 13�12�1 Reactive power deactivated When this menu item is selected, reactive power control is deactivated. After that, the controllable interfaces can be selected when control is via the Modbus PM or via a PM Profile. 13�12�2 Fixed value cos (Phi) shift factor With this function it is possible to adjust the connected inverters to a fixed shift factor. Using this matrix it is possible to specify a fixed cos (Phi) for certain periods of time. If over the course of one day various shift factors must be adhered to, they can be configured here. If an Utility Meter with power measurement is available, the measurements can be performed at the feeding point. Procedure: • Select Fixed value cos (Phi) shift factor • interface assignments Activate the to control. • from (time) Enter the • Enter the cos (Phi) for this time period. •... -
Page 121: Variable Cos (Phi) Shift Factor Over Characteristic Curve P/Pn
Main menu Reductions The following configuration options are available in the Reductions section. • Max. cos (Phi) inductive/under excited and max. cos(Phi) capacitive/over-excited: A maximum shift factor can be defined wit this the reduction. With this, it can be that less reactive power is fed-in into the grid than allowed in the partial load range in order to maintain the shift factor limits. Note Entering zero as the value deactivates the particular limit. 13�12�4 Variable cos (Phi) shift factor over characteristic curve P/Pn The function allows the cos (Phi) to be adjusted according to characteristic curve P/Pn. With a characteristic curve P/Pn, the ratio of the currently generated power (P) to nominal power (maximum out- put) (Pn) is determined. A cos (Phi) is assigned to ratio by a characteristic curve. -
Page 122: Variable Shift Factor Cos(Phi) (U)
Main menu The characteristic curve displayed changes according to the values entered. 4-point characteristic curve By selecting "4-point characteristic curve" it is possible to define a characteristic curve using four points. Procedure • Variable cos (Phi) shift factor over characteristic curve P/Pn Select from the menu. • Interfaces Activate • 4-point characteristic curve Select • characteristic curve points A, B, C and D Adjust the based on the boxes P/Pn, cos (Phi) and put a check in front of inductive/under-excited • SAVE the settings. The characteristic curve displayed changes according to the values entered. 13�12�5 Variable shift factor cos(Phi) (U) In order to be able to achieve this function, the Solar-Log™ Utility Meter is required in addition to the Solar-Log Base. -
Page 123: Fig.: Q(U) Control Function Diagram Example
Main menu 4-point characteristic curve By selecting "4-point characteristic curve" it is possible to define a characteristic curve using four points. Procedure: • variable shift factor cos(Phi) (U) Select the type • interface assignments Activate the to control. • 4-point characteristic curve Select • characteristic curve points A, B, C and D Adjust the based on the boxes U/Uc, cos(Phi) and put a check in front of inductive/under-excited. • SAVE the settings. The characteristic curve displayed changes according to the values entered. 13�12�6 Variable reactive power via the characteristic curve Q(U) In order to be able to achieve this function, the Solar-Log™ Utility Meter is required in addition to the Solar-Log Base. - Page 124 Main menu Type of characteristic curve section Using this menu item a characteristic curve specified by the grid operator can be stored. In principle a distinction is made here between a 2 point and a 4 point characteristic curve. 2-point characteristic curve By selecting "2-point characteristic curve" it is possible to define a characteristic curve using two points. Procedure: • Variable reactive power via the characteristic curve Q(U) Select as the type. • interface assignments Activate the to control. • 2-point characteristic curve Select • characteristic curve points A and B Adjust the based on the boxes U/Uc, Q/SAmax and put a check in front of inductive/under-excited. • SAVE the settings. The characteristic curve displayed changes according to the values entered. 4-point characteristic curve By selecting "4-point characteristic curve" it is possible to define a characteristic curve using four points. Procedure: •...
- Page 125 Main menu Reductions The following configuration options are available in the Reductions section. • Gradient limit (adjustment rate): If the power company requires a reduction, it has to be configured in this box. (Enter the values in seconds). • Max. cos(Phi) inductive/under excited and max. cos(Phi) capacitive/over-excited: A maximum shift factor can be defined wit this the reduction. With this, it can be that less reactive power is fed-in into the grid than what the characteristic curve allows in the partial load range in order to maintain the shift factor limits. Note Entering zero as the value deactivates the particular limit. 13�12�7 Remote controlled variable shift factor cos(Phi) (only with additional Mod I/O module) This option allows the cos(Phi) shift factor to be remotely controlled by the grid operator. To enable this function, a ripple control receiver or similar device is required. Typically, these devices are provided by the grid operator for a fee.
-
Page 126: Fig.: Schematic Diagram Of A Ripple Control Receiver With Four Relays
Main menu Fig.: Schematic diagram of a ripple control receiver with four relays. These relays are wired to the PM+ interface of the Mod I/O add-on module for active power control. Note The function of the PM+ interface is only possible when the contacts of the ripple control re- ceiver are potential free and are wired with a supply voltage of 5VDC from the PM+ interface. In practice, various ripple control receivers with varying numbers of relays and different signal codes are used. The configuration matrix of the additional module Mod I/O therefore offers maximum flexibility – most common versions can be configured. Ripple control receivers generally possess 2 to 5 relays. The assignment of the individual relay states for a particu- lar shift factor is specified by the respective grid operator and stored in the Solar-Log Base using this matrix. In this way the connected inverters can be adjusted to meet the specified reduction levels. Fig.: Channel settings for remote controlled cos (Phi) For each level, the input signal combination and a value for the shift factor in cos (Phi) is entered. Checking the box next to the digital inputs of the PM+ interface (D_IN_1 to D_IN_4) means that the input is supplied with 5V from pin 6 to reduce the output on the cos phi defined in the box "cos (Phi)". -
Page 127: Fig.: Switching To Reactive Power Characteristic Curves With Certain Signals
Main menu • channel settings Enter the for power reduction according to the specifications and wiring. • Select options. • SAVE the settings. More Options Switching from the remote-controlled cos (Phi) to the possible characteristic curves can be implemented via as- signed combinations of signals to the PM+ interface. Fig.: Switching to reactive power characteristic curves with certain signals If a switch to the characteristic curve operating mode (P/Pn and Q(U)) is required due to a certain ripple control receiver signal, the respective levels for the switch can be entered in the input box. The fields have to be deactivat- ed if there is to be no switching. When the switch is activated, the configuration page reloads itself. The corresponding characteristic curves need to be defined. The settings for the characteristic curves correspond to the procedures described in the chapter „12.12.6 Variable Blindleistung über Kennlinie Q(U)“ . -
Page 128: Fig.: Solar-Log™ Network Configuration
Main menu 13�12�8 Linking - Master/Slave (Solar-Log Base 2000) The linking function is to be used when there are not enough interfaces on one Solar-Log™ or the cable lengths between the Solar-Log™ and the various inverters exceeds the RS485 specifications. The link between the data loggers is established with an Ethernet connection. This TCP/IP connection can be es- tablished with various technologies such as fiber optics, wireless LAN, radio relay. For the Solar-Log™ network it is... -
Page 129: Fig.: Activated Pm+ Profile For A Pm Package
Main menu 13�12�9 Profile Note For certain PM profiles the use is only possible with additional module Mod I/O. For feed-in management, PM+ profiles come with the Solar-Log™ PM Package equipment. These profiles contain the pre-configured settings for feed-in management and enable the PM+ Package I/O Boxes config_pmprofil_NameNetzbetreiber.dat The profiles are provided in the file format. Procedure: • Configuration | Feed-in Management | Profile Select configuration from •... -
Page 130: Fig.: Modbus Tcp Pm Activated
Modbus . After that, a direct marketing package (.bdl) can be loaded under “Integrated OpenVPN Tunnel). For this option, the proper direct marketing package for the plant has to be ordered from Solare Datensysteme GmbH. Once the package has been ordered and is ready to be downloaded, it can be imported via “Upload File.” After the file has been imported, the VPN tunnel connection is establish and the connection to the direct marketer is started. -
Page 131: Fig.: Direct Marketing With Imported Example Package
Main menu Note When the “Remote control option: Modbus” is activated, a 30-day installation license is created. If the function is used after the 30-day, the license needs to be purchased. (Refer to the chap- ter “Licenses”) Fig.: Direct marketing with imported example package 13�15 Data Configuration | Data menu offers several functions in regard to the data recorded by the Solar-Log™ and contains the following options: •... - Page 132 Main menu 13�15�1 Initial yield This function manually imports initial yields from previous recorded daily data into the Solar-Log. This is useful any time that a large amount of data has to be changed and would take too long with the "Data correction" function. The Data import deletes the existing data memory completely before the daily data is imported from a CSV file. Therefore, the data import should be carried out immediately after the startup of Solar-Log™.
- Page 133 Main menu 13�15�2 Data correction Here you can adjust the values for previous days or change daily totals. Procedure • Enter a 6-digit date DD/MM/YY For example: 25.04.20 for 25 April 2020. The following values can be corrected: • Daily yield (kWh) • Daily consumption (kWh) • Daily self-consumption (kWh) • Daily self-consumption Battery (kWh) If consumption or yield values were modified with the data correction option, these corrected values are displayed additionally in the key and in the yield data under the Production | Day and Balances | Day menus. 13�15�3 System backup Configuration | Data | Backup menu offers the following functions:...
- Page 134 Main menu • The file is saved in the download folder. Alternative procedure: • Prepare Click on • After the data has been prepared, the Download option is displayed. • Download Right click with the mouse on • Save link as Select • The file manager of your OS appears. •...
- Page 135 Main menu 13�15�4 Backup Configuration | Data | Backup menu offers the following functions: • Restore data backup from hard drive. • Save data backup to hard drive. • Save data backup to USB • Restore data backup from USB Restore data backup from hard drive section This function restores the backup file with the name solarlog_backup.dat to the Solar-Log™. Procedure: •...
- Page 136 Main menu Saving data backup to USB section With this function, a backup can be saved /Backup directory of a USB stick which is directly connected to the de- vice. Procedure: • Save Touch • The backup is being created. Please wait a moment. • The progress and status of the update are displayed. Finish current measurement Select the USB storage device Save configuration • The solarlog_backup_YYMMDD.dat file is saved in the /Backup directory of the USB stick.
- Page 137 Main menu 13�15�5 Reset Configuration | Data | Reset menu offers the following functions: • Reset the yield data. • Reset the inverter configuration. • Restore factory settings. Resetting yield data section In certain circumstances after an inverter detection, it may occur that incorrect or unusable data is displayed. In this case, the stored data can be deleted without having to reconfigure the Solar-Log™ completely. Procedure: • Click on RESET • If you are sure that the data should be deleted, click on Continue. Otherwise click on Cancel. •...
- Page 138 Main menu 13�16 System Configuration Configuration | System menu has the basic settings for the Solar-Log™ and contains the following tabs: • Access control • HTTPS • Language/Country/Time • Licenses • Firmware 13�16�1 Access control Browser access protection for the Solar-Log™ can be configured in this menu. The following parts of the So- lar-Log™'s browser menu can be restricted with a password: •...
- Page 139 Main menu 13�16�2 HTTPS The following section are located here: • SSL certificate • User-specific certificate SSL certificate An SSL certificate is a code on the web server that secures online communication. When a web browser connects to a website, the SSL certificate provides a secure connection. The Solar-Log™ uses such an SSL certificate. This can be imported into the web browser or the operating system. There is also the option to use your own SSL certificate instead of the Solar-Log™ certificate. There are four different boxes under SSL certificate: •...
-
Page 140: Fig.: Configuring The Time On The Solar-Log
Main menu 13�16�3 Language/Country/Time Configuration | System | Language/Country/Time The following options are available from the menu: • System language of the Solar-Log™. • Country/Location of the Solar-Log™. • System time of the Solar-Log™. • Time synchronization. Language section Procedure: • Language Select the desired in the selection menu. The selected display language applies both to the display and the web browser. - Page 141 Main menu Adjust the time zone Procedure: • Enter time difference in hours (time zone). Default: GMT +1. • Save the entry . Set Day Light Saving Time. Procedure: • Day Light Saving Time settings: Select the corresponding Options: no, CEST (Central European Summer Time), USA, Australia. • SAVE settings.
-
Page 142: Fig.: Solar-Log™ With License Section
Main menu Note Licenses are linked to the device (serial number). The license has to be purchased again if a device has been replaced after the warranty has expired. Note If a Solar-Log™ with a license has a defect during the warranty period, a license can be request- ed for the replacement device. There are no costs involved, provided that the defective device is returned to Solare Datensysteme GmbH. Fig.: Solar-Log™ with license section... - Page 143 Main menu 13�16�5 Firmware The firmware tab offers the following functions: • Information about the current firmware version. • Firmware update options. Status section The firmware version currently installed on the Solar-Log™ is displayed. The version number contains three sec- tions: Version number Build Date 5..1.0 Build 154 20.03.2020 Updating firmware manually section This function allows a new firmware to be imported from a disk. Note Before manual updating, it is important to save the current system data and make a backup.
- Page 144 Main menu Check for Update from the Internet section With this function, the Solar-Log™ contacts the Solare Datensysteme GmbH firmware servers to check if a new version is available and offers to install it. Check for Update from USB With this function, the Solar-Log™ checks the USB stick connected directly to the device if a new version is avail- able. When this function is used, the progress and status of the update are displayed: • Select current measurement and • the USB storage device. Automatic Firmware Updates This function constantly checks if there is a new firmware version for the Solar-Log™. When there is a newer ver- sion, it is automatically downloaded and installed during the night.
- Page 145 Diagnostics Menu 14 Diagnostics Menu Click on Diagnostics in the tool bar to access the Diagnostics menu. left-side navigation The following options can be selected from the menu: • Inverter Diagnostic. • Event log. • Feed-In Management chapter of the Installation Manual. • SCB Monitor (only when SCB active).
-
Page 146: Fig.: Inverter Details Graph
Diagnostics Menu 14�1�1 Inverter details Diagnostic | Inverter Diagnostic | Inverter details. To access the Inverter details menu, go to A particular date and device (e.g. inverter or sensor) can be selected under inverter details and evaluated. Fig.: Inverter details graph In the example (see Fig.: Inverter details graph), the following values for the inverter can be displayed: • • DC power 1 • DC power 2 • DC power 3 • Yield • DC voltage 1 • DC voltage 2 • DC voltage 3 • AC voltage (Uac) – this value is displayed if the inverter supports this function). All of the values displayed in the key can be selected and deselected at anytime with a left-click to display individ- ual values (curve) or to display or hide all values (curves). With a right-click, all of the values (curves) other than the one selected can be hidden. -
Page 147: Fig.: Tracker Comparison Graph
Diagnostics Menu 14�1�2 Tracker comparison Diagnostic | Inverter Diagnostic | Tracker comparison. To access the Tracker comparison menu, go to Two trackers (either from the same device or two different devices) can be compared on a particular date by selecting the date, device and tracker. Fig.: Tracker comparison graph In the example (see Fig.: Tracker comparison graph), two different inverters have been selected and evaluated. The better view has been selected for the DC voltage 1 and 2 values. The two strings from inverter 3 and 1 are directly compared to each other. The gray line displays the degree of deviation. The deviation as a percentage is indicated in the right column. and displayed as a positive or negative percentage. In the example, the deviation between the strings is from about -5% to +5%. The column on the left indicates the kW/kWp output of the tracker. All of the values displayed in the key can be selected and deselected at anytime with a left-click to display individual values (curve) or to display or hide all values (curves). With a right-click, all of the values (curves) other than the one selected can be hidden. -
Page 148: Fig.: Module Field Comparison Graph
Diagnostics Menu 14�1�3 Module field comparison Diagnostic | Inverter Diagnostic | Module field compari- To access the Module field comparison menu, go to son. Fig.: Module field comparison graph Date and Module Field With the boxes, the module field comparison permits all devices (e.g. inverters and sensors) and their strings that are assigned to the same module field to be compared on the current and previous days (see Fig.: Module field comparison graph) in order to more efficiently detect faults from the performance monitoring. -
Page 149: Fig.: Battery Diagnosis - Current Measurement Values
Diagnostics Menu 14�2 Battery Diagnostic Diagnostic | Battery Diagnostic. To access the Battery diagnostic menu, go to The following tabs can be selected from this menu: • Current Measurement Values • Charging History 1-Day. • Charging History 7-Days. • Balances. 14�2�1 Current Measurement Values Current Measurement Values The following values are available from the... -
Page 150: Fig.: Battery Diagnosis - Charging History 1-Day
Diagnostics Menu 14�2�2 Charging History 1-Day Charging History 1-Day A daily graph with the following values is in the tab. • Charge: The battery's charge levels throughout the day in watts. • Discharge: The battery's discharge levels throughout the day in watts. • Charge Level (%): The battery's charge levels throughout the day as a percentage. • U (V): The battery's voltage curve throughout the day in volts. Fig.: Battery diagnosis - Charging History 1-Day Date box offers the option to select a particular day for viewing. The arrow keys can also be used to move to the next or previous date. The individual values, at the top-left of the graph key, can be displayed or hidden with a mouse click. -
Page 151: Fig.: The Event Log Is Being Loaded
Diagnostics Menu 14�2�3 Charging History 7-Days Charging History 7-Days A graph containing the last seven days with the following values is in the tab. • Charge: The battery's charge levels from the last 7 days in watts. • Discharge: The battery's discharge levels from the last 7 days in watts. • Charge Level (%): The battery's charge levels from the last 7 days as a percentage. • U (V): The battery's voltage curve over the last 7 days. Fig.: Battery diagnostic - Charging History 7-Days Date box offers the option to select a particular 7-day period for viewing. The arrow keys can also be used to move to the next or previous date. The individual values, at the top-left of the graph key, can be displayed or hidden with a mouse click. interrupt If needed, click on the button to stop loading the data. -
Page 152: Fig.: Battery Diagnosis - Balance
Diagnostics Menu 14�2�4 Balances Balances The following sections are in the tab: • Electricity savings from battery usage. • Battery efficiency. Electricity savings from battery usage section The following columns are in this section: • Discharge: The battery's discharge during its entire run-time in kWh. • Electricity costs saved: The electricity savings from battery usage during its entire run-time in the defined currency. Battery efficiency section The following columns are in this section: •... -
Page 153: Fig.: The Event Log Is Being Loaded
Diagnostics Menu 14�3 Accessing Event logs Diagnostic | Event logs. To access the Event logs menu, go to The following mode is loaded when accessing the event logs. Fig.: The event log is being loaded. After the event log is available, the mask changes to the standard view. The following settings are available from the four drop-down menus in this view: • Devices: Under devices, you can select individual devices or leave the default selection as is (default "All devices"). • Days: Under days, you can select individual days or leave the default selection as is (default "All days"). • Status codes: Under status codes, you can select individual status codes or leave the default selection as is (default "All status codes"). • Fault codes: Under fault codes, you can select individual fault codes or leave the default selection as is (default "All fault codes"). By default, the current day is displayed in the table with all devices, fault codes and status codes. -
Page 154: Fig.: Feed-In Management - Control State
Diagnostics Menu 14�4 Accessing Feed-In Management Diagnostic | Feed-In Management. To access the Feed-In Management menu, go to Note Feed-In Management Diagnostic | Feed-In Management The menu under only ap- Configuration | Feed-In Management pears if active power has been configured in the section. Fig.: Feed-In Management - Control State... - Page 155 Diagnostics Menu Diagnostic | Feed-In Management The inverter control can be analyzed and adjusted in the settings section. 10% Diagnosis Function There is also a to simulate a dynamic reduction to 10%. The values are displayed in the table. Note The 10% Diagnosis Function can only be used when the 70% Fixed Reduction has been activated.
- Page 156 Diagnostics Menu Value specification from: This field indications how the control value used was determined. Displayed Text Explanation Text PMV_NONE No control source. PMV_CONFIG The value is stored in the configuration. PMV_MODE The value can be determined by the reduction mode. PMV_PR_PIGGY The value comes from the PM (power reduction) input (and is determined in combination with the matrix in the configura- tion or PM profile). PMV_MPR_PIGGY The value comes from the PM (power reduction) input of the master (and is determined in combination with the matrix in the configura- tion or PM profile). PMV_MODBUS_1 The value comes from the ModBus PM V1 interface. PMV_MODBUS_2 The value comes from the ModBus PM V2 interface. PMV_PROFILE_ADAM The value comes from the analog or digital input of the IO Box (Adam Box). PMV_PROFILE_INTERN The value is specified in the PM profile. PMV_ERROR An error occurred while determining the value. PMV_CONFIG_UTILITY The value was determined via the internal configuration based the Utility Meter measurement. PMV_MODBUS_DM The value comes from the ModBus DM interface (direct seller inter- face).
- Page 157 Diagnostics Menu Allowed power (kW): This kW value is the maximum amount of power that is allowed at the grid connection point. The value is calculat- ed based on the generator output and the current power output. Consumption (kW): This value is calculated from the consumption meters and refers to the entire plant. The values displayed in the respective bus column only refer to the plant total and are not taken into account in the corresponding columns. The consumption value is normally subtracted from the allowed power from the entire plant. Control value power (kW): This value is calculated by the Solar-Log™ and is the maximum current power output from the inverters. It is used for the current target power output. Note Due to technical reasons, the calculation from the Solar-Log™ is subject to a rounding factor. This may lead to deviations in the data recording.
-
Page 158: Fig.: Feed-In Management - Feed-Balance
Diagnostics Menu 14�4�3 Explanation of the Values in the Reactive Power Reduction Section The following values are displayed in the Reactive Power Reduction section: Reactive Power determined by: The currently active control source is indicated in this field. Displayed Text Explanation Text PMC_NONE No control source. PMC_DIAG Controlled by the diagnostic mode. PMC_MASTER Controlled by Master Solar-Log™ PMC_MODBUS_2 Controlled by the ModBus PM V2 (new ModBusPM). PMC_MODBUS_1 Controlled by the ModBus PM V1 (old ModBusPM). -
Page 159: Fig.: Pm History
Diagnostics Menu Value specification from: This field indications how the control value used was determined. Displayed Text Explanation Text PMV_NONE No control source. PMV_CONFIG The value is stored in the configuration. PMV_MODE The value can be determined by the reduction mode. PMV_RP_PIGGY The value comes from the PM (reactive power control) input (and is determined in combination with the matrix in the configuration or PM profile). PMV_MRP_PIGGY The value comes from the PM (reactive power control) input of the master (and is determined in combination with the matrix in the configuration or PM profile). PMV_MODBUS_1 The value comes from the ModBus PM V1 interface. PMV_MODBUS_2 The value comes from the ModBus PM V2 interface. PMV_PROFILE_ADAM The value comes from the analog or digital input of the IO Box (Adam Box). -
Page 160: Fig.: Feed-In Management - Feed-Balance
Diagnostics Menu 14�4�4 Feed-balance section Fig.: Feed-In Management - Feed-balance Feed-balance tab displays when there was a grid feed and when electricity was purchased from the grid. Negative values mean that the power was purchased from the grid and positive values mean that power was fed into the grid. Move the mouse cursor over the black line to display the following values for the power reductions: • Time • Percentage (%DC) • Watt... -
Page 161: Fig.: Pm History
Diagnostics Menu 14�4�5 PM History section PM History The power reductions are displayed in a table with three columns in the tab. Fig.: PM History • Event from - to: • The time and date that a power reduction was activated. • Power reduction type determined by: Possible values in this column: • PMC_NONE • PMC_DIAG •... -
Page 162: Fig.: Rs485 Bus Analysis With Janitza As An Example (With Installation Mode Active)
Diagnostics Menu 14�5 Accessing components Components Diagnostic | Components. To access the menu, go to Components The following tabs are available in the menu: • RS485 Bus Analysis • SO Meter (only visible when SO meter is connected) • Wireless Package (only visible when the Wireless package is connected and has been activated) • SCM Monitor (only visible when connected and the SCB license has been activated) 14�5�1 RS485 Bus Analysis The RS485 bus analysis checks the RS485 bus communication and the associated value transmission. The inter- face, device and level have to be selected to perform an analysis. The higher the level, the more details that are in the results. However, it takes more memory and takes longer to process. When the settings are defined, the analysis can be performed by clicking on “Start Analysis.” (see illustration) Fig.: RS485 bus analysis with Janitza as an example (with installation mode active) Once the analysis has been started, an inquiry is sent to the selected device. At the same time, the Solar-Log™ per- forms the bus analysis. The results (inquiry and response) can be viewed in the dialog (see previous illustration). -
Page 163: Fig.: Example Segment Section Of The Enlarged Measured Value Range
Diagnostics Menu The view of the measured values can be enlarged and displayed in more detail using the mouse (either by holding down the right mouse button and dragging the cursor or using the mouse wheel). In the second part, you can also see which section of the measured value range you are currently in. Use the mouse cursor to control the section of the measured value range via the lower section. The measured values for RS485A-A or RS485A-B can also be displayed or hidden. (Refer to the illustrations below.) Fig.: Example segment section of the enlarged measured value range Fig.: Example segment section of the lower measured value range Note! Important for the analysis: Due to technical reasons, the RS485A-A and RS485A-B channels are recorded with a time delay during the analysis. That is why it is normal to have a time delay for both curves. If the "Shift curves" check box is activated, the system corrects this time offset automatical-... -
Page 164: Fig.: Communication Between The Mod I/O And Solar-Log Base
The LEDs indicate the current status of the inputs and outputs. Communication between the MOD I/O and the Solar-Log Base (see illustration under 2): LED (green): Everything is ok with the communication between the MOD I/O and the Solar-Log Base. LED (orange/red): There is a communication problem between the MOD I/O and Solar-Log Base. This may cause limited functionality. -
Page 165: Fig.: Components - S0 Meter On Interface A And B
The connectors between the MOD I/O and the Solar-Log Base indicate the current communication status for each individual function. Green means there is a connection and everything is ok. There is a communication problem between the Solar-Log Base and MOD I/O. if one or more of these connectors are orange or red. This may cause limited functionality. -
Page 166: Fig.: Connection Test - Wireless Package
Diagnostics Menu Note! The Solar-Log™ reorganizes the data every night so the total pulse counter of the S0 meter is reset every night. 14�5�4 Wireless Package (only visible when activated) Diagnosis | Components | Wireless Package You can access the Wireless Package test function from the Fig.: Connection test - Wireless Package To perform a connection test a Wireless Package has to be connected to the Solar-Log™, the interface with the Configuration | Devices | Definition Wireless Package has to be activated in the menu and the inverter has... -
Page 167: Fig.: Example Of The Scb String Overview
Diagnostics Menu 14�6 Access SCM Monitor (only visible when SCB installation mode / license active) Diagnostic | Components | SCB Monitor. To access the SCB Monitor menu, go to Fig.: Example of the SCB string overview SCB String Overview is displayed in a split-screen window. The connected devices (SCBs) can be individually accessed in the top screen via the pull-down menu. The bottom screen displays the current measurements of the individual strings based on the analog and digital number. Note Refer to the SCM manual for a detailed description. -
Page 168: Fig.: Smart Energy History - Example Of Priority 1
Diagnostics Menu 14�7 Smart Energy The following tabs are visible under the Smart Energy menu: • Status (current). • History. • Simulation. Status (current) section Status (current) The following values are displayed as a table in the tab: • Averaging (is visible when managing with average values) • Total Plant. • Priority List: There is also the option in this section to directly switch to the configuration of the Smart Energy switching group by clicking on the arrow symbol in the top right corner. -
Page 169: Fig.: Smart Energy Status (Current)
Diagnostics Menu The selection for "Measurement values for control logic" under Configuration | Smart Energy | Surplus manage- ment determines whether the current values or or average values are displayed for the status. Priority List The priority of the defined control logics are displayed under the Priority list. (See illustration: "Smart Energy Status (current)") Fig.: Smart Energy Status (current) Depending on the device or profile type selected, different information is displayed. For example: available sur- plus, runtime, temperature and charging states when a hybrid or battery system is connected. By clicking on the question mark the current configuration for the switching groups is displayed without switching to the configura- tion section. -
Page 170: Fig.: Smart Energy History - Example Of Priority 1
Diagnostics Menu 14�7�2 History Section Daily graphics, all of the configured control logics and the intelligent appliances are displayed according to their History priority in the tab. All of the relevant data for the particular device is displayed in the graphic. Each graphic has the curves "Total production," Total consumption" and "Total surplus." This is identical for every graphic and is part of the overview with the plant-wide values. (See illustration: "Smart Energy History - Example with EGO Smart Heater - Surplus Priority 1"): All of the values displayed in the key can be selected and deselected at anytime with a left-click to display individual values (curve) or to display or hide all values (curves). With a right-click, all of the values (curves) other than the one selected can be hidden. Fig.: Smart Energy History - Example of Priority 1 Depending on the connected device and configured control logic the labels may be different and also the values may vary (e.g.: runtime and switching status as well as charging states when a hybrid or battery system is connect- ed). - Page 171 Diagnostics Menu Note The selected section can be enlarged by clicking on the graphic and dragging it. Date Certain days can be selected to be viewed with the box. It is possible to scroll the dates back and forth with the arrow buttons. The individual values that are displayed at the top-left of the graph key can be explicitly dis- played or hidden with a mouse click. Basic View The basic view can be activated with a button.
-
Page 172: Fig.: Smart Energy - Simulation With Ego - Surplus Priority 1
Diagnostics Menu 14�7�3 Simulation Section The configured control logics can be simulated under the Simulation tab to check if the logics are correct. The simulation is always based on the the underlying calculated averages. (See the example Figure: "Smart Energy - Simulation with EGO - Surplus Priority 1"). Fig.: Smart Energy - Simulation with EGO - Surplus Priority 1 Similar to the History view, there are various values displayed in the graphic view. These values depend on the particular connected device and/or configured control logic. -
Page 173: Fig.: The Plant's Current Values (Cockpit View)
Diagnostics Menu In the simulation, different view options can be selected for the production and consumption curves. The following options can be selected: • Production curve • Zero line • Increasing • Decreasing • Constant (a fixed value in watts can be defined here) • Normal levels of irradiation • Very high levels of irradiation • Low levels of irradiation • Inconsistent levels of irradiation • Selected day (a particular day can be selected here) • Consumption curve •... -
Page 174: Fig.: Support - General
Diagnostics Menu 14�8 Accessing Support Support Diagnostic | Support. To access the menu, go to Fig.: Support - General Support | General There are three sections under the menu: • System Information: The following information is available in this tab: • Model (type of Solar-Log™). • Hardware (hardware components available for the device). •... -
Page 175: Yield Data Menu
Yield Data Menu 15 Yield Data Menu tool bar Yield Data Click on Yield Data in the to access the menu. The following options can be selected from the left-side navigation menu. • Current values • Production • Consumption (only appears when a consumption meter is connected) • Balances • Sensor (only appears when a sensor is connected) 15�1 Current values Cockpit Current values... -
Page 176: Fig.: Table With The Recorded Output From An Example Plant
Yield Data Menu There are two graphs located below the Dashboard display: • The current day curve (graph on the left): There is also the option to display the previous six days as a curve in this graph. Therefore, just click on the day value in the graph on the right. • The current day value as well as those from the previous 6 days (graph on the right): Move the mouse above one of the bars to display the day value. Click on one of the bars to have it display in the graph on the left as a curve. Additional tabs can be selected in this view: • Energy flow • Table Note! If the Solar-Log™ is just used as a consumption monitoring tool, the menu is limited to Current values Consumption System information... -
Page 177: Energy Flow
Yield Data Menu 15�1�1 Energy flow The plant is displayed as a flow graphic in the Energy flow tab. Fig.: Example of a plant with an energy flow Depending on the particular devices connected, the following values are displayed in the flow graphic in real time: • Production (W) • Consumption (W) • Grid fed / purchase from grid (W) • Battery Status • Charge Status (%) •... -
Page 178: Table
Yield Data Menu 15�1�2 Table The output recorded from the connected devices is displayed as a table in Table tab. Fig.: Table with the recorded output from an example plant Depending on the particular device connected, the following values are displayed: • The current output from each individual inverter. • The total current consumption as measured by the consumption meters. • The current irradiation per m as measured by the sensor. •... -
Page 179: Fig.: Graphic Display Of The Plant's Total Production
Yield Data Menu 15�2 Production Production You can select a graphic display of your plant's production from the menu. Fig.: Graphic display of the plant's total production You can select the following tabs from this display: • • Month • Year • Total Graph Table You can select to display the view as a . The actual values displayed in the graph or table depend on the view selected. Note! The auto scaling option always scales the graphics up as much as possible. The auto scaling can be manually disabled for the respective graphics. Then the scaling is done based on the value defined in the device configuration. Please refer to the the chapter on configuring inverters in the Installa- tion Manual. -
Page 180: Day View
Yield Data Menu 15�2�1 Day view Output Yield tab displays the current day as a curve graph. The values (W) and (kWp), on the top left of the diagram key, can be selected and deselected at anytime with a left-click to display individual values (curve) or to display or hide all values (curves). With a right-click, all of the values (curves) other than the one selected can be hidden. The different values throughout the day can be displayed by moving the mouse along the curve. Fig.: Daily View of the Production Graph with the Auto Scaling activated The following data is graphically displayed in the production day: • Production (kWh) (If the daily yield value is modified with the data correction function, the modifications are displayed in brackets.) • Target (kWh). •... -
Page 181: Fig.: Day View Of The Production Table
Yield Data Menu Fig.: Daily View of the Production Graph with the Auto Scaling deactivated Different values with different units are displayed in the graph. The units used and their colors are defined in the key at the top. Fig.: Day view of the production table When you click on Table , the values from the current output generated will be allocated to the individual inverters and displayed as a table. In this way, you can check the output of every individual inverter at any time. -
Page 182: Month View
Yield Data Menu 15�2�2 Month view Month The tab displays the daily yields from the month as a total in a bar graph. • The daily yield can be displayed by moving the mouse above one of the bars. • Click on a bar to go to the corresponding day view. Fig.: Month view production graph... -
Page 183: Fig.: Month View Of The Production Table
Yield Data Menu Fig.: Month view of the production table Table When you click on , the values: date, yield, specific yield and target (cumulative), current and target are listed for the entire month. -
Page 184: Year View
Yield Data Menu 15�2�3 Year view Year The tab displays the monthly yields from the year as a total in a bar graph. • Move the mouse above one of the bars to display the monthly yield with a comparison of the current and target values in regard to the annual forecast. • Click on a bar to go to the corresponding month view. Fig.: Year view graph Table When you click on , the annual values for the entire year are allocated to each month according to the actual output generated. -
Page 185: Total View
Yield Data Menu 15�2�4 Total view Total tab displays the annual yields as a total in a bar graph. The red line displays the calculated target bal- ance based on the annual forecast. • Move the mouse above one of the bars to display the annual yield with a comparison of the current and tar- get values in regard to the annual forecast. • Click on a bar to go to the corresponding year view. Fig.: Total view graph Table: The plant's total power output (since the monitoring started) is allocated every each according to the output gener- ated. -
Page 186: Consumption (Only When Consumption Meters Are Connected)
Yield Data Menu 15�3 Consumption (only when consumption meters are connected) Consumption From the menu, you can view the exact consumption from appliances that are connected via net- worked "smart plugs" with the Solar-Log 1200, 1900 and 2000 or via a relay. Note! Consumption is only displayed once a meter is connected. Consumption Day Graph The day view can be selected from the menu. The view appears as a with the total con- sumption values. As soon as sub-consumers are connected, e.g. a washing machine or freezer, the view expands to include the tab Details Sub-consumers All of the appliances consuming electricity are shown in different colors here and they are also displayed as in a pie chart at the bottom with the colors in the key. - Page 187 Yield Data Menu Fig.: Graph of daily consumption with meters connected...
- Page 188 Yield Data Menu Fig.: Graph of daily consumption with meters connected and active line graphics...
-
Page 189: Fig.: Graph Of Daily Consumption With Connected Appliances In The Sub-Consumer View
Yield Data Menu Fig.: Graph of daily consumption with connected appliances in the sub-consumer view... -
Page 190: Fig.: Graph Of Daily Consumption With Connected Appliances And Active Line Graphics In The Sub-Consumer View
Yield Data Menu Fig.: Graph of daily consumption with connected appliances and active line graphics in the sub-consumer view You have the option to select additional menu items in the consumption view. • Month displays the Month Graph View as a bar graph. There are two tabs in the Month View, the same as in the Day View: Consumption Overview and the Sub-consumer Overview The total consumption values are displayed in the Consumption Overview as a bar graph. Sub-consumer Overview In the , you see the devices connected as a bar graph with the power consumption dis- played in different colors. Below this, the values are also displayed in a pie chart with the colors in the key. - Page 191 Yield Data Menu There is the option from both views to select the days directly from the individual bars and sections. • Year displays the Year Graph View as a bar graph. There are two tabs in the Year View, the same as in the Month View: Consumption Overview Sub-consumer Overview and the The total consumption values are displayed in the Consumption Overview as a bar graph. Sub-consumer Overview In the , you see the devices connected as a bar graph with the power consumption dis- played in different colors. Below this, the values are also displayed in a pie chart with the colors in the key. There is the option from both views to select the individual months directly from the individual bars and sections.
-
Page 192: Balances
Yield Data Menu 15�4 Balances Balances You can see the relationship between your plant's production and consumption from the menu. The following points are displayed in all of the views (day, month, year and total): • Production • Consumption • Self-consumption The following factors additional displayed when a battery system is connected (see Fig.: Day Balance graph with battery system): • Self-consumption Battery (kWh) • Charge (kWh) •... -
Page 193: Fig.: Day Balance Graph With Battery System
Yield Data Menu Fig.: Day Balance graph with battery system The following tabs can be selected: • • Month • Year • Total The start view displays the current daily values as a graph. -
Page 194: Day Balance
Yield Data Menu 15�4�1 Day balance tab under Balances displays the production, consumption and self-consumption side-by-side as a day curve. The values in the diagram key, can be selected and deselected at anytime with a left-click to display individu- al values (curve) or to display or hide all values (curves). With a right-click, all of the values (curves) other than the one selected can be hidden. Different values with different units are displayed in the graph. The units used and their colors are defined in the key at the top. The different values throughout the day can be displayed by moving the mouse along the curve. Fig.: Daily Balance Graph with the Auto Scaling activated The following data is graphically displayed in the daily balance: • Production (kWh). -
Page 195: Production
Yield Data Menu General definition of the different colored areas within the balance graphs: (see figure: Daily Balance Graph) • Yellow areas - Production. • Red areas - Consumption (Total = not covered by production (red in the graph) + covered by production (green in the graph). • Green area - self-consumption (covered by production - green in the graph) with a percentage (in relation to production). 15�4�2 Month balance Month The tab under balances displays the production and consumption side-by-side in a bar graph. •... -
Page 196: Year Balance
Yield Data Menu 15�4�3 Year balance The Year tab under Balances displays the production and consumption side-by-side in a bar graph. • Move the mouse above one of the bars to view either the monthly yield or consumption with a comparison of the current and target values in regard to the annual forecast. • Click on one of the bars to go to the corresponding month overview. Fig.: Year view balance graph... -
Page 197: Total Balance
Yield Data Menu 15�4�4 Total balance Total tab under Balances displays the production and consumption side-by-side in a bar graph. • Move the mouse above one of the bars to view either the annual yield or consumption with a comparison of the current and target values in regard to the annual forecast. • Click on one of the bars to go to the corresponding annual overview. Fig.: Total balance graph... -
Page 198: Sensor (Only When Connected)
Yield Data Menu 15�5 Sensor (only when connected) Senor A graphic evaluation from the connected sensors can be displayed from the menu. Fig.: Graph of Sensor Box values The following values can be displayed individually: • Irradiation W/m². • Module temperature C°. • Ambient temperature C°. • Wind speed m/s. Different values with different units are displayed in the graph. The units used and their colors are displayed in the key at the top. All of the values displayed can be selected and deselected at anytime with a left-click to display individual values (curve) or to display or hide all values (curves). With a right-click, all of the values (curves) other than the one select- ed can be hidden. You can select and subsequently evaluate certain days with the Date box. Note The menu is only visible once a meter is connected. -
Page 199: Display Definition
Display Definition 16 Display Definition The following sections can be accessed with the touch function (swiping up, down, to the right or to the left). • Values • Status • Configuration • Installation • QR Code 16�1 Generation Display Controls Controls Meaning Further explanation ►... -
Page 200: Values
Display Definition 16�2 Values The values are displayed as a cockpit or energy flow graphic. The following values can be displayed in the cockpit graphic: • Production • Consumption • Battery (when connected) • Feed-in Values Cockpit Energy flow The Energy Flow graphic displays: Fig.: Example of a plant with an energy flow Depending on the particular devices connected, the following values are displayed in the energy flow graphic in real time: • Production • Consumption • Grid Fed / Purchase from Grid •... -
Page 201: Status
Display Definition Note: When the battery is not connected directly, but via a battery meter (bi-directional meter), the battery charge status is not displayed. That is why for the presentation of energy flows that the charge status is displayed with n/a and the charge with 0 W. Energy Flow Color Key • Production: • Green, energy is being generated. •... -
Page 202: Configuration
Display Definition 16�4 Configuration The network and Internet settings can be viewed in the configuration section. The network settings can also be reseted and the factory settings restored. Configuration Network Settings Network Settings Network Set- tings (3) Internet Settings Reset (1) Reset (2) -
Page 203: Installation
Display Definition 16�5 Installation The plant name, the size of the plant as well as the device name and the serial number can be viewed from the "Installation” menu. Missing licenses and their article numbers are also displayed. Installation General Licenses (1) Licenses (2) -
Page 204: Qr Code
Display Definition 16�6 QR Code QR codes, for example, can be displayed and/or processed via a smartphone. • Info Center • Licenses QR Code Info Center Licenses Note! A QR code scanner has to be installed on the smartphone in order to read the QR codes. -
Page 205: Solar-Log Base Leds
Display Definition 16�7 Solar-Log Base LEDs Fig.: Display with LEDs Depending on the operating state, the LEDs can be lit up continuously in different colors. Normal operation Solar-Log Base - LEDs (from top to bottom) Name Color Meaning Power (top) -
Page 206: 17 Faults
Faults 17 Faults 17�1 Error messages 17�1�1 Fault messages time These fault messages are displayed on the virtual LCD display Fault messages Time Error code Message Possible cause or remedy No time/date set Set the time and date or use the automatic time synchronization function Just like error 1 The names have been changed with Firmware 3.0.2. -
Page 207: Portal Transfer Fault Messages
Faults 17�1�3 Portal Transfer Fault messages Portal Transfer Fault messages Error code Message Possible cause/remedy The server address could not The access type was not configured. An alterna- be resolved. tive DNS server is required. The wrong server was entered. The network connection was dis- connected and could not be reestablished. Cannot open socket. Possible causes: Unknown. If this error continues to occur, contact our technical support. -
Page 208: Cleaning And Care
Cleaning and care 18 Cleaning and care 18�1 Cleaning tips Important! Disconnect the device from the power supply before cleaning it! • Clean the device on the outside only with a dry, lint-free cloth. • If the device is very dirty, it can be cleaned with a slightly damp cloth and a commercially available household cleaner. Important! When cleaning, make sure that no moisture gets into the device! 18�2 Care tips • Make sure that the device is not exposed to any moisture or heat , as well as strong sunlight at the location where it is kept. -
Page 209: 19 Disposal
Solar-Log™ contains electronic components that can release highly toxic substances if burned or disposed of along with domestic waste. The Solar-Log™ can either be disposed of at a recycling center (electrical waste) or returned to the manufacturer Solare Datensysteme GmbH. Solare Datensysteme GmbH Fuhrmannstraße 9... -
Page 210: 20 Appendix
Appendix 20 Appendix 20�1 Internet ports If the Solar-Log™ is connected to the Internet via a router, you must ensure that the following ports on the router have been unblocked for the Solar-Log™: Function Protocol Port Server used Notes (outgoing) Name resolution According to the Normally, only the name network configuration or server from the local network 8.8.8.8 (Google Public DNS) is used. when the name cannot be re- solved with the dedicated DNS. Time synchroniza- 0.pool.ntp.org to 3.pool.ntp.org This function tion... - Page 211 Appendix Warning! Please note the specifications for the load of the ripple control receiver's relays. In cer- tain circumstances, the relays have to be connected to intermediate relays. In any case, the inputs D_IN_X have to be supplied with the control voltage (5V DC) from the Solar-Log™ (PM+ interface Pin 1 and 6). Warning! When connecting two ripple control receivers: If the ripple control receiver uses binary signal coding, signal feedback via the ripple control receiver for the reactive power must be prevented by fitting diodes. Warning! Emergency stop commands may not be processed via the Solar-Log™ These com- mands have to function directly with the corresponding protection equipment such as grid and plant protection, section switches and Q/U protection.
-
Page 212: Fig.: Wiring A Ripple Control Receive With Two Relays - Example 1
Appendix 20�2�1 Variation with 4 relays (ENBW >100kWp) Specifications Ripple control receiver signals Level Power out- 100% Wiring Fig.: Wiring a ripple control receive with two relays - example 1 Connecting PM+ terminal connector and ripple control receiver Assignment Meaning Control voltage for active power D_IN_1 Level 1 100% D_In_2 Level 2 D_In_3 Level 3 D_In_4 Level 4 Control voltage for reactive power (unused) -
Page 213: Fig.: Channel Settings For Active Power Reduction - Example 1
Appendix Configuration in browser menu Configuration | Feed-in Management | Active Power Remote controlled active power reduction Fig.: Channel settings for active power reduction - example 1... -
Page 214: Fig.: Wiring A Ripple Control Receive With Two Relays - Example 2
Appendix 20�2�2 Variation with two relays Specifications Ripple control receiver signals Level Power out- 100% Wiring Fig.: Wiring a ripple control receive with two relays - example 2 Connecting PM+ terminal connector and ripple control receiver Assignment Meaning Control voltage for active power D_IN_1 K5 switched D_In_2 K6 switched Control voltage for reactive power (unused) - Page 215 Appendix Configuration in browser menu Configuration | Feed-in Management | Active Power Remote controlled active power reduction Fig.: Channel settings for active power reduction - example 2...
-
Page 216: Fig.: Wiring A Ripple Control Receive With Two Relays - Example 3
Appendix 20�2�3 Variation with three relays Specifications Ripple control receiver signals Level Power out- 100% Wiring Fig.: Fig.: Wiring a ripple control receive with two relays - example 3 Connecting PM+ terminal connector and ripple control receiver Assignment Meaning Control voltage for active power D_IN_1 Level 2 D_In_2 Level 3 D_In_3 Level 4 D_In_4 unused Control voltage for reactive power (unused) -
Page 217: Fig.: Channel Settings For Active Power Reduction - Example 3
Appendix Configuration in browser menu Configuration | Feed-in Management | Active Power Remote controlled active power reduction Fig.: Channel settings for active power reduction - example 3... - Page 218 Appendix 20�2�4 Variation with 5 relays (including emergency stop) Specifications Ripple control receiver signals Level Power out- 100% Emergency stop The relay is continuously activated for a particular level (condition). There is always only one relay that is activated. Wiring Fig.: Wiring a ripple control receive with two relays - example 4 Warning! Emergency stop commands may not be processed via the Solar-Log™ These commands have to function directly with the corresponding protection equipment such as grid and plant pro- tection, section switches and Q/U protection.
- Page 219 Appendix Connecting PM+ terminal connector and ripple control receiver Assignment Meaning Control voltage for active power D_IN_1 Level 1 100% D_In_2 Level 2 D_In_3 Level 3 D_In_4 Level 4 Control voltage for reactive power (unused) Configuration in browser menu Configuration | Feed-in Management | Active Power Remote controlled active power reduction Fig.: Channel settings for active power reduction - example 4...
- Page 220 Appendix 20�3 Digital Interfaces Solar-Log™provides two interfaces for exporting the current data. The data is updated every 15-60 seconds. Warning! The following descriptions for two interfaces are intended for users with a technical back- ground. Solare Datensysteme provides these interfaces without any guarantee and with the exclusion of any legal liability. We do not offer any telephone support for these two interfaces. 20�3�1 Modbus TCP The intention of this interface is to give easy access to the Solar-Log™ internal data for external SCADA like sys- tems. The interface is designed to read out live data of the attached PV-system.
- Page 221 Appendix Live data compact – summarized (complete plant) Live data “compact” summarized is mapped from register 3500-3999. Data Unit Value-Range Adress Number Func Since Description Reg. Code Firmware lastUpdateTime 32bit unsigned 3500 Unixtime when last regis- ter update has happened. 0=no live data yet 32bit unsigned 3502 Total Pac of all inverters and inv-type meters 32bit unsigned 3504 Total Pdc of all inverters 16bit unsigned...
- Page 222 Appendix 20�3�2 Open JSON Interfaces The JavaScript Object Notation (JSON) is a compact data format to transmit data between applications. The objects documented here can be used in connection with other programs. Configuration | System | Access control The open JSON interface can be activated and deactivated from the menu. When activating the interface, a red warning triangle with security information and risks is displayed. Note The open JSON interface is deactivated. To activate the open JSON interface, a user password must first be set. The current data can be accessed via HTTP protocol. To do this an HTTP Post Inquiry needs to be sent to the So- lar-Log™. The object requested has to be in the body: POST /getjp HTTP/1.1 Host: solar-log-xxxx Content Length: 20 Connection: keep-alive Pragma: no-cache Cache Control: no-cache...
- Page 223 Appendix After that the individual data fields can be accessed via the indexes specified in the following table. For example, the current P output is displayed as follows: alert(„The current AC output is: „ + LiveDaten[101] + „ W“); JSON Objects Data point Value range Unit Index Description lastUpdateTime DWORD Time in Time the format dd.mm.yy; hh.minmin, secsec DWORD Total output PAC from all of the inverters and meters in inverter mode DWORD Total output PAC from all of the inverters WORD Average voltage UAC from the inverter DC voltage: WORD Average voltage UDC from the inverter yieldDay...
- Page 224 Dimensions Digital Interfaces 21 Dimensions...
- Page 225 Fig.: Solar-Log Base and MOD I/O without a bus connector Fig.: Solar-Log Base and MOD I/O with a bus connector 18 Fig.: Solar-Log Base and MOD I/O with a bus connector joined together.................. 18 Fig.: Display of the MOD I/O with LEDs ............................. 19 Fig.: Mounting information for the Sensor Box Professional Plus ....................
- Page 226 Fig.: RS485 bus analysis with Janitza as an example (with installation mode active) ..............162 Fig.: Example segment section of the enlarged measured value range ..................163 Fig.: Example segment section of the lower measured value range ................... 163 Fig.: Communication between the MOD I/O and Solar-Log Base ....................164 Fig.: MOD I/O - Solar-Log Base Communication bus/LEDs ......................164 Fig.: Components - S0 meter on interface A and B ........................165 Fig.: Connection test - Wireless Package ............................
- Page 227 List of Figures Fig.: Graph of daily consumption with connected appliances in the sub-consumer view ............187 Fig.: Graph of daily consumption with connected appliances and active line graphics in the sub-consumer view ..... 188 Fig.: Day Balance graph with battery system ..........................191 Fig.: Daily Balance Graph with the Auto Scaling activated ......................192 Fig.: Month view balance graph ............................... 193 Fig.: Year view balance graph ................................194 Fig.: Total balance graph ................................... 195 Fig.: Graph of Sensor Box values ..............................196 Fig.: Example of a plant with an energy flow ..........................198 Fig.: Wiring a ripple control receive with two relays - example 1 ....................210 Fig.: Channel settings for active power reduction - example 1 ....................
- Page 228 Subject to change without notice. Solare Datensysteme GmbH cannot guarantee the accuracy or completeness of the information provided and expressly refuses to accept liability for any errors or omissions in such information. All brands and trademarks contained in this manual are the sole property of the respective manufacturer, which we respect and recognize herewith.
Need help?
Do you have a question about the Solar-Log Base and is the answer not in the manual?
Questions and answers