
Related Manuals for PICO USB DrDAQ


Summary of Contents for PICO USB DrDAQ
- Page 1 USB DrDAQ Data Logger User's Guide usbdrdaq.en-1 Copyright © 2011 Pico Technology Ltd. All rights reserved.
-
Page 3: Table Of Contents
............................35 5 USB DrDAQ scaling files (.DDS) ............................37 6 Calibration 4 Software information .............................39 ............................39 1 Software updates 5 Glossary .............................40 6 Appendix A: Declaration of Conformity .............................41 ..............................43 Index Copyright © 2011 Pico Technology Ltd. All rights reserved. usbdrdaq.en... -
Page 5: Welcome
Use USB DrDAQ to capture fast signals (for example, sound waveforms) Digital output for control experiments Simply plug in to your PC and measure - supplied with both Pico (oscilloscope) and PicoLog (data logging) software Copyright © 2011 Pico Technology Ltd. All rights reserved. -
Page 6: Introduction
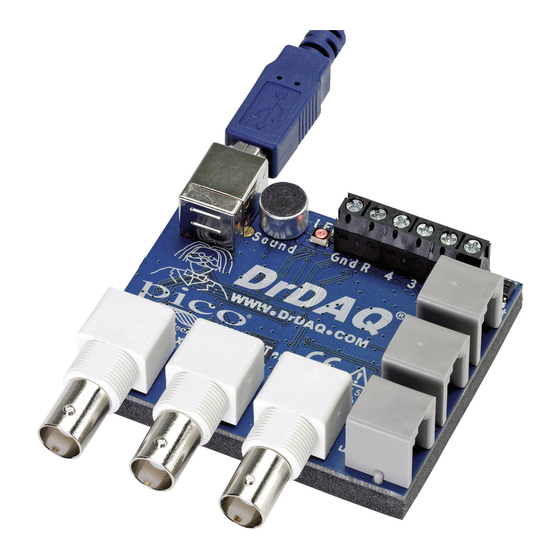
Fax: +44 1480 396296 Web site: www.picotech.com Overview The USB DrDAQ features 14 channels, comprising of sensors, inputs and outputs. These are covered in more detail in Specifications . These connections and sensors cover measurement of sound, light, voltage, resistance, pH levels, and redox potential. -
Page 7: Safety Warnings
AC or DC voltage. For computers that do not have an earth connection (for example, laptops), it must be assumed that USB DrDAQ is not protected by an earth (in the same way a battery multimeter is not protected by an earth). - Page 8 Introduction Fitness for purpose No two applications are the same: Pico Technology cannot guarantee that its equipment or software is suitable for a given application. It is your responsibility, therefore, to ensure that the product is suitable for your application.
-
Page 9: Product Information
Under "Help", select the guided tour which will take you through the main functions in PicoLog. Refer to Examples of digital in/out use for an example of PicoLog and the digital connections of USB DrDAQ. Copyright © 2011 Pico Technology Ltd. All rights reserved. usbdrdaq.en... -
Page 10: Getting Started With Picoscope
"Install Software" link and follow the on-screen instructions. 2. Plug in the USB DrDAQ device. Windows will recognise it and prepare your computer to work with it. Wait until Windows tells you that the device is ready to use. -
Page 11: Displaying Channels
In this example, we have added Tem p . While the trace is running, put your finger on the temperature sensor and notice the rise in temperature. Copyright © 2011 Pico Technology Ltd. All rights reserved. usbdrdaq.en... -
Page 12: Changing The Oscilloscope Timebase
Product information 3.3.3 Changing the oscilloscope timebase The timebase can be adjusted by selecting the drop-down menu shown below. Change the timebase to 50 ms/div to see the change. usbdrdaq.en Copyright © 2011 Pico Technology Ltd. All rights reserved. -
Page 13: Using The Trigger
3.3.5 Adding spectrum views So far we have looked at the oscilloscope functions. PicoScope allows USB DrDAQ to be used as a spectrum analyser as well. The buttons on the top left-hand side control the oscilloscope, and spectrum views. -
Page 14: Adjusting The Rgb Led
When Enable LED C ontrol is active, the LED will not flash when sampling. The USB DrDAQ units include an RGB LED. The colour of this LED can be changed, to do this click the LED icon above the oscilloscope window. The following drop down will... -
Page 15: Controlling The Digital Outs
The USB DrDAQ device includes several digital connections. To activate the digital outs, ensure your accessory is connected both to the G N D of the USB DrDAQ and the digital connection you wish to utilise. To operate the connections click the digital out icon above the oscilloscope window. - Page 16 This allows adjustment of the PW M Period and D uty C ycle values. Refer to Examples of digital in/out use for an example of PicoScope and the digital connections of USB DrDAQ. usbdrdaq.en Copyright © 2011 Pico Technology Ltd. All rights reserved.
-
Page 17: Specifications And Connections
As Ext. 1 As Ext. 1 Signal generator Output 0 - 20 kHz DC-100 kHz 10 mV 0 - 1.5 V Amplitude. running up to ±1.5 V offset. 2MSP/s 2 mV Copyright © 2011 Pico Technology Ltd. All rights reserved. usbdrdaq.en... -
Page 18: Connections
Input channel with 100k pull-up to 2.5 V Ground Sensor type detect with 100k pull-up to 2.5 V Power up to 100 mA @ 5V (not protected/limited) Reference Making your own sensors for further information. usbdrdaq.en Copyright © 2011 Pico Technology Ltd. All rights reserved. -
Page 19: Channel Scaling
External 3 Depends on sensor Digital I/O Off (Low) On (High) Digital I/O Off (Low) On (High) Digital I/O Off (Low) On (High) Digital I/O Off (Low) On (High) Copyright © 2011 Pico Technology Ltd. All rights reserved. usbdrdaq.en... -
Page 20: External Sensors
3.6.1 Overview As well as the built in sensors, USB DrDAQ has sockets for optional external sensors. When a sensor is plugged in to the external sensor sockets, the software detects it and automatically scales readings. For example, if a temperature sensor is plugged in, readings are displayed in °C, or if a humidity sensor is plugged in, readings are... - Page 21 USB DrDAQ User's Guide Using USB DrDAQ with pH Electrodes The pH input on USB DrDAQ is a very high impedance input that is suitable for use with any standard pH electrode. For most applications no calibration is required: just plug in an electrode and measure.
- Page 22 1. Go to Settings and click on Input Channels on the pull-down menu. 2. The converter input type will then be displayed. Check settings and click OK. You should now see the USB DrDAQ measurements box. 3. Select pH and click Edit.
-
Page 23: El029 Reed Switch
You may use the EL029 to connect a simple, single-pole switch (such as a micro- switch) to USB DrDAQ. You will need to obtain a switch and some insulated connecting wire. Remember to keep magnets or magnetic fields away from the EL029 when you use it with an external switch. -
Page 24: Dd101 Humidity Sensor
Do not allow the DD101 sensor to become wet. The DD101 is a non- condensing sensor and liquid entering the case (including condensation) may damage The DD101 may be connected to either Ext 1, Ext 2 or Ext 3 on USB DrDAQ. Tips for use of DD101 Humidity Sensors The sensor responds to humidity changes more slowly in still air. - Page 25 Calibration of the sensor involves: Preparation of the calibration equipment. Measurement of the standard saturated solutions. Creation of calibration data for the USB DrDAQ software. A check that the calibrated sensor is accurate. Note: You must measure at least two different standard solutions to provide two or more fixed points for calibration.
- Page 26 Because the humidity produced by the standard solution depends on temperature, you should use your test container inside an insulated box. A domestic cool box (without the cold blocks) is suitable. usbdrdaq.en Copyright © 2011 Pico Technology Ltd. All rights reserved.
- Page 27 Connect the DD101 and DD100 sensors to USB DrDAQ. Take your measurements Start the PicoLog Recorder software for USB DrDAQ. Make sure USB DrDAQ is receiving readings from the sensors on Ext 1 or Ext 2. Seal the test container and close the insulated box (if you are using a fan, start the fan).
- Page 28 When the two are in agreement use the values given by the calibrated reference as the correct figures for your data table.] Once you have your calibration data you must enter it into the Pico software to calibrate the sensor:...
-
Page 29: Dd103 Oxygen Sensor
You can check whether a sensor is working properly or not by running through the calibration procedure. If you find that the sensor values differ from the standard values by more than 10% you may have a damaged sensor. In this case contact Pico for assistance. - Page 30 (calibration is necessary to use the sensor with ±3% accuracy). If you have not yet set up USB DrDAQ with PicoLog, do so using the PicoLog help file before continuing below: 1. Connect the Oxygen Sensor to the socket labelled Ext1 on the USB DrDAQ unit 2.
- Page 31 USB DrDAQ User's Guide PicoLog's monitor view should now display 20.9% (or very close) for the oxygen content in air. If so, you've successfully calibrated your USB DrDAQ oxygen sensor. Storing the Oxygen Sensor Ensure that the storage temperature and humidity ranges in the specification are not exceeded.
-
Page 32: Making Your Own Sensors
This is a hardware limitation and any signals outside this range will not be read by the unit. Any voltages greater than ± 30 volts fed directly into the device are likely to damage the unit, and can cause errors with all other USB DrDAQ readings. usbdrdaq.en... -
Page 33: Powering The Sensor
The Signal Input channel has 100 kΩ pull-up resistors to 2.5 V, so that the input can be either a resistance or a voltage. Here is a block diagram of a typical USB DrDAQ sensor: 1 = Signal input 2 = Ground... -
Page 34: Scaling
There are many factors to take into account when designing scaling circuitry: Sensitivity The USB DrDAQ has 12-bit resolution over the 0 to 2.5 V input range. This means the sensitivity is: 2500 mV / 2^12 = 0.611 mV To make the most of the resolution, the signal output from the sensor should use as much of the input range of the USB DrDAQ as possible. - Page 35 It is quite usual to see offsets in output signals from sensors. Sensor output The USB DrDAQ requires an input signal in DC volts or resistance. The sensor in question could give an output in other units such as resistance, current or AC volts. Drift It is possible that the sensor output drifts over time.
- Page 36 A suitable resistor (R) for the USB DrDAQ is 120 ohms. This would give (using Ohm's Law): 0.4 volts at 4 mA 2.4 volts at 20 mA P = VxI Therefore >50 mW resistor required. usbdrdaq.en Copyright © 2011 Pico Technology Ltd. All rights reserved.
- Page 37 Example 3: Measuring 10 volts Notes: This is a simple circuit that uses a potential divider to reduce the voltage going into the USB DrDAQ by four. R1 = 3k & R2 = 1k The resistors are calculated using Ohm's Law, V=IR. Auto-Detect Auto-detect resistor is placed between Ground (Pin 2) and Signal Detect (Pin 3).
-
Page 38: Examples Of Digital Out Use
USB DrDAQ using the M ask and A larm functions of PicoScope. With USB DrDAQ connected and PicoScope open: Connect the LED to the G N D connection on the USB DrDAQ and digital connection 2 (refer to Connections). Note: Any digital connection can be used but we are using 2 in this example). -
Page 39: Usb Drdaq Scaling Files (.Dds)
The meanings of the terms in the file are as follows: .DDS [Scale1] A unique number, from 1 to 99, to identify this entry. (Pico-created numbers are from 100 upwards.) Resistor=1 The ID resistor value in kiloohms. In this example "... - Page 40 1100 Light 1000 LongName=Temperature Used in PicoLog ShortName=TempC This field is not used by USB DrDAQ running PicoScope or PicoLog. Units=C Displayed on graphs MinValue=-40 MaxValue=120 Note: For PicoScope these values will determine the maximum and minimum values displayed in Oscilloscope View. For PicoLog these values determine what Maximum range is displayed in the Graph View (set in the Graph Options dialog).
-
Page 41: Calibration
Single-Point Calibration. This only occurs in one circumstance: O n e p air o f valu es is k n o w n - for example on the USB DrDAQ oxygen sensor. The sensor is known to output 0mV at 0% oxygen content. Therefore we only need to find one other pair of values. - Page 42 Both PicoLog and PicoScope have the facility to manually enter look-up tables (see the respective help files). You can also make a more permanent reusable scaling table with USB DrDAQ Scaling Files (.DDS) usbdrdaq.en Copyright © 2011 Pico Technology Ltd. All rights reserved.
-
Page 43: Software Information
The latest versions of PicoScope can check for updates automatically and will advise you if an update is available. The latest version of all our software can be downloaded free of charge from the Pico Technology web site at http://www.picotech. -
Page 44: Glossary
-100 mV and +100 mV. Input voltages outside this range will not damage the instrument as long as they remain within the protection limits stated in Specifications table. usbdrdaq.en Copyright © 2011 Pico Technology Ltd. All rights reserved. -
Page 45: Appendix A: Declaration Of Conformity
USB DrDAQ User's Guide Appendix A: Declaration of Conformity Copyright © 2011 Pico Technology Ltd. All rights reserved. usbdrdaq.en... -
Page 47: Index
Temperature sensor Timebase changing Humidity interface Trigger Laptops 2, 3 LEDr 11, 34 Legal information Making your own sensors Measuring pH Meter view Overvoltage protection 2, 3, 13 Oxygen sensor Copyright © 2011 Pico Technology Ltd. All rights reserved. usbdrdaq.en... - Page 49 USB DrDAQ User's Guide Copyright © 2011 Pico Technology Ltd. All rights reserved. usbdrdaq.en...
- Page 50 Pico Technology James House Colmworth Business Park ST. NEOTS Cambridgeshire PE19 8YP United Kingdom Tel: +44 (0) 1480 396 395 Fax: +44 (0) 1480 396 296 www.picotech.com usbdrdaq.en-1 01.01.11 Copyright © 2011 Pico Technology Ltd. All rights reserved.
Need help?
Do you have a question about the USB DrDAQ and is the answer not in the manual?
Questions and answers