Table of Contents
Advertisement
Quick Links
3
ATTO
Spectrometer
3
Atto
Manual 1.6
Jun 2020
Disclaimer:
By using this product, you agree to the terms and conditions of the non-disclosure agreement
(NDA), and further to the lending agreement or to the license agreement or to the general
T&Cs of sales.
Attonics Systems reserves the right to make changes, corrections, modifications or
improvements, to this document, and the products and services described herein at any time,
without notice.
Limit of Liability
Every effort has been made to make this manual as complete and as accurate as possible,
but no warranty or fitness is implied. The information provided is on an "as is" basis. Attonics
Systems assumes no liability whatsoever relating to the use of product by you or third parties.
ATTO
3
Manual 1.6
1
Advertisement
Table of Contents

Summary of Contents for Attonics Systems ATTO3
- Page 1 (NDA), and further to the lending agreement or to the license agreement or to the general T&Cs of sales. Attonics Systems reserves the right to make changes, corrections, modifications or improvements, to this document, and the products and services described herein at any time, without notice.
-
Page 2: Table Of Contents
Table of Contents TABLE OF CONTENTS ........................ 2 MANUAL REVISION HISTORY ....................3 WHAT’S INSIDE THE BOX ......................4 BEFORE YOU START ........................4 CAUTION ............................4 DEVICE FEATURES ........................5 TECHNICAL SPECS ........................6 QUICK STARTUP GUIDE ......................7 GENERAL INTRODUCTION ...................... -
Page 3: Manual Revision History
Manual Revision History Release Date Notes Affected Sections 08/07/2019 First Formal Release 04/11/2019 Updated Software look and feel and added technical notes 04/12/2019 Added software features, application notes 12/03/2020 Added White referencing procedure to the appendix AN1. 2/6/2020 Added section App3: Recording ATTO Manual 1.6... -
Page 4: What's Inside The Box
What’s Inside the Box Caution Attonics Spectrometer Mechanical Shock This product is sensitive to mechanical shock, improper handling can cause permanent damage to the product. Do not handle or expose to shock while product is in operation. Handle with great care. -
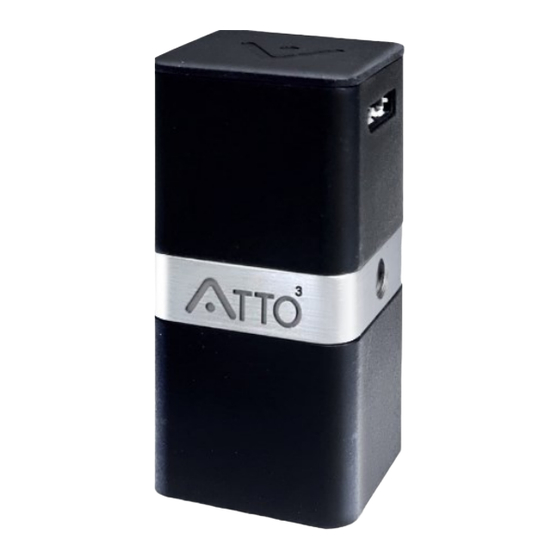
Page 5: Device Features
Device Features 1. Reference Standard / Safety Cover 2. Female USB 3.0 Micro B port 3. Tripod Socket 4. LED Indicator 5. Snap Button 6. Spectrometer Entrance Port Figure 2. ATTO Manual 1.6... -
Page 6: Technical Specs
Technical Specs Wavelength Range 380 nm – 1020 nm Peak Repeatability < 1 nm FWHM 12 nm (customisable to 2 nm) > 1000:1 Dynamic Range 12 bit Integration Time 10 µs to 1 s Numerical Aperture 0.3 * Measurement Speed 50 frames per sec* White High CRI LED LED*... -
Page 7: Quick Startup Guide
Install the software located inside the flash-drive provided by Attonics. Run the attonicssetup1.X.X.exe using administrator privileges. Password for the setup is “atto3”. In case of an error during auto-launch of Attoview.exe, please ignore and open it manually from the installed location. - Page 8 ATTO Manual 1.6...
-
Page 9: General Introduction
General Introduction Attonics Systems is disrupting the field of spectroscopy. Our innovative spectrometers are based on a novel interferometer design that allows the spectrometer to be as compact as possible yet comparable to a lab grade spectrometer. Our patented manufacturing technique enables a new platform for spectroscopy based on interferometry instead of conventional gratings. - Page 10 776.4 1000 Wavelength (nm) Fig. 2: a) Typical interference pattern for oxygen plasma, b) Spectra computed from the interference pattern. The oxygen plasma is maintained with a 20 SCCM gas flowrate at a pressure of 150 mTorr and 100 W RF Power. The inset of the figure shows a magnified view of oxygen emission lines in the spectral band ranging from 750 to 890 nm.
-
Page 11: Spectroscopy Introduction
Spectroscopy Introduction What is spectroscopy? Spectroscopy in its broadest sense is the study of the interaction between matter and electromagnetic radiation. Spectroscopy involves separating light into its constituent wavelengths and reading out the intensity distribution versus wavelength. Different methodologies of spectroscopy provide information of the sample based on its interaction with electromagnetic radiation. - Page 12 Typically, Beer’s law is used for the calculation of absorbance for liquid/solution samples. According to Beer’s Law (also known as Beer-Lambert law) that the absorbance of a solution will depend directly on the concentration (c) of the absorbing molecules and the pathlength (l) travelled by light through the solution. ��...
- Page 13 source spectrum spans from 400 to 750 nm, hence the reflectance plot is only plotted from 400 to 750 nm. All related colour information such as colour coordinates (CIE, CIE LAB, sRGB) are computed from the reflectance spectrum R λ Consequently, the correct measurement of I by appropriate selection of a λ...
-
Page 14: Software Description
Software Description AttoView Software Main Screen Spectrometer’s settings such as gain and integration 1 Controls time are set here. 2 Spectrum Window This is where the spectrum appears. Acquisition Modes, Collect Dark, Reference, Bright And Post processing of spectra can be done here: 3 Main toolbar Scope, Dark Correction (DC), Reference Correction (RC), Reflectance/Transmittance Mode (R/T) -
Page 15: Software Features
Software Features Acquisition Modes Live Acquire: This is a continuous (free run) acquisition mode. The spectra are collected as rapidly as permissible by the spectrometer. For continuous or transient monitoring, this acquisition method is recommended. Snap: This mode enables software triggered single shot spectrum acquisition. -
Page 16: Indicator Bar
AE min Sets the minimum exposure time limit for AE mode. AEmax Sets the maximum exposure time limit for AE mode. Units Intensity is set in counts. Wavelength is set in nm. Presently, the units are fixed and in future versions, the units can easily be changed by user. -
Page 17: Saving Data
Progress Bar During averaging, the progress bar updates from 0 to 100 as it captures entire sequence. Saving Data Save spectrum: This icon opens a save file dialog for user to save the current spectrum in a folder. Quick Save saves the file instantly without opening a file dialog to a preassigned file path in the scan opts widget. -
Page 18: Spectral View Modes
Spectral View Modes Scope Scope Mode(S): Shows only raw spectrum with no post processing. Reflectance: Divides the processed spectrum with bright spectrum Reflectance yielding reflectance based on the measurement methodology. Spectral Processing Dark Correction(DC): Subtracts the dark spectrum collected before. Here, icon denotes that it is enabled. -
Page 19: Applications
Manual Scale: Set the manual scale as per user’s requirement to specific plot limits. Opens a dialog box as seen on the right. Peaks: Peak Finding allows a user to see the values of peaks on data. The threshold can be set to absolute or relative. The peak threshold and minimum distance is set Peaks using the Peak Finding Controls within the... -
Page 20: Illumination Control
Illumination Control Active Illumination for active spectrometers includes three different exclusively enabled modes: Flash Off, Flash Auto, Flash On. Flash Off: This mode renders the spectrometer to act as a passive device. The lights provided by our spectrometer are switched OFF and spectrometer collects the spectrum of external light sources. -
Page 21: App 1: Colorimetry
App 1: Colorimetry In AttoView, Colorimetry is done based on D65 illuminant and 1931, 2 degree observer data for colour matching functions. Please follow the steps below to get the best results. Standard Procedure Set the Integration Time to 25 ms and Averages to 5. Please increase the integration times and averages to get more stable data. - Page 22 CIE Lab plot showing the wheel with CIE xy plot with x, y values plotted a,b values and L on the side bar. on the colour gamut. ATTO Manual 1.6...
-
Page 23: App 2: Time Series
App 2: Time Series In many scientific measurements, processes need to be monitored as a function of time to obtain new insights about the nature of the process. The time dependent spectral or colour change of an evolving process can be captured with the help of time series measurements. -
Page 24: App 3: Recording
Some measurements are very time critical and need fast sampling of data. Since Atto3 measures and computes the spectrum, the computation could delay the measuring rate of an experiment. This app allows you to record the raw data in the maximum allowed frame rate from the detector. -
Page 25: Appendix Notes
processing occurs, and the spectrum files are saved in the folder specified. The progress bar keeps track of the recording and the post-processing. If anything is amiss, you can abort the recording by clicking on Abort button. Appendix Notes AN1. Choosing the correct white standard for Colorimetry Conventionally, pure white reference surfaces are used in spectroscopy. -
Page 26: Troubleshooting
Following are the steps to execute in AttoView software to perform colorimetry using Atto white lid referencing: Tip: Ensure a dark spectrum is collected and all spectra are compensated using the “Subtract Dark Spectrum” button in the software toolbar 1. Switch the device into either of the flash ON modes. 2.
Need help?
Do you have a question about the ATTO3 and is the answer not in the manual?
Questions and answers