Table of Contents
Advertisement
Quick Links
Advertisement
Table of Contents

Summary of Contents for General Photonics PMDPro PMD-1000
- Page 1 PMD-1000 PMDPro™ Polarization Optimized PMD Source Operation Manual Version 2.1 November 16, 2015 General Photonics Corp. Ph: (909) 590-5473 5228 Edison Ave. Fax: (909) 902-5536 Chino, CA 91710 USA www.generalphotonics.com Document #: GP-UM-PMD-1000-21 Page 1 of 122...
- Page 2 Failure to comply with these precautions or with specific warnings elsewhere in this manual violates safety standards of design, manufacture, and intended use of the instrument. General Photonics Corp. assumes no liability for customers’ failure to comply with these requirements.
-
Page 3: Table Of Contents
Table of Contents: Section 1. Specifications: ....................5 Section 2. Overview: ......................6 Section 3. Feature Description:..................7 3.1 Optical Features:...................... 7 3.2 Electrical Features:....................8 Section 4. Operation Instructions:................11 4.1 Unpacking ......................11 4.2 Front Panel Operation................... 11 4.2.1 MONITOR: .................... - Page 4 5.3 Instruments required for PMD related tests ............ 108 5.4 Desirable features for a PMD source ..............111 5.5 The polarization optimized PMD source ............111 5.6 Advantages and applications of the polarization optimized PMD source ..114 Section 6. Troubleshooting:..................116 Section 7.
-
Page 5: Section 1. Specifications
Section 1. Specifications: Physical Features: Dimensions 2U, 19 inch ¾ rack width 3.5” (H) × 14” (W) × 14” (L) Connector Type FC/PC, FC/APC, SC/PC, or SC/APC 10 °C to 50 °C Operating Temperature −20 °C to 60°C Storage Temperature Optical Characteristics (Typical): Operating Wavelength Range C band or L band... -
Page 6: Section 2. Overview
Section 2. Overview: General Photonics’ PMDPro™ is a breakthrough PMD source that can deterministically generate precise 1 -order PMD up to 180 ps and 2 -order PMD up to 8100 ps . It combines this basic functionality with a rapid switching time (~1 ms) and polarization optimization capability to enable various applications related to high bit-rate optical fiber communication links. -
Page 7: Section 3. Feature Description
(typically FC/PC or FC/APC) fiber adapter, other interchangeable inserts are available. For additional information on different input fiber adapter inserts, please contact General Photonics. External fiber connectors should be cleaned using industry standard cleaning methods before connection to the PMDPro. If this procedure is followed before each connection, the instrument’s internal connector ferrules should not need regular cleaning. -
Page 8: Electrical Features
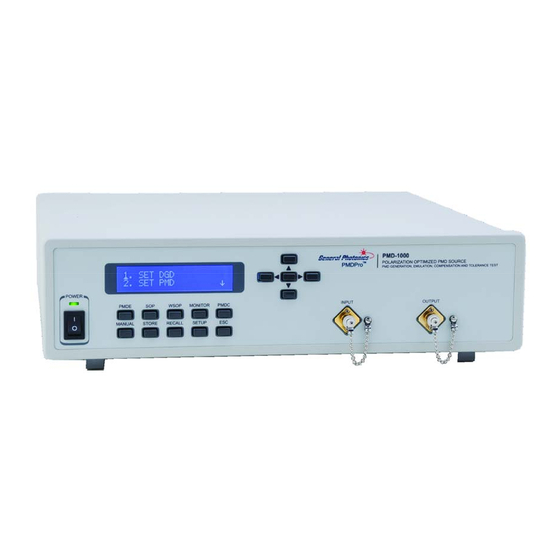
Input power should be between –10 and +10 dBm. 3.2 Electrical Features: The PMDPro system uses a power supply that accepts 100-240 VAC, 50-60 Hz line voltages. Due to high voltage, the following safety precautions must be exercised during operation. •... - Page 9 Figure 3 Front panel layout Front panel description: LCD display: displays data and operation mode information Power: power on/off switch Input: universal connector interface adapter for optical fiber input Output: universal connector interface adapter for optical fiber output Keypad: control button descriptions: PMDE: DGD/PMD setting, scan, and emulation functions SOP:...
- Page 10 Figure 4 rear panel layout Rear panel description: USB: USB interface port RS-232: serial communication port Ethernet: Ethernet interface port BNC: not used in PMD-1000 GPIB: GPIB interface port Line: external AC supply input connector, 100-240VAC : chassis ground connector Document #: GP-UM-PMD-1000-21 Page 10 of 122...
-
Page 11: Section 4. Operation Instructions
Setup procedure is described below: 1. Make sure local AC voltage matches the AC voltage requirement of the PMDPro. If not, do not proceed. Contact General Photonics immediately. The PMDPro power supply accepts 100-240 VAC, 50-60 Hz line voltages. 2. Connect power cord and plug it into the wall receptacle. Make sure the ground pin of the power cord is connected to earth ground. -
Page 12: Monitor
When the PMDPro is first powered on, the LCD will briefly flash the following initialization screen, which shows the model number and firmware version. GENERAL PHOTONICS PMD-Pro VER 2.0 4.2.1 MONITOR: After the initialization is finished, the PMDPro goes into monitor mode. The LCD displays: DOP: xx.xx%... -
Page 13: Setup
4.2.2 SETUP: Pressing the SETUP key accesses a setup menu that allows the user to configure the GPIB address (range 1~30) and operating wavelength (87 ITU grid channels for the C- band model), to query the IP address, and to clear the PMD sequence memory banks. When the SETUP key is pressed, the LCD displays 6 menu options on 3 screens: 1. - Page 14 Use the left and right arrow keys to move the cursor and the up and down arrow keys to increment the digits. The range of available addresses is 1 to 30, and the default value is 5. Once the value is set, pressing the ENTER key executes the setting and returns the display to the SETUP menu.
-
Page 15: Pmde
6. INIT PMDE MEM-BANK Clears stored values from the selected PMD sequence memory bank and restores it to its default configuration. When this option is selected, the following screen is displayed: INIT PMDE MEM-BANK: A (SELECT BNK TO INIT) The cursor will blink on the memory bank index position (A, in the current example). - Page 16 Figure 5 shows the PMD states covered by the PMDPro’s discrete and continuous PMD generation modes. 2500 9000 8000 2000 7000 6000 1500 5000 1000 4000 3000 2000 1000 DGD (ps) DGD (ps) 90ps PMDPro 180ps PMDPro 2500 10000 2000 8000 1500 6000...
- Page 17 When the PMDE key is pressed, the LCD displays 6 menu options on 3 screens: 1. SET DISCRETE PMD ↓ 2. SET CONTINUOUS PMD 3. SCAN DISCRETE PMD ↑ 4. PMD TRACE SCAN ↓ 5. DGD-PMD EMULATION ↑ 6. SCAN PMD-MEM BANK Use the up and down arrow keys to move between menu options and the ENTER key (the center key in the arrow keypad) to select the desired option.
- Page 18 2. SET CONTINUOUS PMD In this mode, the user inputs the desired output DGD (in units of ps) and SOPMD (in units of ps ). The PMDPro then calculates and displays the closest achievable match to the DGD and SOPMD values input by the user. At this point, the user can either choose to execute the setting or modify the requested values and recalculate.
- Page 19 When the DGD and SOPMD values are set, press the ENTER key to calculate the closest available matches to the requested values. If the requested SOPMD is out of range, the PMDPro will flash an “SOPMD out of range” error message before returning to the PMD selection screen.
- Page 20 e. RNG: _5.0, 60.0 ps (set: min and max) ↑ Use the up and down arrows to move between scan setup options and the ENTER key to access the setup screen for the selected option. a. START: This option starts the scan. Use the other options to perform the scan setup, then return to option a) to begin the scan.
- Page 21 e. RNG: This option appears only if “DGD Only” is selected for option b). It allows the user to set the lower and upper DGD limits for the scan. Range: 0.0 to 91.0 for 90 ps PMDPro. 0.4 to 182.4 for 180 ps PMDPro. 4.
- Page 22 When the PMD Trace scan function is selected, the following screen is displayed: A. CONTINUOUS TRACE B. STEP TRACE A. CONTINUOUS TRACE: In continuous trace mode, the PMDPro varies the PMD along the selected curve using the minimum DGD step size of 0.1 ps. The user can select the DGD variation rate, in ps/s.
- Page 23 b. Rng: This option selects the demi-arc to be traced by specifying the DGD range. Two DGD values are shown on this line. The first DGD value listed is the endpoint on the DGD axis. Use the left and right arrow keys to select the digit to be changed, and the up and down arrow keys to increment the active digit.
- Page 24 B. STEP TRACE: In step trace mode, the PMDPro varies the PMD along the selected curve using a constant, user-selected step size and dwell time per point. The setup screens for step trace mode are as follows: a. START (stp TRACE) ↓ b.
- Page 25 A. DGD ONLY EMULATION B. PMD EMULATION Select the desired option and press ENTER. A. DGD ONLY EMULATION: The setup screens for first-order PMD emulation are as follows: a. START (DGD Emula) ↓ b. AVERAGE DGD: 10.0ps c. SAMPLE NUM: _ _1000 ↑ d.
- Page 26 d. CYCLE NUM: This option sets the number of times to run the emulation. The cycle range is 1-99999. Use the left and right arrows to move between digits and the up and down arrows to increment the selected digit. The ENTER key sets the number of cycles to the displayed value.
- Page 27 arrows to increment the selected digit. The range for average DGD is 0.0 to 30.0 ps for the 90-ps PMDPro and 0.0 to 60.0 for the 180 ps PMDPro. The ENTER key selects the displayed value. c. SAMPLE NUM: This option specifies the number of samples in the distribution. Use the left and right arrows to move between digits and the up and down arrows to increment the selected digit.
- Page 28 a. START: This option starts the scan. Use the other options to perform the setup, then return to option a) to begin the scan. During the scan, if a discrete mode PMD value is stored at the current location, the screen displays: PMD ID#: 0039 CY: 0000 13.92 ps...
-
Page 29: Sop
e. INTERVAL: This option sets the dwell time per point, in ms. Use the left and right arrows to move between digits and the up and down arrows to increment the selected digit. Note that a particular memory bank can store discrete mode PMD states, continuous mode PMD states, or a mixture of the two. - Page 30 Use the up and down arrow keys to move between menu options and the ENTER key (the center key in the arrow keypad) to select the desired option. 1. SCRAMBLING: This option enables the random or continuous (triangle wave based) scrambling functions of the PMDPro.
- Page 31 for the second Stokes parameter. Press ENTER. If the first two values set are incompatible with a valid SOP, the screen will display an error message. Otherwise, the cursor will advance to the SIGN position. Use the up and down arrow keys to set the desired sign (+ or −) for the third Stokes parameter and press ENTER.
- Page 32 4. TRACE SCAN: In this function, the PMDPro’s polarization controller traces out a great circle on the Poincaré sphere about the selected axis. The setup screens for SOP trace scanning are as follows: a. START (SOP Scan) b. TRACE Angle: 0°...
- Page 33 45º trace 0º trace 90º trace -45º trace S3 trace Figure 8 The 5 trace scans 0º trace 90º trace 0º axis 90º axis Figure 9 0º and 90º axes and corresponding traces c. SPEED: This option sets the dwell time per step. Use the left and right arrow keys to move between digits and the up and down arrow keys to increment the active digit.
- Page 34 5. WAVE MODE: This option allows the user to independently set periodic waveform control signals for 4 channels of the polarization controller. This gives the user the flexibility to switch back and forth between two SOPs (square wave on one channel), to set up a constant-rate SOP variation (triangle wave on one channel) or to use multiple channels to implement a more complicated variation pattern.
- Page 35 A triangle wave applied to a single channel also sweeps out a ring (or portion thereof, depending on the amplitude) on the Poincaré sphere, but the polarization change along that path occurs at a constant speed determined by the frequency. The final trace over several periods will look the same as that of a sine wave.
- Page 36 If periodic waveforms are simultaneously applied to more than one channel, their effects are superposed, and the polarization state periodically sweeps out a more complicated pattern on the Poincaré sphere. Certain frequency combinations will cover the entire sphere. This can be a basis for polarization scrambling. Figure 18- 21 show some examples.
-
Page 37: Wsop
The operation screen for the SOP waveform function is shown below: CHANNEL: 4 Amp: _ _0.0V F: _ _0.0 Hz W: Sine Use the left and right arrows to move the cursor and the up and down arrows to change settings or values at the current cursor position. CHANNEL: Select polarization controller channel to be controlled. - Page 38 Figure 22 Effect of input polarization alignment on PMD effect caused by a DGD element a) Equal power split between fast and slow axes b) Input polarization aligned to fast axis- pulse is not distorted c) Input polarization aligned to slow axis- pulse is phase delayed but not distorted In the second case, the output polarimeter reading is used to control the polarization controller to tune the input polarization state to minimize the DOP of the signal after it passes through the PMD element.
-
Page 39: Pmdc
If the PMD setting is a lookup table state with index number between 0 and 255 when the equal power split option is selected, the PMDPro will immediately adjust the SOP to balance the power split between the fast and slow axes, and the following operation screen will be displayed: EQU-POW-SPL (DGD) - Page 40 1. DGD OPTIMIZED Comp 2. PMD OPTIMIZED Comp ↓ 3. DGD SELECTED Comp ↑ 4. PMD SELECTED Comp Use the up and down arrow keys to move between menu options and the ENTER key (the center key in the arrow keypad) to select the desired option. 1.
- Page 41 DOP I: 33.9% O: 87.2% 41.95ps 22.4ps2 The bottom line shows the DGD and SOPMD values that provide the best compensation for the system PMD. This PMD value can also be considered a measurement of the PMD in the system. The top line displays the measured DOP at the input (I) and output (O) polarimeters.
-
Page 42: Manual
the current DGD and SOPMD corresponding to the index. Use the arrow keys to select the desired PMD index. The PMD state updates in real time as the index is changed. When the desired PMD state is selected, press the ENTER key to begin polarization optimization at that state. -
Page 43: Store
4.2.8 STORE: This mode allows the user to store either sequences of PMD values to be used for a sequential scan (see PMDE section) or PMD compensation data from any of the PMD compensation function modes. When the STORE button is pressed, the LCD displays the following screen: 1. - Page 44 A: _Cts (Calc) Loc: 00 DGD: 8.21 SO: _ _0.0 This is the calculation screen. To select a DGD/SOPMD pair to be matched and stored, use the left and right arrow keys to move the cursor to the DGD and SOPMD positions, and the up and down arrows to change the values.
-
Page 45: Recall
4.2.9 RECALL: This mode allows the user to recall previously stored sequences of PMD values or PMD compensation data. The screen interfaces are almost identical to those of the STORE function. When the RECALL button is pressed, the LCD displays the following screen: 1. -
Page 46: Remote Control Operation
4.3 Remote Control Operation General Photonics provides a control program for the PMDPro which allows access to several advanced functions as well as the basic functions accessible from the front panel. The following sections describe the system requirements, setup, and control program interface. - Page 47 Specify the destination directories for program files and drivers. The default locations are the ones shown in the screenshot. Click “Next” to proceed. A license agreement page will appear. Accept the license terms and click “Next” to proceed. A summary page lists the files to be installed or changed. Document #: GP-UM-PMD-1000-21 Page 47 of 122...
- Page 48 Click “Next” to begin installation. When all of the files are installed, an “installation complete” screen will be displayed. This completes the installation process. Click “Finish”. The computer will need to be restarted before the program can be used. Document #: GP-UM-PMD-1000-21 Page 48 of 122...
-
Page 49: Connection
Drivers installed: • LabVIEW Run-Time Engine 2012 SP1 - (32-bit) Operating system: Windows 8; Windows 7; Windows Vista; Windows XP (SP3) 32-bit; Windows Server 2008 R2 64-bit; Windows Server 2003 R2 32-bit • NI-VISA Run-Time Engine 5.3 Operating system: Real-Time OS; Windows 7 64-bit; Windows 7 32-bit; Windows Vista 64-bit;... -
Page 50: Gpib Connection
If asked to specify a driver location, select the “USB Driver” folder and make sure that “include subfolders” is checked. 4.3.5 GPIB Connection To ensure proper communication, use a GPIB cable that is fully compatible with the IEEE 488.1 standard. All GPIB/IEEE 488 interface connections must be made before turning on the instruments. - Page 51 DHCP server PMDPro Switch PMDPro Figure 24 Direct connection: PMDPro to PC Figure 25 Connect PMDPro with DHCP server 2. Request IP address: There are two ways to select the IP mode (dynamic or static) and request (dynamic) or query (static) the IP address. Front Panel: As described in section 4.2, the user can set the PMDPro for static or dynamic IP addressing and query the IP address from the front panel SETUP menu.
- Page 52 4. GP_SET_ETHERNET program: To run this program: a) Connect the PMDPro to the control computer with a straight wired RS-232 cable as described in section 4.3.3. This program is RS-232 only, and cannot be run from any other interface. b) Set the control computer’s baud rate to 28800. c) Open the program GP_SET_ETHERNET.Select the correct serial (RS-232) port from the port configuration box at the top of the screen.
- Page 53 IP Config query screen- Dynamic IP mode result The second tab, “MODE SETTING” allows the user to switch the instrument between static and dynamic IP addressing modes. Ethernet mode selection screen- dynamic Document #: GP-UM-PMD-1000-21 Page 53 of 122...
- Page 54 Ethernet mode selection screen- static Clicking the “OK” button for dynamic mode puts the PMDPro into dynamic IP mode. The instrument will obtain the dynamic IP information from the server. When it is finished, the indicator for dynamic mode will turn green, and the Ethernet Mode status box will say “DYNAMIC”.
-
Page 55: Control Program Interface
Static IP setup screen. Notes on configuration: The net mask and gateway should be the same as those for the control computer (see example below). The first 3 groups of numbers in the IP address should be the same as those for the control computer (192.168.2, for example). -
Page 56: Monitor Screen
If the “yes” button is clicked, the user will be prompted to enter an IP address. Enter the instrument’s IP address and click OK. The user can set the PMDPro for static or dynamic IP addressing and query the IP address from the menu options accessible by pressing the SETUP button on the front panel. - Page 57 The program interface consists of a function selection panel on the left side of the screen and the main operation area, which occupies most of the screen. The function selection panel contains 13 buttons corresponding to various operation modes. These buttons are divided into three groups. The top group (“Front Panel Function”) includes most of the basic functions.
-
Page 58: Front Panel Functions
Front Panel Functions: PMDE The PMDE operation screen includes the basic discrete mode PMD generation and scanning functions. SET PMD: This function is used to select a particular DGD/SOPMD state from the lookup table. When the user selects a PMD index number (ID#), the PMD-1000 generates the corresponding DGD/SOPMD pair and displays the DGD and SOPMD values in the corresponding boxes. - Page 59 DGD values to the ones entered. Click “Start” to start the scan. During the scan, the current DGD value (in ps) is displayed in the box at the right of the screen. SCAN PMD: The PMD-1000 scans all DGD/SOPMD pairs in order of their index number (see lookup table for corresponding values).
- Page 60 WSOP: This function combines the PMDPro’s discrete PMD generation function with its automatic polarization control function. The polarization controller is used to tune the input SOP to the PMD generation element to obtain the worst-case DGD or PMD effect for a given DGD and/or SOPMD value. PMD SETTING: First, select the desired DGD/SOPMD pair by setting the index number in the PMD ID# box.
-
Page 61: Sop
SOP: The SOP operation screen includes the PMD-1000’s polarization control and scrambling functions. SCRAMBLING: The PMD-1000 can perform either random scrambling, in which it generates random discontinuous points on the Poincaré sphere, or continuous scrambling, in which it uses an algorithm based on a set of triangle waves to generate a continuous trace on the Poincaré... - Page 62 6-STATE GENERATOR: This function generates and maintains any of the Poincaré sphere pole points (0°. +45°, −45° or 90° linear states or right hand or left hand circular states). Select the desired state from the pull-down menu and click “Set”. TRACE SCAN: This function traces out a great circle on the Poincaré...
-
Page 63: Pmdc
PMDC: This panel controls the PMD-1000’s PMD compensation functions using discrete PMD generation mode. In all of these cases, the PMD-1000 uses its polarization controller and polarimeters to maximize the output DOP, but the DGD or PMD value used for compensation differs depending on the particular function selection. -
Page 64: Monitor
MONITOR: This screen was described at the beginning of the control program description. It can be used to monitor the status of the light signal, including the output optical power, the current output PMD setting and control mode of the PMD generator, and the SOP/DOP values at the input and output polarimeters. -
Page 65: Manual
MANUAL: The PMD-1000 includes a 6-channel piezo-driven fiber-squeezer polarization controller. The manual operation mode allows the user to directly set the control voltages to each channel of the polarization controller, rather than using the polarimeter feedback to control the polarization controller. The voltage range for each channel is 0-150V. -
Page 66: Advanced Functions
Advanced Functions: This function set includes more advanced PMD generation and scan functions that make use of the PMDPro’s quasi-continuous PMD generation capability. It also includes PMD measurement and long-term monitoring functions. ADVANCED PMDE: This operation mode combines the PMD-1000’s continuous PMD generation function with scan/emulation and polarization control functions. - Page 67 There are two methods to combine the PMD generation function with polarization control to ensure that the worst-case PMD effect is found. 1. To enable continuous polarization scrambling, set the desired scrambling frequency, either by selecting a value from the pull-down menu or by typing a value in the box directly under the pull-down menu and then clicking elsewhere on the screen.
- Page 68 prompted to either run the scan with a dwell time of 0.5 s, or to exit the scan and return to parameter setup. Note also that if the selected dwell time is <1 s, the scan will run, but the points will not be plotted on the display.
- Page 69 Selection parameters: Average DGD: average DGD value (in ps) for the distribution. Range: 0-30 ps for 90 ps PMDPro, 0-60 ps for 180 ps PMDPro. Sample #: Total number of samples to be included in the distribution Resolution: Minimum index number spacing between DGD values used in the scan. For example, if the intrinsic DGD resolution of a 90 ps PMD-1000 is 0.357 ps, and the user chooses “step x2”, then the DGD resolution used for the scan is 2 x 0.357 = 0.714 ps.
- Page 70 shows the DGD and SOPMD, sample number, number of completed cycles, and input and output DOP. The generated DGD distribution plot shows all points generated so far. When the emulation is complete, it will match the calculated DGD distribution plot above it.
- Page 71 PMD Emulation- 1 and 2 order: The PMD emulation function generates a Maxwellian distribution of DGD values and a statistical distribution of SOPMD values corresponding to the generated DGD. Selection parameters: Average DGD: average DGD value (in ps) for the distribution Range: 0-30 ps for 90 ps PMDPro, 0-60 ps for 180 ps PMDPro.
- Page 72 The DGD distribution plot shows the calculated distribution of DGD values that corresponds to the selected parameters. This plot can be used to find a combination of average DGD and sample number that will yield a good distribution. The SOPMD distribution plot shows the calculated distribution of SOPMD values that corresponds to the selected parameters.
- Page 73 PMD Scan: This function set uses the quasi-continuous PMD generation mode to generate two types of PMD scans. The PMD trace scan creates a continuous PMD variation at a user- selectable rate of change. The local PMD scans generate a series or grid of PMD values with user-selectable DGD and/or SOPMD boundaries and step sizes.
- Page 74 The “Scan Setting” block on the lower left of the screen is used to configure the operational parameters for the scan. The scan mode pull-down menu allows the user to choose between a continuous or step scan. In a continuous scan, the PMDPro uses the smallest possible DGD step size (0.1 ps) to generate the trace, and the user can select the rate of change of DGD, in ps/s.
- Page 75 The cycle type pull-down menu allows the user to select between a one-way or round-trip scan. Cycle number designates how many times to generate each trace before going on to the next trace on the list. In the example above, the scan is set for continuous, up, bidirectional, and 2 cycles, with the first trace’s limit points set at (0.36 ps, 0.0 ps ) and (129.00 ps, 8319.9 ps...
- Page 76 Select the desired scan function from the pull-down menu, as shown in the picture above. To enable worst-case SOP optimization, click the “WSOP Enable” button at the bottom left of the screen before running a scan. To disable it, select “Disable WSOP”. Please note that this function can only be used with single-polarization signals.
- Page 77 Data is saved as a text file with 3 columns: DGD, SOPMD, and DOP. Scan SOPMD only: This function scans through a user-defined SOPMD range with a fixed DGD value. Selection parameters: Fixed DGD: fixed DGD value, in ps Start SOPMD: SOPMD start value, in ps Stop SOPMD: SOPMD end value, in ps SOPMD step: step size in ps Scan Interval (on top of graph): dwell time per point, in s.
- Page 78 When the scan parameters are set, click “Start” to start the scan. As each point is generated, the DGD, SOPMD, and output DOP are displayed above the graph, and the output DOP vs. SOPMD is plotted in the graph on the left. After the scan is finished, the data can be saved to a file by clicking “SAVE DATA”.
- Page 79 To rotate a 3D graph, drag it with the mouse. To zoom in or out, hover the mouse over it and scroll up or down. After the scan is finished, the data can be saved to a file by clicking “SAVE DATA”. Data is saved as a text file with 3 columns: DGD, SOPMD, and DOP.
-
Page 80: Pmd Measurement And Long-Term Monitoring
PMD Measurement and Long-term Monitoring: The functions contained in these two categories are designed to measure and/or monitor the PMD in a system. PMD Measurement: The functions in this set measure the PMD in the system under test using the PMDPro’s PMD compensation function. - Page 81 Scan DGD only: This function scans through a user-defined DGD range with a fixed SOPMD value. Selection parameters: Start DGD: DGD start value, in ps Stop DGD: DGD end value, in ps DGD step: DGD step size, in ps Fixed SOPMD: fixed SOPMD value, in ps Scan Interval (on top of graph): dwell time per point, in s.
- Page 82 Scan SOPMD only: This function scans through a user-defined SOPMD range with a fixed DGD value. Selection parameters: Fixed DGD: fixed DGD value, in ps Start SOPMD: SOPMD start value, in ps Stop SOPMD: SOPMD end value, in ps SOPMD step: SOPMD step size, in ps Scan Interval (on top of graph): dwell time per point, in s.
- Page 83 Scan DGD and SOPMD: This function performs a 2-D DGD/SOPMD grid scan over a user-defined area. Selection parameters: Start DGD: DGD start value, in ps Stop DGD: DGD end value, in ps DGD step: DGD step size, in ps Start SOPMD: SOPMD start value, in ps Stop SOPMD: SOPMD end value, in ps SOPMD step: SOPMD step size, in ps Scan Interval (on top of graph): dwell time per point, in s.
- Page 84 Scan DGD/SOPMD value in table: This function scans through a set of user defined DGD/SOPMD pairs. Enter the PMD values to be scanned in the table on the left of the screen. Each row designates one DGD/SOPMD pair. The DGD value, in ps, should be entered in the first column and the SOPMD value, in ps , in the second column.
- Page 85 DGD Measurement: This function scans through the DGD-only states in the lookup table (discrete mode) and optimizes the SOP at each state to maximize the output DOP. There are no selection parameters for this scan. Click “Start” to start the scan. While the scan is running, the “Scan on?”...
-
Page 86: Long Term Pmd Monitor
TCA-1000 Figure 26 System setup using TCA-1000 as signal emulator Figure 26 illustrates a system setup for PMD monitoring using General Photonics Tunable Channelized ASE Source (TCA-1000) in conjunction with the PMDPro. The TCA-1000 is used as the input to one frequency channel before multiplexing. After demultiplexing, that frequency channel is sent to the PMDPro, which performs DGD measurements at user-specified intervals. - Page 87 Figure 27 illustrates a system setup for monitoring the PMD of an in-service link. The signal is tapped before the demultiplexer, sent through an EDFA, and then the frequency channel to be tested is separated out with a tunable filter and sent to the PMDPro. The picture above shows the control program interface screen for the long-term monitoring function.
-
Page 88: Setup
After a long enough period of measurement, the histogram will typically follow a Maxwellian distribution. The mean of the distribution can be taken to be the mean PMD of the system under test. The program will continue recording data until the “Stop” button is clicked. Support Functions: This section includes the interface screens for setting operation parameters, storing and recalling programmed PMD scan sequences and PMDC results, and performing... -
Page 89: Store/Recall
Store/Recall: This screen is used to store PMD sequences for scans or PMDC measurement results to memory, or to recall stored data from memory. PMD Memory Bank Store/Recall: The PMD-1000 has 5 memory banks, with 100 locations each, for PMD sequence storage. - Page 90 When all of the PMD states to be stored have been entered in the table, click the “STORE” button to store the PMD sequence to memory. Note that for continuous states, the state stored in memory and used for the scan is the closest-matched set of calculated values to the user-requested DGD/SOPMD values.
- Page 91 Click “OK” to delete the stored data. PMDC Memory Bank Store/Recall: The PMDPro can also perform individual DGD measurements and save the results to memory. Up to 100 results can be stored. Store DGD measurement: To perform a DGD measurement and store the result, select the memory location in which to store the data (“Memory Loc ID#”...
-
Page 92: Pmd Calculation
PMD Calculation For a particular PMD index number in the discrete lookup table, this function displays the calculated wavelength dependence of the DGD and total SOPMD, as well as the depolarization and polarization dependent chromatic dispersion (PDCD) components of the SOPMD. Selection parameters: Bits of PMDPro: Discrete mode resolution (# of bits) of the PMD-1000. -
Page 93: Remote Control Command List
4.3.8 Remote Control Command List The command list allows users to write their own programs for basic control of the PMDPro and facilitates integration with other instruments. The command format is the same for all communication interfaces (RS-232, USB, Ethernet, or GPIB). Once the connection has been established and the instrument has been detected by the control computer, any program that supports the communication protocol being used (RS-232, USB, Ethernet, or GPIB) can be used to send ASCII commands to the... - Page 94 *PME:SET:PMD idn# Discrete mode PMD control: *E00# if successful. See Table 2 for Set DGD/SOPMD to values corresponding to ID# other error code definitions. LCD display will update. Range: 0 to 6560. PMDE MODE ===PMD Scans=== ============================ *PME:SCN DGD min,max# Discrete mode DGD scan: *E00# if successful.
- Page 95 *PME:SCN MOD? Query the scan MODE. *UNI# For UNI-Directional *BID# For BI-Directional See Table 2 for error code definitions. *PME:SCN STE? For step trace scan: *34.6# Query the DGD step size, in picoseconds. *PME:SCN:STE step# For step trace scan: *E00# if successful. See Table 2 for Set the DGD step size, in picoseconds.
- Page 96 MAXWELLIAN MODE ==STATISTICAL DGD EMULATION== ======================== WITH CORRESPONDING SOPMD *PME:EMU ENA# Start PMD-statistical emulation *E00# if successful. See Table 2 for and 2 order) other error code definitions. *PME:EMU DIS# Stop PMD-statistical emulation *E00# if successful. See Table 2 for other error code definitions.
- Page 97 *SOP:SPL STA? Query the special SOP state setting (current or most recently set) *45# *−45# *90# *RHC# *LHC# *SOP:SPL 0# Set SOP to one of 6 special states Special SOP polarization control *SOP:SPL 45# 0° linear *E00# if successful. See Table 2 for *SOP:SPL -45# 45°...
- Page 98 *SOP:CHx MOD? Query Channel x waveform type setting Possible Responses: x: 1 to 4; *SIN# Waveforms: SIN=sine *SQU# SQU=square *TRI# TRI=triangle Default: Sine (all channels). *SOP:CHx:AMP amp# Set Channel x Amplitude to value amp Volts *E00# if successful. See Table 2 for x: 1 to 4 other error code definitions Range for amp: 0 to 150.0...
- Page 99 *CV1? Query the voltage of indicated channel. Example: *123.45# indicates that the *CV2? Range: 0-150.0 Volts control voltage is 123.45V for the *CV3? queried channel. *CV4? *CV5? *CV6? ======================= ========================= PMDC MODE *PMC STA? Query PMDC operational status *END#: PMDC search complete *RUN#: PMDC is still running *PMC:DGD OPT# Scan available DGD values and optimize...
- Page 100 Store the most recent PMDC Search result to Ex: *SAV:PMC 14# *SAV:PMC loc# PMDC memory location loc. Range for loc: 0 to 99 *REC:PMC loc# Recall the stored PMDC Search result from *E00# if successful. PMDC memory location loc and set PMDPro *E12# if location is empty or contains to the recalled setting.
-
Page 101: Section 5. Applications
Section 5. Applications: This section includes brief descriptions of several application examples for a polarization optimized PMD source. 5.1 PMD Tolerance Testing with Polarization Multiplexed Signals For polarization multiplexed signals, the measured DOP at the input and output of the PMDPro are not accurate indicators of the PMD effect on the signal. - Page 102 Maximum SOPMD determined by selected DGD Selected DGD Figure 28 DGD/SOPMD range determinants for continuous control Use the left and right arrow keys to move the cursor and the up and down arrow keys to increment the digits to set the DGD and SOPMD values to be matched. Note that the left and right arrow keys will scroll through all modifiable cursor positions.
- Page 103 DGD: 31.04 E 31.10 SOPMD: _ 530.0 E 530.0 where the “E” indicates that the calculated values have been enabled. From either the calculation or execution screens, the left arrow key can be used to return to the setting mode (the “C” or “E” will change back to the “<” symbol) and change the requested DGD and SOPMD values.
- Page 104 2. Set the PMD ID# in the top block of the interface screen. The corresponding DGD and SOPMD values will be displayed as the index number is updated, and the output PMD updates in real time. 3. Click the SOP button on the left function panel to bring up the polarization control interface screen: 4.
-
Page 105: Pmd Mitigation In 40Gb/S Systems
Quasi-continuous PMD setting: 1. Click the Advanced PMDE button on the left function panel to bring up the advanced-function PMDE interface. 2. Click the “Continuous PMD + Polarization Control” tab. 3. Set the DGD and SOPMD values by dragging the sliders, by entering the desired values in the value selection boxes under the plot axes and then clicking the mouse outside the text boxes, or by dragging the red cursor within the plot area. - Page 106 Power DOP=0 Power DOP=1 Power DOP=1 Figure 29 Illustrations of the PMD effect on an optical signal. A) The SOP of the input signal is aligned 45 degrees from the PSP of the fiber link, causing the worst-case signal distortion. In this case, if the DGD is larger than the width of one bit, then the DOP=0 because the two orthogonal polarization components have the same power, with no phase relationship.
- Page 107 optical signal is converted into an electrical signal. However, because the electrical signal does not contain the phase information of the corresponding optical signal, the resulting PMD effect reduction is limited. Optical PMD compensation is another attractive approach. An optical PMD compensator enerally contains one or more polarization controllers, a PMD generation device, a PMD monitoring device, and a microprocessor based circuit, as shown in Figure 30.
-
Page 108: Instruments Required For Pmd Related Tests
5.3 Instruments required for PMD related tests PMD source for PMD tolerance test No matter which approach is taken, it is desirable to have an instrument capable of testing the performance of different methods in mitigating PMD effects. This test is called a PMD tolerance test. - Page 109 Importance of polarization optimization: The PMD effect on a system is highly polarization dependent. When the input state of polarization (SOP) is aligned or counter- aligned with the principal state of polarization (PSP) of the fiber link or the PMD source, the PMD has no effect on the signal, and therefore no effect on system performance, as shown in Figure 29.
- Page 110 PMD source for PMD compensator evaluation A PMD source is also necessary to evaluate the performance of a PMD compensator, whether optical or electrical, as shown in Figure 32. PMD compensator evaluation can include several types of tests. First, the system improvement margin at different PMD settings can be determined.
-
Page 111: Desirable Features For A Pmd Source
5.4 Desirable features for a PMD source High repeatability and rapid generation of 1 and higher order PMD values are desirable in a PMD source because they enable fast, repeatable PMD tolerance tests and PMD compensator evaluation. Automatic optimization of input SOP is also highly advantageous. As described previously, PMD tolerance tests can be greatly simplified if the input SOP to the PMD elements inside a PMD source can be controlled and optimized such that each PMD value has the most severe possible impact on the quality of the optical signal, regardless of... - Page 112 PMD values, 3) control the PC to optimize the input SOP for various functions. The PMD generator used in the PMDPro is based on General Photonics’ patent pending ternary polarization rotation technology. The generator is constructed using a series of birefrigent crystals, with a ternary polarization rotator sandwiched between each pair of adjacent crystal segments, as shown in Figure 34.
- Page 113 are aligned 45° from each other, producing higher order PMD. This higher order PMD generation capability is not available in previous DGD generator designs in which the polarization rotators can only generate ± 45°. polarization rotations. The 0 degree polarization rotation is essential for the generation of higher order PMD. The total number of PMD values that can be generated with N+1 sections of birefringent material and N rotator pairs is 3 .
-
Page 114: Advantages And Applications Of The Polarization Optimized Pmd Source
5.6 Advantages and applications of the polarization optimized PMD source The polarization optimized PMD source, constructed with digital ternary polarization rotators, offers the following attractive features for PMD related testing: 1) High precision, high repeatability PMD generation, resulting from the highly repeatable rotation angles of each ternary rotator. - Page 115 a PMD compensator is required. An EDFA may be used before the PMD source to boost the signal level. Polarization optimized PMD source Link with PMD DeMUX Figure 36 Polarization optimized PMD source in an in-service WDM link for the determination of its PMD and diagnosis of performance issues.
-
Page 116: Section 6. Troubleshooting
Section 6. Troubleshooting: The following table lists some of the major troubleshooting procedures. Symptom Possible Solution 1. Check the power supply indicator light. The PMDPro does not 2. Check the operation mode. execute the desired 3. Check whether the PMDPro is in a setup or function function. -
Page 117: Section 7. Technical Support
Section 7. Technical Support General Photonics is committed to high quality standards and customer satisfaction. For any questions regarding the quality and use of the PMDPro, or future suggestions, please contact General Photonics Corporation at (909)-590-5473 (telephone) or (909)-902-5536 (fax), or by e-mail at support@generalphotonics.com. General Photonics will respond to all customer questions within 24 hours during regular business hours. -
Page 118: Appendix A: Itu Grid Channel Lookup Table
Appendix A: ITU Grid Channel Lookup Table The following tables are references for the PMDPro operation wavelength setup. They list the frequency and wavelength corresponding to each channel in the C and L bands. C-BAND CHANNEL# FREQUENCY (GHz) WAVELENGTH (nm) 191600 1564.68 191650... - Page 119 193550 1548.91 193600 1548.51 193650 1548.11 193700 1547.72 193750 1547.32 193800 1546.92 193850 1546.52 193900 1546.12 193950 1545.72 194000 1545.32 194050 1544.92 194100 1544.53 194150 1544.13 194200 1543.73 194250 1543.33 194300 1542.94 194350 1542.54 194400 1542.14 194450 1541.75 194500 1541.35 194550 1540.95 194600...
- Page 120 L-BAND CHANNEL # FREQUENCY (GHz) WAVELENGTH (nm) 185100 1619.62 185150 1619.19 185200 1618.75 185250 1618.31 185300 1617.88 185350 1617.44 185400 1617.00 185450 1616.57 185500 1616.13 185550 1615.70 185600 1615.26 185650 1614.83 185700 1614.39 185750 1613.96 185800 1613.52 185850 1613.09 185900 1612.65 185950 1612.22...
- Page 121 187250 1601.03 187300 1600.60 187350 1600.17 187400 1599.75 187450 1599.32 187500 1598.89 187550 1598.47 187600 1598.04 187650 1597.62 187700 1597.19 187750 1596.76 187800 1596.34 187850 1595.91 187900 1595.49 187950 1595.06 188000 1594.64 188050 1594.22 188100 1593.79 188150 1593.37 188200 1592.95 188250 1592.52 188300...
- Page 122 189650 1580.77 189700 1580.35 189750 1579.93 189800 1579.52 189850 1579.10 189900 1578.69 189950 1578.27 190000 1577.86 L100 190050 1577.44 L101 190100 1577.03 L102 190150 1576.61 L103 190200 1576.20 L104 190250 1575.78 L105 190300 1575.37 L106 190350 1574.95 L107 190400 1574.54 L108 190450 1574.13...
Need help?
Do you have a question about the PMDPro PMD-1000 and is the answer not in the manual?
Questions and answers