Table of Contents
Advertisement
Quick Links
User's Manual
for
TM
ATPOL II
For Power Quality Operation
For Motor Testing use the
manual named:
ESA 6 User Manual
ALL-TEST PRO, Inc.
PO Box 1139, Old Saybrook,
CT 06745
Tel: 860-399-4222
Fax: 860-399-3180
info@alltestpro.com
www.alltestpro.com
Rev for FW 5.3f / SW 3.4F
© 2013 by ALL-TEST Pro, LLC All Rights Reserved
ATPOL II is a registered trademark of ALL-TEST Pro, LLC.
1
Advertisement
Table of Contents

Related Manuals for ALL-TEST PRO ATPOL II

Summary of Contents for ALL-TEST PRO ATPOL II
- Page 1 ALL-TEST PRO, Inc. PO Box 1139, Old Saybrook, CT 06745 Tel: 860-399-4222 Fax: 860-399-3180 info@alltestpro.com www.alltestpro.com Rev for FW 5.3f / SW 3.4F © 2013 by ALL-TEST Pro, LLC All Rights Reserved ATPOL II is a registered trademark of ALL-TEST Pro, LLC.
- Page 2 IV, pollution degree II, double insulated electronic device. Model ATPOL II is manufactured for ALL-TEST Pro, LLC in the U.S.A. The standard warranty period is 12 months from date of purchase unless you have purchased an extended warranty. We encourage you to advise us of any defects of design or manufacture of any of our products.
-
Page 3: Table Of Contents
Table of Contents Introducing ATPOL II ..............7 Connecting to ATPOL II .............. 7 Voltage Test Leads ..................7 Current Probes ....................8 Connections to ATPOL II ................9 Introduction to Power Delivery Configurations........11 Connecting to Single-phase Power ............12 Connecting to 120 V Outlet Adapter Box.......... - Page 4 Frequency Measurements in PSM ............48 Duty Cycle / Power Cycle Measurements ..........48 Duty Cycle / Power Cycle Measurements in ATPOL II ......49 Time and Capacity Measurements ............49 Time and Capacity Measurements in ATPOL II ........50 Time and Capacity Measurements in PSM ..........
- Page 5 Setting Measurement Types ..............72 Setting Measurement Modes ..............74 Saving and Retrieving Data Setups to File or ATPOL II in PSM ..74 Loading Data Setups from the Memory Card (SD Card) ...... 74 Saving Data Setups to the Memory Card (SD Card) ......74 Restoring the Default Setup ..............
- Page 6 Remote Control of ATPOL II..............93 Locating and Installing Software and Firmware........93 Setting up Administrative Features of ATPOL II via PSM ..... 94 Setting Operational Features of PSM ............94 Putting it all Together (Monitoring for the First Time) .... 94 Working with Graphs and Waveforms........
-
Page 7: Introducing Atpol Ii
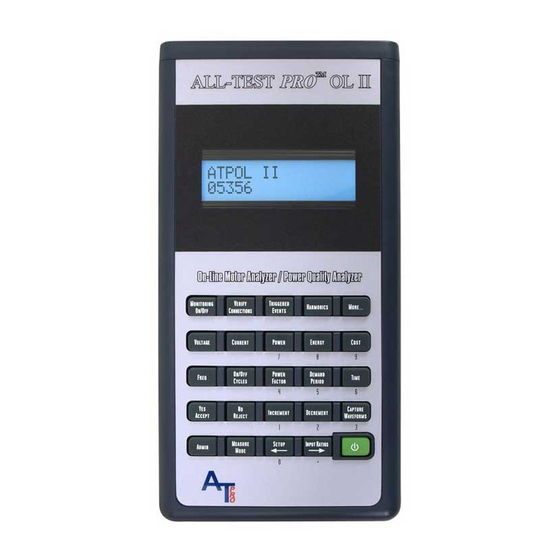
Introducing ATPOL II Congratulations on your decision to buy an ATPOL II. You have just purchased one of the smallest and yet most powerful instruments for measuring and analyzing electric power that exists. The ATPOL II is a complete solution for the measurement and analysis of all aspects of power: ... -
Page 8: Current Probes
The AT6002 probe is the same compact size as the AT6003. The AT6002 measures from 0.1 to 100 amps at 2% accuracy. It is a good choice over the AT6001 if you wish to lock ATPOL II, its leads, and... -
Page 9: Connections To Atpol Ii
Any dirt or rust will affect the accuracy of the measurements! Connections to ATPOL II Voltage test leads plug into the top end of ATPOL II. Each test lead of the Deluxe Voltage Test Lead set is labeled (V , or V... - Page 10 , or I ). When plugging a current probe into ATPOL II, the flat side of the plug should be facing upwards so the label is readable. This will align it properly for plugging into the ATPOL II case. Clamp-on probes have a correct orientation in which to attach them. On most probes' head, there will be an arrow pointing in the direction of the conductor being measured.
-
Page 11: Introduction To Power Delivery Configurations
10. Although phase-to- phase is the normal voltage measurement mode for this service, ATPOL II can be set to phase-to- neutral (even though the neutral is not connected). In this case, the measured voltages will be phase- to-metering-neutral (such as V = 277V for a 480V service) and all other measurements will also be correct. -
Page 12: Connecting To Single-Phase Power
Normal single-phase wiring follows the convention of "neutral" is the white wire, "hot" is the black wire, "hot2" is the red wire, and "ground" is the green wire. If the wiring and your connections to ATPOL II are as shown in figure 2, V... -
Page 13: Connecting To Multiple Single-Phase Loads
Figure 4 presents a means to monitor 3 single-phase loads simultaneously. The loads must all share the same neutral voltage connection. If the loads run off the same line voltage, connect V ATPOL II and V to the same "hot" wire. I , and I serve the 3 loads. -
Page 14: Connecting To Three-Phase Three-Wire (Delta) Power
It also provides 208V. Depending on what you intend to monitor, it may be appropriate to set ATPOL II in phase-phase voltage measurement mode (to monitor three-phase loads or to look at total power) or in phase-neutral voltage measurement mode (to monitor single phase loads). -
Page 15: Connections Using 2 Current Approach
Connections To a 3 CT / 3 PT Metering Circuit Sometimes it is helpful to monitor a load indirectly, by connecting ATPOL II to a metering circuit in front of the load. A few circumstances where this is the case: ... -
Page 16: Connections To A 2 Ct / 2 Pt Metering Circuit
The ratio of the stepping down of the voltage will be printed on the rating plate of the PT. Typically this would be 2400:120 (20:1). As with the CTs, this ratio should be entered into ATPOL II (see the Setting Input Ratios section) to simplify interpreting the results. -
Page 17: Connecting To Line-To-Dc (Ldc) Converter Accessory
ATPOL II are plugged into the loose ends of the in- line fuses. At this point, ATPOL II is ready to measure voltages as usual and the LDC is connected in parallel to two of the inputs of ATPOL II. You may wish to remove the in-line fuse assemblies, plug your voltage leads directly into the stackable plugs, and plug the in-line fuse assemblies between the loose ends of the voltage leads and the voltage clips. -
Page 18: Measuring Multiple Parallel Conductors
Measuring Multiple Parallel Conductors A common problem with measuring large currents arises when the current of each phase is carried by several parallel conductors. For instance the phase 1 current may be carried in 4 parallel conductors, as are phases 2 and 3, resulting in 12 conductors to measure. -
Page 19: Measuring Currents Below The Range Of The Current Probe
If you use this method, set the input ratio for the current probe to 1 : 2 (see the Changing Input Ratios in ATPOL II section). If the current to be measured is small, it may be acceptable to open the circuit and insert an extra length of wire that is wound up into a coil of 10 turns. -
Page 20: Turning Atpol Ii On
Turning ATPOL II Off To turn ATPOL II off, simply press the green on/off button at the lower right of the keypad on the front panel. This provides a graceful software/firmware shutdown. If pressing the button briefly does not turn the meter off, press the on/off button down and hold it down for 3 seconds to force a hardware shutdown. -
Page 21: Communicating With Atpol Ii
Step 1: Connecting to the Meter at the Operating System Level The ATPOL II meter and your PC must be turned on before the first step can occur. As soon as your meter is on, the Bluetooth adapter in the meter is energized and can respond to broadcasts from your PC’s Bluetooth adapter. -
Page 22: Step 2: Connecting To The Meter In Psm (The Application Level)
PSM software. Note: Whenever you close PSM or turn your ATPOL II meter off, you will break the connection between your meter and Windows. Once your meter is turned on, you will need to double click on one of the Bluetooth icons on your desktop to re-connect with Windows and then attempt to re-connect to the meter via PSM. -
Page 23: Using Removable Memory Cards
Using Removable Memory Cards Introduction Your meter has adequate internal memory storage for most normal operating situations. However, the ability to use a removable memory card has several significant advantages: extra storage for very long monitoring sessions faster transfer of data from meter to computer ... -
Page 24: Using The Memory Card Data With Psm
Using the Memory Card Data with PSM After you have installed the memory card into a memory card reader in or attached to your computer, click on the “Receive via Memory Card” button of the main menu of PSM (or click “Data”, then “Receive Data via Memory Card”). -
Page 25: Verifying Connections Using Atpol Ii (Surestart )
There are two primary methods for doing this. You may either send waveforms from ATPOL II to your PC and visually check that all connections are correct and all signal levels and shapes appear correct (see the... -
Page 26: Identifying The Power System
After the SureStart feature is done analyzing the inputs, the type of power system that is present is displayed on ATPOL II. Check that you agree that ATPOL II has identified the system correctly. If it hasn’t, there is probably a problem with the system or the connections. The general types of systems that are identified on the top line of the display are: ... -
Page 27: Identifying Errors
ATPOL II and to the power system. No current. The probe that is identified is connected to ATPOL II, but no current is detected. This may indicate that the load is turned off or that the probe is not connected around the cable properly or that it is not fully seated into its jack within ATPOL II. - Page 28 Wrong frequency setting. ATPOL II is expecting one frequency, but it is measuring another. The display of this error tells the frequency mode that ATPOL II is set for and then displays the actual frequency that is measured. Use PSM to set the frequency mode to the correct setting.
-
Page 29: Checking Out Connections Using Psm
Checking out Connections using PSM The Power System Manager (PSM) software is included in the cost of your ATPOL II meter. You can use it to visually determine if the system connections and levels are correct. Use ATPOL II’s patented SureStart feature for a fast reliable approach to checking that connections and settings are correct. -
Page 30: Check Voltage Phase Sequence - Using Psm
Check Voltage Phase Sequence – Using PSM While still viewing all voltage waveforms of a three-phase system, notice in what order they reach their peak value. Normally, the order should be 1-2-3. In other words the highest level of the V (or V waveform will be followed next by the highest level of the V (or V... -
Page 31: Checking Phase Lag Angle - Using Psm
peaks. This sequence must be in the same order as was seen for the voltages. If they are not, swap two of the probes. This will correct the phase sequence. Verify once again that the spacing between them is still correct. If not, repeat the instructions of this section. Checking Phase Lag Angle –... -
Page 32: Measurement Types
In the ATPOL II, the present voltage is the summary of the RMS voltage over one second. It is the average of the RMS voltages of every cycle during the most recent second. -
Page 33: Voltage Measurements In Atpol Ii
A voltage swell (or surge) is an RMS voltage that exceeds some trigger level. A voltage dip (or sag) is an RMS voltage that falls below some trigger level. In the ATPOL II, the trigger levels can be set to an actual voltage level or as a percent deviation from a normal voltage. -
Page 34: Voltage Measurements In Psm
The measurements of voltage presented on ATPOL II can also be displayed in PSM by using the remote control feature. In addition our Report Generator software will present maximum, minimum, and average voltage of each phase during any one or two intervals of time set by the user. -
Page 35: Current Measurements
A current inrush (or swell or surge) is an RMS current that exceeds some trigger level. A current dip (or sag) is an RMS current that falls below some trigger level. In the ATPOL II, the trigger levels can be set to an actual current level or as a percent deviation from a normal current. -
Page 36: Current Measurements In Atpol Ii
In the ATPOL II, trigger levels can be set for both relative and absolute current transient levels. Current Measurements in ATPOL II ATPOL II performs all commonly desired measurements of current. The RMS (root mean square) currents of phases 1, 2, and 3 and of the neutral line are available by simply pressing [Current] repeatedly. -
Page 37: Imbalance Measurements
If in phase-phase voltage measurement mode, the average RMS current of each phase for each second will be displayed and recorded each second. The measurements of current presented on ATPOL II can also be displayed in PSM by using the remote control feature. -
Page 38: Imbalance Measurements In Psm
There are two methods of measuring imbalance. NEMA (National Electronic Manufacturers Association) uses an approach that measures the deviation of each measurement from the average. For instance, here is the formula for V imbalance: average ... -
Page 39: Power Measurements In Atpol Ii
Demand Period Measurements section. Power Measurements in ATPOL II ATPOL II performs all commonly desired power measurements. Total true power (watts or KW), total reactive power (VAR or KVAR), and total apparent power (VA or KVA) measurements are available by simply pressing [Power] repeatedly. -
Page 40: Power Factor Measurements
( DPF = cos(θ) ), where θ is the phase lag of current. To do this measurement properly, ATPOL II uses Fast Fourier Transform (FFT) analysis to separate the harmonic currents and voltages from the fundamental current and voltage and to do a precise measurement of the angle between those fundamentals. -
Page 41: True Power Factor Measurements In Atpol Ii
(DPF) ). True Power Factor Measurements in ATPOL II The ATPOL II performs all commonly desired true power factor measurements. To view true power factor, press [Power Factor]. If the display says “True P.F.”, then pressing [Power Factor] repeatedly will allow you to view the true power factors of phases 1, 2, and 3 and the total power factor of the three phases. -
Page 42: Displacement P.f. And Phase Measurements In Atpol Ii
Displacement P.F. and Phase Measurements in ATPOL II ATPOL II performs all commonly desired displacement power factor measurements. The displacement power factors of phases 1, 2, and 3 can be displayed. To view displacement power factor, press [Power Factor]. If the display says “Displacement P.F.”, then pressing [Power Factor] repeatedly will allow you to view the displacement power factors of phases 1, 2, and 3. -
Page 43: Power Factor And Phase Measurements In Psm
If a harmonic analysis is displayed, the true power factor is also listed. If trending data is being recorded and ATPOL II is operating in phase-phase voltage measurement mode, the average total true power factor for each second will be displayed and recorded each second. -
Page 44: Energy Measurements In Atpol Ii
5 KWH. The ATPOL II calculates KWH for each second, using every cycle during that time for exact measurements. The reactive energy consumed is determined the same as KWH except VAR measurements are used, instead of watts. The estimated energy consumed per hour is the total energy consumed, divided by the hours of monitoring. -
Page 45: Cost Measurements
$0.10/KWH, then the cost during the monitoring session is $0.50. The ATPOL II calculates cost each second, using every cycle for exact measurements. The estimated cost per hour is the elapsed cost, divided by the hours of monitoring. For instance, if the ... -
Page 46: Cost Measurements In Psm
In this way, by combining the [Cost] and [More...] keys, there are 4 cost measurements available. The rate used by ATPOL II to estimate cost can be displayed or changed by the user at any time. It is one of the setup functions that can be accessed through the [Setup] key. -
Page 47: Demand Period Measurements In Psm
[More...] (to display maximum frequency), and then [More...] (to display minimum frequency). ATPOL II scans its inputs each second to look for an active power signal to measure. If none is detected, all voltage and current measurements are assumed to be zero for that second. This scanning... -
Page 48: Frequency Measurements In Psm
When viewing consumption waveforms, if a harmonic analysis is presented, the fundamental frequency is presented. The measurements of frequency presented on the ATPOL II can also be displayed in PSM by using the remote control feature. In addition, our Report Generator software will present maximum, minimum, and average frequency during any one or two intervals of time set by the user. -
Page 49: Duty Cycle / Power Cycle Measurements In Atpol Ii
The present time and date is the time and date of the clock inside ATPOL II used for creating timestamps for the records of the log and for dating waveform sets that are saved. It can be changed... -
Page 50: Time And Capacity Measurements In Atpol Ii
ATPOL II may be different from those in the log, since the monitoring session is for a longer period of time than the logging session. The time remaining to fill the consumption log is how much longer the logging session can continue before the log is filled and logging either stops or begins writing over the oldest data. -
Page 51: Time And Capacity Measurements In Psm
The number of records used in any of the log types can be determined by attempting to receive the log data from an attached ATPOL II. The measurements of time and capacity presented on the ATPOL II can also be displayed in PSM by using the remote control feature. -
Page 52: Harmonic Measurements In Atpol Ii
0.75 1.69 1.18 0.58 4.20 Harmonic Measurements in ATPOL II ATPOL II performs all commonly desired measurements of harmonic distortion. The total harmonic distortion (THD) of any voltage or current can be calculated and displayed upon demand by simply pressing [Harmon] and then [Yes/Accept] or [No/Reject] in response to the displayed questions. The sequence of the questions is "calculate THD of I... -
Page 53: Harmonic Measurements In Psm
For this reason, swells and inrush are measured in RMS. For highest accuracy, ATPOL II calculates the RMS of each ½ cycle of each voltage and current input in order to detect even the smallest swells and inrush. In this way, no swells or inrushes are missed. -
Page 54: High-Speed Transient Measurements
For this reason, dips are measured in RMS. For highest accuracy, ATPOL II calculates the RMS of each ½ cycle of each voltage and current input in order to detect even the smallest dips. In this way, no dips are missed. -
Page 55: Measurement Modes
Often, you make measurements on one general type of system. There is no need to complicate your task by ATPOL II asking you to make the same choices over and over. Many of the basic choices define how you wish ATPOL II to interpret its inputs and how you want it to calculate and record its results. -
Page 56: Changing The Voltage Measurement Mode In Atpol Ii
This is not due to any accuracy problem with ATPOL II. Instead, it is the result of each phase's current being the result of two different phase-phase voltages, whereas a phase’s power and power factor calculations rely on only one of the phase-phase voltages. -
Page 57: 50/60/400Hz Vs Dc Vs Variable Frequency
22 to 200 Hz or from 360 to 440 Hz. If even one voltage or current input is in this frequency range, ATPOL II can also measure the true RMS of DC and rectified signals that are also connected while in this measurement mode. -
Page 58: Changing The Frequency Measurement Mode In Atpol Ii
When ATPOL II is shipped from the factory, it is set for Always Positive Power measurement mode. In a typical setup, if you connect a current probe backwards, the power for that phase will appear to be negative. -
Page 59: Changing The Power Measurement Mode In Atpol Ii
By clamping onto the secondary of such a CT (typically with an AT6003 probe) or attaching directly to the PT with voltage probes, you obtain readings proportional to the primary side of the CT or PT. Entering the ratios of the CT and/or the PT into ATPOL II allows all... -
Page 60: Changing Input Ratios In Atpol Ii
CT with an output ratio of 600 | 5, this could be entered as “120” and then “1” or as “600” and then “5”. The ratio is the same in both cases. Following this, ATPOL II will ask if the input ratio applies to a specific signal, such as I . - Page 61 Click on “OK” when done. Note: Once it is entered, an input ratio is kept for the specified inputs until you change the ratio again. The default ratios for ATPOL II are set to 1 : 1.
-
Page 62: Voltage & Current Waveforms
7 msec to give sufficient resolution to these much faster frequencies. You can capture a waveform set at anytime, either using the keypad of ATPOL II or PSM if ATPOL II is connected. To save a waveform set in ATPOL II without using PSM, press the “Wave” key at the lower right of the keypad. -
Page 63: Receiving Stored Consumption Waveforms
A waveset captured this way is immediately stored in the PC and shown on the screen. It does not affect waveform sets stored on the ATPOL II meter that is attached. It is a convenient way of viewing the signals that are attached, repeatedly. -
Page 64: Viewing Consumption Waveforms
Viewing Consumption Waveforms To select a waveform set to view, at the main menu, click on “View Consumption Data”, or click on “View” and then “View Consumption Data”, or click on “File” and then “View Consumption Data”. Any of these approaches will result in the View Consumption Data screen being shown. In the “Types to View” section, click on “Stored Waveforms”, if necessary, to select that choice. - Page 65 You can easily transform any waveform into either a graph of harmonic data or a view the raw data for each harmonic and K factor. To convert a waveform (“time domain” representation) into a harmonic graph (“frequency domain” representation), click on the Harmonic Graph icon or click on “View”...
- Page 66 Another convenient analysis feature is the signal selection icons. Clicking on these icons allow you to simply cycle through the individual voltages, currents, or phases. The order of presentation as you click on the icon is phase 1, phase 2, phase 3, and then phases 1, 2, &...
-
Page 67: Monitoring Power Consumption
After you direct ATPOL II to stop monitoring, all the information remains available to you in the data log that is in ATPOL II. The contents of the data log are not displayed on ATPOL II's display. To obtain the information, it must be uploaded from ATPOL II to your computer using the PSM software. -
Page 68: Basic Consumption Data Logging
DC input jack. Basic Consumption Data Logging The basic ATPOL II unit logs aspects of energy consumption as described in the previous section. There are many different modes of operation and data logging options available to ensure that you can measure and record just about anything you need to. -
Page 69: Receiving Consumption Data Log From Atpol Ii
Receiving Consumption Data Log from ATPOL II To receive a consumption data log from ATPOL II, the ATPOL II unit must be connected to a computer running PSM. At the main menu of PSM, the green “Unit Connected” Status box must be displayed. -
Page 70: Viewing Consumption Logs
When the desired file has a checkmark to its left, click on the “Receive and View” button to transfer the data log from ATPOL II to PSM and immediately start looking at the data. Or click on the “Receive Only” button to simply receive the data log. -
Page 71: Custom Consumption Data Logging
“Start at time”, a box will open in which you can set the time and date at which to start logging. Once the custom setup is sent to ATPOL II, that date and time will be stored in the unit, until a new date and time are written over it. This is a great way to synchronize several ATPOL IIs to start logging at the same time, so there data logs can be synchronized. -
Page 72: Setting The Consumption Logging Period
“Stop when full” instructs ATPOL II to stop logging when the log fills up. This is helpful if you don’t want to lose the data from the beginning of the data logging session and may not be back to get the data before the log fills up. - Page 73 When done modifying the measurement types, be sure to click “OK” and then save the new setup to file and/or send it to the connected ATPOL II.
-
Page 74: Setting Measurement Modes
ATPOL II, click on “From ATPOL II”. When the Data Setup menu is first entered, the setup that is shown is the setup from the connected ATPOL II. If no ATPOL II is connected, the initial setup is the “Default” setup. The default setup can always be recovered by clicking on “Defaults”. -
Page 75: Restoring The Default Setup
Restoring the Default Setup The default setup can be restored to ATPOL II at any time. The easiest method is to press the [Setup] key several times until the message “Restore Default Setup?” is displayed on the meter. Press the [Yes] key. -
Page 76: Swell/Dip Event Log
Each of these recordings will be discussed at length in next few sections. The fact that the ATPOL II evaluates the RMS value of every ½ cycle of every input means that no swells or dips are ever missed and the most precise measurement of their duration is available. -
Page 77: Swell/Dip Rms Graph Log
The swell/dip event log can be displayed by PSM in three ways: text record, one line per event placement of magnitude vs. calendar timeframe placement of duration vs. calendar timeframe. The text record allows for quickly spotting certain trends, such as the problem always being with the same signal or the problem is always a dip event. -
Page 78: Swell/Dip Event Waveforms
Whatever is seen can be zoomed-in on and can be printed. Setting the Swell/Dip Trigger Thresholds in ATPOL II Press [Setup] key twice. The display will be “Check Trigger Levels?” Press [Yes/Accept]. The present setting for voltage swell will be displayed. If you wish to change it, press [No/Reject]. The display will be “Would you like a suggestion?”... -
Page 79: Setting The Swell/Dip Trigger Thresholds In Psm
This is because the neutral current is typically much smaller than the other phase currents and needs to have different trigger thresholds. When all the trigger levels are set correctly, you may save the data setup to a file or to a connected ATPOL II. -
Page 80: Receiving Swell/Dip Data From Atpol Ii
When the desired files have checkmarks to their left, click on the “Receive and View” button to transfer the data from ATPOL II to PSM and immediately start looking at the data. Or click on the “Receive Only” button to simply receive the data. -
Page 81: Monitoring High-Speed Transient Events
After you direct ATPOL II to stop monitoring, all the information remains available to you in the transient event log and the transient waveform captures that are in ATPOL II. The data is preserved even if the unit is turned on and off repeatedly. The contents of the data log are not displayed on ATPOL II's display. -
Page 82: Transient Event Log
Please Note: Before you start monitoring, verify that ATPOL II's wall-charger is charging the internal batteries. The internal batteries won't operate ATPOL II for extended hours without assistance. Verify that the red charging indicator light is shining through its hole near the DC input jack. -
Page 83: Setting The Transient Trigger Thresholds In Atpol Ii
Setting the Transient Trigger Thresholds in ATPOL II Press [Setup] key twice. The display will be “Check Trigger Levels?” Press [Yes/Accept]. The present setting for voltage swell will be displayed. Press [Yes/Accept] twice to advance to the absolute transient voltage trigger setting. If you wish to change it, press [No/Reject]. The display will be “Would you like a suggestion?”... -
Page 84: Receiving Transient Data From Atpol Ii
ATPOL II. Receiving Transient Data from ATPOL II To receive transient data from ATPOL II, the ATPOL II unit must be connected to a computer running PSM. At the main menu of PSM, the green “Unit Connected” Status box must be displayed. Click on the “Receive Data”... -
Page 85: Viewing Transient Event Data
When the desired files have checkmarks to their left, click on the “Receive and View” button to transfer the data from ATPOL II to PSM and immediately start looking at the data. Or click on the “Receive Only” button to simply receive the data. -
Page 86: Allocating Memory Within Atpol Ii
Note that it is usually good practice to allow for at least 1 consumption waveset. This is because ATPOL II will automatically record all signals into waveset1 when monitoring begins. It is often helpful to have a record of what the waveforms of all the signals were when monitoring began. -
Page 87: Report Generator Software
Report Generator Software Introduction PSM comes with a Report Generator Software program. The Report Generator software provides concise reports to summarize and document findings. Comparison reports are excellent for presenting before/after comparisons of power usage and projected cost. Separate logs can be compared or sections of the same log can be compared for this analysis. -
Page 88: Viewing A Report
The next screen is the “Log Details” screen. Each measurement type that can be included in the report has its own checkbox. They are organized in a matrix that allows ease of locating a specific signal and ease in enabling or disabling entire columns or phases of them. - Page 89 with the “before” and “After” columns. For instance, the “Units” for voltage measurement types is “volts”. The next column is the “Change” in the value of the “After” column from the data in the “Before” column. The values of this column use the same units as the “Before” and “After” columns (such as “volts”). At the far right is the “%Change”...
-
Page 90: Other Functions Of Atpol Ii
Monitoring High-speed Transient Events. To review the log interval of the ATPOL II, press [Setup] four times. The present setting will be displayed. To change this setting, press [No/Reject] and then follow the instructions to enter the new log interval. -
Page 91: Administrative Functions
ATPOL II allows you to set the utility rate used in calculating the cost of energy consumed. Presently, one simple rate is used. That rate can be displayed on the ATPOL II by pressing [Setup] five times. To change this rate, press [No/Reject] and follow the instructions to enter the new rate. When the new interval is entered correctly, press [Yes/Accept]. - Page 92 Measurement Modes section. To avoid the confusion that results from operating in the 2 current mode by accident, it is normally disabled in all new ATPOL II units. The user is required to enable the feature as an administrative function before the opportunity to operate in...
-
Page 93: Other Functions Within Psm
In addition to the many power analysis functions of PSM that have been presented in previous chapters, there are several other functions available. These are functions of convenience, functions for setting up attached ATPOL II meters, and functions for setting up the PSM program. They include: ... -
Page 94: Setting Up Administrative Features Of Atpol Ii Via Psm
ATPOL II. A very important feature is the ability to synchronize the time of the connected ATPOL II to the time of the PC. This is nice for quickly and accurately setting the time, but it is also very important for synchronizing multiple ATPOL II units in order to correlate logs and events from several units located at different points at a site. - Page 95 ATPOL II and perhaps save it to a file. For instance, check to see how many records and waveforms can be recorded, given the choice of variables and allocation of memory, and check the length of time that logging can proceed before the log will fill up.
- Page 96 Checking out Connections using section. 5. If you intend to have ATPOL II start monitoring by direct command via the keypad or via PSM, this is the time to do it. Otherwise, it will start when the programmed start time occurs.
-
Page 97: Working With Graphs And Waveforms
Working with Graphs and Waveforms General It is important to us to allow you to work with and manipulate the various graphs and waveform presentations in PSM. We try to make the features that accomplish this look and feel the same throughout the program so you can handle all waveforms and graphs in the same way as much as possible. -
Page 98: Reading Graphs And Waveforms
Normally, the color of the signals is set automatically by PSM to give good color contrast on a color monitor. However, that contrast may not stand out on your monitor or on your color printer or especially with your black and white printer. You can control the colors used to display signals by clicking on “View”... -
Page 99: Zooming And Panning
6) All graphs and waveforms have data that is displayed. The heading tells which signal or measurement is associated with which data. The color of the heading is the same as the color of the data presentation. 7) Summary data is displayed on all graphs and waveforms. a) For a consumption log, the summary data for a specific heading depends on the measurement. - Page 100 magnifier with a “+” on it), or to click on “View” and then “Zoom In”, or to type “+” on the keyboard and then do the same click, hold, and drag operation that was previously described. To zoom out, you can click on the ZoomOut icon (the magnifier with a “-“...
-
Page 101: Troubleshooting & Frequently Asked Questions (Faq)
This is most likely caused by a dead battery. Plug in a power supply and see that the red LED at the end of the meter is turned on. Make sure you use the correct rated power supply for the ATPOL II that you are using. - Page 102 8. What is a Logging Interval? The logging interval is the amount of time that passes between ATPOL II making entries into its internal data log. The logging interval determines the rate at which new records are added to the meter's log.
-
Page 103: Advanced Motor Diagnostics Option
ATPOL II connected and then open the Data Setup screen. In the Monitoring Activities section, put a checkmark next to the Motor Data line and then save the setup to ATPOL II. If the Motor Data line does not appear at the bottom of the list of Monitoring Activities, then the option is either not enabled or the meter is not successfully connected to PSM. - Page 104 Intentially Blank. the motor data file or assigning it yourself, using the [Inc], [Dec], [<], and [>] keys. When you accept the name, it will automatically record the motor data. This will take about a minute. To receive the motor data, click on the Receive Data button on the main menu of PSM, click on the line that shows motor data records listed, and then receive the data.
-
Page 105: Frequency Analysis Option
Prior to measuring high frequency voltage, plug the Voltage Conditioning box into the I current input of ATPOL II, plug two voltage leads into the Voltage Conditioning box inputs (typically the phase 1 and phase 2 voltages), remove any connections to V , and the DC input jack of ATPOL II. - Page 106 Harmonics – for measuring THD and individual harmonics (combine it with the More button for more information) More - for getting more detailed information (such as max/min/avg or estimates of per hour/month/year) after pressing one of the other keys Volt – read phase-phase or phase-neutral true RMS voltage (combine it with the More button for more information) Current –...
-
Page 107: Specifications
Specifications* Size 1.58” (4.01cm) Deep in Hand-held region, 2.14” 3.88” (9.86cm) Wide 7.72” (19.61cm) Long (5.44cm) deep at the top end Weight 1.1 pound (0.5 kg) Operating Range 0 - 50 degrees C (32 - 122 degrees F) Relative humidity to 70% (non-condensing) Meets mechanical shock requirements of MIL-PRF 28800F for a class 1 (harshest) environment... - Page 108 With PSM software, display of harmonics through 65 Accuracy: To within 1% of fundamental Measure Rate: Measure every cycle of every input. Swell/Dip Detection: Measure Rate: Measured every ½ cycle of every input. High-speed Transient Detection: Measure Rate: Measured every 8 µsec on every input. Captured Waveforms Quantity: set by user allocation of memory...
Need help?
Do you have a question about the ATPOL II and is the answer not in the manual?
Questions and answers