
Summary of Contents for Northrop Grumman Sperry Marine VisionMaster FT
- Page 1 Radar/Chart Radar User Guide © Northrop Grumman Sperry Marine B.V. Part Number: 65900010...
- Page 3 © 2015 Northrop Grumman Sperry Marine B.V. This publication and the information contained herein is and remains the intellectual property of Northrop Grumman Sperry Marine B.V. Northrop Grumman Sperry Marine B.V. provide a limited licence for the user to reproduce this material for their own internal purpose and use, but not for distribution to third parties.
- Page 4 Radar/Chart Radar User Guide Intentionally Blank 65900010...
- Page 5 WARNINGS AND CAUTIONS The features, functionality and capability which are described in this manual are not necessarily present in all versions or configurations of the VisionMaster FT system. WARNING: Lethal Voltage Hazard WHEN ACCESS COVERS ARE REMOVED, LETHAL VOLTAGES MAY BE EXPOSED.
- Page 6 Warnings and Cautions Radar/Chart Radar User Guide Hazard Zones Antenna Length 100 W/m 50 W/m 10 W/m 1.2 m X-Band 1.7 m 8.5 m 17 m 1.8 m X-Band 1.05 m 5.25 m 10.5 m 2.4 m X Band 0.75 m 3.75 m 7.5 m 2.7 m S-Band...
-
Page 7: Preface
User Guide may be applicable to your system. This manual is intended to be used by the VisionMaster FT operator and is divided into the following chapters and appendices: Chapter 1... - Page 8 Preface Radar/Chart Radar User Guide NOTICE Northrop Grumman Sperry Marine B.V. have a policy of continuous development. This may lead to the equipment described in this manual being at variance with equipment manufactured after its publication. 65900010...
-
Page 9: Table Of Contents
Radar/Chart Radar User Guide Table of Contents Table of Contents PREFACE ....................v Chapter 1 Overview Hardware Configurations ................1-1 Interswitched System................. 1-4 Multi-Node System ..................1-6 Dual Radar – Single System ..............1-7 Dual Radar – Interswitched System ............1-8 ... - Page 10 Table Of Contents Radar/Chart Radar User Guide Screen Layout for Widescreen Display ........... 2-11 Using the Cursor ..................2-12 Cursor Graphics .................. 2-12 Online Help ....................2-14 Accessing Context Sensitive Help ............2-14 Accessing the Help Guide ..............2-14 ...
- Page 11 Radar/Chart Radar User Guide Table Of Contents Off Centring Own Ship ................ 3-17 Panning ....................3-18 Goto ....................3-19 Centre & Maximum View Options ............3-21 Centring the Video Display ..............3-21 Positioning the picture for Maximum View ......... 3-21 ...
- Page 12 Table Of Contents Radar/Chart Radar User Guide Trial CPA and TCPA ................3-43 Watch Mode ..................... 3-44 Total Watch Features ................. 3-45 Safety Checking ..................3-46 Multi-node Support ................3-48 Alternate Bow ................... 3-49 Russian River Register Selection ............
- Page 13 Radar/Chart Radar User Guide Table Of Contents True Motion ..................5-7 Vector Modes ..................... 5-9 Selecting the Vector Mode ..............5-9 Vector Time ..................5-11 Trails Mode ....................5-12 Trail Length Time ................5-13 Chapter 6 Navigation Tools ...
- Page 14 Table Of Contents Radar/Chart Radar User Guide Line of Position ..................6-37 Creating LOPs ..................6-37 LOP Fixes ................... 6-39 Editing LOPs ..................6-41 Using a LOP Position Sensor ............. 6-42 Ownship History ..................6-43 ...
- Page 15 Radar/Chart Radar User Guide Table Of Contents Prompts ....................7-10 Permanent prompts ................7-10 Temporary Prompts ................7-10 Prompts Window ................7-10 Mute Settings ................... 7-11 Central Alert Management ............... 7-12 Picture Freeze ..................7-13 ...
- Page 16 Table Of Contents Radar/Chart Radar User Guide Monitoring a Temporary Route ............8-49 Transitioning a Temporary Route to a Monitored Route ....8-50 Search and Rescue ................. 8-51 Creating SAR Patterns ............... 8-52 External Routes ..................8-55 ...
- Page 17 Radar/Chart Radar User Guide Table Of Contents Lost Target ..................10-12 CPA/TCPA and BCR/BCT Infringement Conditions ......10-12 Target Monitoring Symbols .............. 10-13 Multi-Node Support ................10-14 Echo Reference Target ................. 10-15 Selected Target Functions ..............10-18 ...
- Page 18 Table Of Contents Radar/Chart Radar User Guide Acquisition Zones................... 10-43 Annular Acquisition Zones ..............10-44 Polygonal Acquisition Zones ............10-46 Own Ship AIS ..................10-47 Own Ship ..................10-47 Own Ship AIS Messages ..............10-49 ...
- Page 19 Radar/Chart Radar User Guide Table Of Contents Chart Types ..................12-2 Chart Data on a Radar Display ............12-2 Chart Rendering ................. 12-3 Factors affecting Chart Accuracy ............12-3 Chart Overscale .................. 12-4 Larger Scale Available Prompt ............12-5 ...
- Page 20 Table Of Contents Radar/Chart Radar User Guide Display Chart Updates ..............12-56 Importing or Exporting Chart Updates ..........12-57 Chart Query ................... 12-59 Query Features ..................12-60 Query Results ................... 12-60 Query Options ................... 12-62 ...
- Page 21 Radar/Chart Radar User Guide Table Of Contents Report ....................14-15 DataLog .................... 14-17 Sensor Status ................... 14-20 Connection Status on a Multi-Node System ........14-24 Connection Status on a Client/Server Radar System ...... 14-25 Buzzer....................14-26 ...
- Page 22 Table Of Contents Radar/Chart Radar User Guide Static Position ................... B-5 Target Anchor Watch ................B-6 Target Based Range and Bearing ............B-7 Glossary 65900010...
-
Page 23: Chapter 1 Overview Hardware Configurations
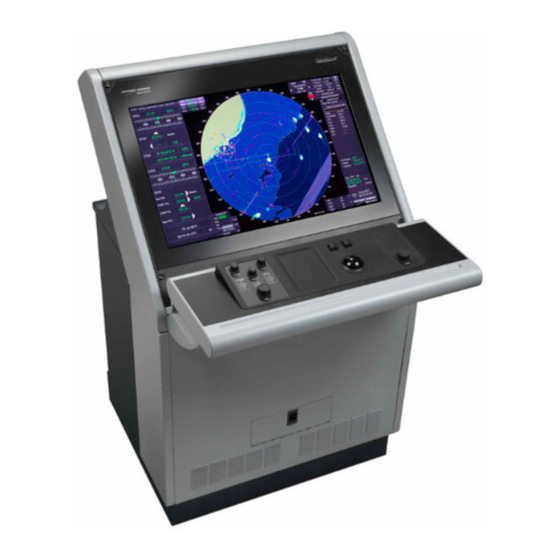
Radar/Chart Radar User Guide Overview Chapter 1 Overview Hardware Configurations A VisionMaster FT system consists of the following hardware configurations: A single node system, comprising one console connected to a transceiver, antenna and turning unit (collectively known as a Scanner Unit), see Single System. - Page 24 Overview Radar/Chart Radar User Guide Single System 65900010...
- Page 25 Radar/Chart Radar User Guide Overview Scanner Assembly . Comprises an Antenna unit, a Turning unit and an optional Performance Monitor. If the system includes an integral transceiver then this also forms part of the Scanner Assembly. If the system uses a bulkhead transceiver then the transceiver unit is not included in the Scanner assembly.
-
Page 26: Interswitched System
Overview Radar/Chart Radar User Guide Interswitched System The basic, single-scanner/single-console configuration can be expanded by the introduction of an Interswitch Unit, plus additional scanners and display configurations. The arrangement below shows two scanners (S band or X band), two transceivers (A and B) with a two-way interswitch unit connected to two consoles. - Page 27 Radar/Chart Radar User Guide Overview A console selected as a master display has full control of the connected scanner. The controls available at a master display but NOT at a slave display are as follows: switching the transceiver between standby and transmit mode ...
-
Page 28: Multi-Node System
Overview Radar/Chart Radar User Guide Multi-Node System A multi-node system may include a number of consoles which have been configured as specific product types, see Watch Mode. Each console is linked via a LAN so that data input to one console is available to all. -
Page 29: Dual Radar - Single System
Radar/Chart Radar User Guide Overview Dual Radar – Single System A dual radar system can connect to two scanner units at the same time, enabling the overlay of radar video from both scanners to form a composite display. Each radar video source is known as a `Channel’. A dual radar system includes an additional scan converter card and an auxiliary PCIO unit. -
Page 30: Dual Radar - Interswitched System
Overview Radar/Chart Radar User Guide Dual Radar – Interswitched System On an interswitched system a display radar channel can be associated with any one of the scanner units in the system. A scanner unit can be selected from its associated display as a Master radar channel for controlling that scanner, or as a Slave radar channel if another display radar channel has been selected as the Master. -
Page 31: Dual Radar Features
Radar/Chart Radar User Guide Overview Dual Radar Features The following specific features are available if your VisionMaster FT system is configured as dual channel radar: Targets can be tracked on one channel through the blind arc of the other channel. -
Page 32: Client Server Radar System
Transceiver it is connected. This process is controlled by negotiation between the Servers and is known as Virtual Interswitching. The Client nodes, whether acting as Master or Slave, retain the same independent control of video presentation capability as a conventional VisionMaster FT system. 1-10 65900010... -
Page 33: Product Types
Radar/Chart Radar User Guide Overview Product Types The following table lists the VisionMaster FT Radar and Chart Radar product types available: Max. number Product Type of tracked Monitor targets CAT 1 Radar CAT1 23”, 25.5” or 27” CAT 1 Chart Radar CAT1C 23”, 25.5”... -
Page 34: Applicable Features
Overview Radar/Chart Radar User Guide Applicable Features Features applicable to the product types listed are given in the following tables: Features common to all Product Types, see page 1-13. Features available to CAT 1 Radar/Chart Radar and CAT 2 Enhanced Radar/Chart Radar, see page 1-16. -
Page 35: Features Common To All Product Types
Radar/Chart Radar User Guide Overview Features common to all Product Types The following table lists the features which are common to all VisionMaster Radar/Chart Radar product types. Feature Additional details Selection and set up. Transceiver control Manual/automatic tuning. Video gain. Video processing controls Manual/automatic anti-clutter sea/rain control. - Page 36 Overview Radar/Chart Radar User Guide Feature Additional details Two electronic bearing lines – EBL 1 & EBL 2. Defining and displaying Two variable range markers – VRM 1 & VRM 2. EBLs, VRMS & ERBLs Each EBL/VRM pair can be displayed as a combined ERBL –...
- Page 37 Radar/Chart Radar User Guide Overview Feature Additional details Extensive monitoring and Built in self tests (BIST). test facilities Monitor the performance of the system or the receiver Generate a report and export the report file. View Datalog files and export the datalog as a zip Diagnostic facilities file.
-
Page 38: Features Available To Cat 1 Radar/Chart Radar And
Overview Radar/Chart Radar User Guide Features available to CAT 1 Radar/Chart Radar and CAT 2 Enhanced Radar/Chart Radar The following table lists additional features to those listed in the previous table, which are available to CAT 1 Radar/Chart Radar and enhanced CAT 2 Radar/Chart Radar product types. -
Page 39: Features Available To Chart Radar (Cat1C & Enhanced Cat2C)
Radar/Chart Radar User Guide Overview Features available to Chart Radar (CAT1C & Enhanced CAT2C) The following table lists the additional features to those listed in the previous two tables, which are available to CAT 1 and enhanced CAT 2 Chart Radar product types. These features are available on the Chart Radar watch mode of a Total Watch system. -
Page 40: Total Watch
Overview Radar/Chart Radar User Guide Total Watch If your VisionMaster FT system is configured as a Total Watch, in addition to the Radar/Chart Radar variants, the following product types may be available from the Watch Mode button: Chart Radar ... -
Page 41: Information On Sensor Inputs To The System
Radar/Chart Radar User Guide Overview Information on Sensor Inputs to the System The VisionMaster Radar system is Type Approved using 19", 23.1", 25.5" and 27" displays with X-Band and S-Band top units. To function correctly the system requires sensor input from external devices. Any limitations associated with the method of sensor input are stated below. -
Page 43: Chapter 2 Getting Started With Radar
Radar/Chart Radar User Guide Getting Started with Radar Chapter 2 Getting Started with Radar This section shows you how to start up the system and how to use the controls. The following topics are covered: Switching on and starting up the radar ... -
Page 44: System Controls
Radar/Chart Radar User Guide Getting Started with Radar System Controls The operator controls the VisionMaster FT system via a control panel assembly, monitor controls and a power On/Off switch. Control Panel The Control Panel consists of the following group of controls: ... - Page 45 Getting Started with Radar Radar/Chart Radar User Guide Trackball Assembly The trackball assembly comprises a trackball and two associated keys (left and right). The trackball controls the position of the screen cursor. Selections are made by positioning the cursor over a menu caption or control button on the video circle and clicking (press and release) on the left key.
-
Page 46: Monitor Controls
Radar/Chart Radar User Guide Getting Started with Radar Monitor Controls The monitor controls include an On/Off button and a brightness adjustment button. The On/Off button controls the monitor only; it does NOT control the radar system. The brightness adjustment control has an indexed position, marked as a white line. -
Page 47: System Start-Up
Getting Started with Radar Radar/Chart Radar User Guide System Start-Up Switching on the System The VisionMaster workstation is designed such that one switch at the workstation typically applies power to that workstation’s computer and monitor. In a multi-node system, as the system is started, the software automatically establishes communication with other workstations that may already be running. -
Page 48: Software Start-Up
Radars, two Chart Radars and one ECDIS). Starting up the software takes approximately 2 to 3 minutes. Soon after the system is powered up the VisionMaster FT Start Up window appears on the screen, this window shows the current system software version number, copyright information and a status bar displaying the system loading status. -
Page 49: Setup Procedures
Getting Started with Radar Radar/Chart Radar User Guide Setup Procedures After the VisionMaster software has loaded, some setup procedures may be necessary. To verify proper setup, make the following checks: On the sensor data display at the top left of the screen, the ... -
Page 50: System Security
Start-up) with the codes contained in the software configuration file. The following rules govern system security: In order for the VisionMaster FT to operate effectively, a Security Block device must be properly programmed by Sperry Marine and attached to the workstation PC. -
Page 51: Standby Mode
Getting Started with Radar Radar/Chart Radar User Guide Standby Mode After the system has powered up the radar is always in Standby mode, with own ship's symbol shown centred in the video circle (see Own Ship Symbols). In Standby mode the video circle displays the message Radar Standby. -
Page 52: Transmit Mode
Radar/Chart Radar User Guide Getting Started with Radar Transmit Mode The following functions are only available when the radar is in Transmit mode: Pulse Length Display and selection of target data Video Processing Controls (video Gain, Rain and Sea anti clutter control) Radar Fine Tuning ... -
Page 53: Screen Layout For Widescreen Display
Getting Started with Radar Radar/Chart Radar User Guide Screen Layout for Widescreen Display If your VisionMaster system includes a widescreen, the area to the left of the main display will be available for CID (Conning Information Display) pages. For information on configuring and creating CID pages, see Chapter 4 ‘Conning Information Display’... -
Page 54: Using The Cursor
Radar/Chart Radar User Guide Getting Started with Radar Using the Cursor Whenever the cursor is displayed, a dialog box in the bottom right of the display gives a readout of the cursor’s position within the video circle. By default the Cursor window gives cursor range and bearing (from own ship) and cursor latitude/longitude, see Cursor Readout. - Page 55 Getting Started with Radar Radar/Chart Radar User Guide When a mapping object is created or edited, the letters MO EDIT appear below the cursor, see Mapping. When the cursor moves over an object to be deleted the letters DEL appear below the cursor. When Delete Radar Maps is selected and the video cursor moves over a mapping object, the cursor lines change to diagonal and the letters DEL appear below...
-
Page 56: Online Help
Radar/Chart Radar User Guide Getting Started with Radar Online Help The VisionMaster FT system includes an online Help Guide that provides information and procedures necessary to operate the system. A context-sensitive help facility is also provided. This type of help is called "context-sensitive"... -
Page 57: On-Screen Keyboard
Getting Started with Radar Radar/Chart Radar User Guide On-Screen Keyboard The Help Guide includes a screen keyboard that allows the operator to enter textual and numerical data. To access the keyboard click the On-Screen Keyboard button at the bottom of the VisionMaster Help window. A keyboard window appears below the Help Guide, replicating a standard computer keyboard. -
Page 58: Accessing Tool Tips
Radar/Chart Radar User Guide Getting Started with Radar Accessing Tool Tips As the screen cursor moves over the system function buttons the text in the highlighted button changes from white to yellow and a tool tip for that function is briefly displayed in a popup window. -
Page 59: Operator Messages
Getting Started with Radar Radar/Chart Radar User Guide Operator Messages The system generates messages that appear in order to either confirm an action to proceed that the operator has requested, for example, when switching from Transmit to Standby. Or a message to confirm an action that the system is about to make, for example to acknowledge a change of own ship's course on a monitored route. -
Page 60: System Shut Down
To shut down a standalone node, or your particular node on a multi-node system, select Shutdown System in the System menu (see Shutdown) and wait for the VisionMaster FT application and the Windows operating system to power down. When the software has fully powered down then switch the On/Off switch to off. -
Page 61: Chapter 3 Basic Operation Of Radar
Radar/Chart Radar User Guide Basic Operation of Radar Chapter 3 Basic Operation of Radar This section describes the basic operation of the radar. The following topics are covered: Accessing the main menu and sub-menu functions A description of transmit mode and returning to standby mode. ... -
Page 62: Selecting Transmit Mode
Basic Operation of Radar Radar/Chart Radar User Guide Selecting Transmit Mode When Transmit is selected from Standby, the system is switched to Transmit mode. To switch to Transmit mode do the following: 1. With the system in Standby, position the screen cursor over the Standby toggle button. -
Page 63: Selecting Transmit Mode In A Client Server Radar System
Radar/Chart Radar User Guide Basic Operation of Radar Selecting Transmit Mode in a Client Server Radar System In a Client/Server Radar (CSR) system switching to transmit is only possible if that Client is selected as a Master, or if the Client is a Slave and the Master Client connected to the same Transceiver/Server (TRServer) is in transmit. -
Page 64: Dual Radar - Transmit And Video Mode Selection
Basic Operation of Radar Radar/Chart Radar User Guide Dual Radar – Transmit and Video Mode Selection A Dual Radar system allows the overlay of video from two separate transceivers on one display. The Standby/Transmit status of each transceiver may be independently selected, and the video display for each transceiver channel switched on and off. -
Page 65: Status Area
Radar/Chart Radar User Guide Basic Operation of Radar Status Area At the bottom right of the screen is a status area containing four tab pages; each page is accessed by clicking on the tab. The four pages display the following information: ... -
Page 66: Accessing Main Menu And Sub Menu Functions
Basic Operation of Radar Radar/Chart Radar User Guide Accessing Main Menu and Sub Menu Functions The Main Menu functions are hidden at start up, to access these functions move the cursor over the Show Menu button at the bottom right of the screen. -
Page 67: Sub Menu Selection And Navigation Bar
Radar/Chart Radar User Guide Basic Operation of Radar Sub Menu Selection and Navigation Bar A sub menu selection and navigation bar is included at the top of the Features area of the screen. The bar displays the currently selected sub menu. -
Page 68: Cursor Readout
Basic Operation of Radar Radar/Chart Radar User Guide Cursor Readout The cursor readout data is located in Status Area at the bottom right of the screen. To access the cursor readout click on the Curs tab. The readout displays the location of the cursor position relative to the CCRP of own ship. - Page 69 Radar/Chart Radar User Guide Basic Operation of Radar Where the LAT/LON and bearing data is acquired from a valid sensor data source the values are displayed in green, if the position data is degraded then the values are displayed in orange, if the position data is considered invalid and unusable the data is shown in red.
-
Page 70: Position
Basic Operation of Radar Radar/Chart Radar User Guide Position Summary data on own ship's Lat/Lon position is displayed in the Status Area at the bottom right of the screen. . To access the Position data click on the Posn The Position window includes the following data: ... - Page 71 Radar/Chart Radar User Guide Basic Operation of Radar A Loran-C device or an older GPS device may not provide position using the GGA sentence. In this case the GLL sentence may be used. Quality indicators when using the GLL sentence are shown in the table below. GLL - system mode indicator Indicator Description...
- Page 72 Basic Operation of Radar Radar/Chart Radar User Guide The field to the right of the quality indicator denotes the datum used for position data (defaults to WGS84). For information on WGS-84 datum see `Factors affecting Chart Accuracy' in Chart Facility. ...
-
Page 73: Range Scales
Radar/Chart Radar User Guide Basic Operation of Radar Range Scales A set of pre-defined range scales are provided. The range scale varies from 0.125 NM to 96 NM. The current range is shown on the range scale button, between the < and > buttons. -
Page 74: Range Rings
Basic Operation of Radar Radar/Chart Radar User Guide Range Rings The Range Ring button enables you to toggle the display of range rings on or off. When range rings are switched on the button shows the current scale in nautical miles (NM). The range rings are centred on own ships CCRP and are equally spaced. -
Page 75: Sensor Data Display
Radar/Chart Radar User Guide Basic Operation of Radar Sensor Data Display The information shown in the sensor data display is transmitted via navigation sensors. This information is available in both Standby and Transmit modes. Each sensor is identified by the following data types: ... -
Page 76: Data Source
Basic Operation of Radar Radar/Chart Radar User Guide Valid sensor data is shown in green. If the data is currently invalid it is shown in red. Data Source The currently selected sensor from which the readout is taken. Stabilisation Options There are two stabilisation modes for target tracking, ground and water referenced. -
Page 77: Off Centre, Pan And Goto
Radar/Chart Radar User Guide Basic Operation of Radar Off Centre, Pan and Goto The following positioning options are available from a semi-transparent window when you right click within the video circle. Off-centre Own Ship - moves own ship to a selected position, with all chart and target positions also moved in accordance. -
Page 78: Panning
Basic Operation of Radar Radar/Chart Radar User Guide Panning The Pan function enables you to pan the display to view neighbouring areas by positioning a selected point at the centre of the video circle. If the current motion mode is Relative Motion (RM) the system automatically changes the motion mode to True Motion (TM) when Pan is selected. -
Page 79: Goto
Radar/Chart Radar User Guide Basic Operation of Radar Goto The Goto.. function enables the centre of the video circle to be moved to known locations or a specific location on the chart. Any geographic location can be designated by its LAT/LON coordinates. Locations that may be used repeatedly can be saved by name, and then selected from a drop- down list, which is sorted alphabetically. - Page 80 Basic Operation of Radar Radar/Chart Radar User Guide To rename or delete a location do the following: To delete a saved location: 1. Select the location name to be deleted by clicking on the Locations drop down arrow. 2. With the location shown in the field, click the Delete button.
-
Page 81: Centre & Maximum View Options
Radar/Chart Radar User Guide Basic Operation of Radar Centre & Maximum View Options Centring the Video Display If the picture has been off centred or panned (see Panning and Off Centring) the display can be redrawn with own ship's CCRP at the centre of the video circle by clicking on the Centre button. -
Page 82: Heading Line, Beam Line And Stern Line
Basic Operation of Radar Radar/Chart Radar User Guide Heading Line, Beam Line and Stern Line The Heading Line (HL) and Stern Line (SL) are lines drawn parallel to the ship’s fore/aft axis indicating the current own ship heading (HL) or the reciprocal of the current own ship heading (SL). - Page 83 Radar/Chart Radar User Guide Basic Operation of Radar For further information on how the presentation mode affects own ship's heading line, see Presentation Modes. Beam Line The beam line is a short line drawn at right angles to the heading line and extending to each side of own ship's CCRP, the default (minimum) length is 10mm.
-
Page 84: Own Ship Symbols
Basic Operation of Radar Radar/Chart Radar User Guide Own Ship Symbols There are three types of symbol that may be used to display own ship’s position and heading: Minimised Symbol Outline Symbol Custom Symbol Minimised Symbol The minimised symbol is drawn where the scaled outline symbol cannot be resolved at the given range scale. -
Page 85: Custom Symbol
Radar/Chart Radar User Guide Basic Operation of Radar The position of the minimised symbol wrt the outline symbol is dependent on CCRP location offsets applied at commissioning. Custom Symbol This symbol represents ownship drawn to the actual outline of the ship. The custom symbol is displayed when Custom Symbol is selected in Ownship Display Settings and the beam of the ship is larger than 3mm on the display. -
Page 86: Predicted Vector
Basic Operation of Radar Radar/Chart Radar User Guide When in ground stabilised mode, the vector line is drawn to reflect the COG shown on the sensor data display. When in water stabilised mode, the vector line is drawn to reflect the course through the water based on the current heading shown on the sensor data display. -
Page 87: Radar Settings
Radar/Chart Radar User Guide Basic Operation of Radar Radar Settings Your display may be configured to operate with one of six transceivers (labelled A to F) located at different positions on the ship. Each transceiver may be either an X-Band or S-Band. The display can be a master display or a slave display. -
Page 88: Radar Settings On Client/Server
Basic Operation of Radar Radar/Chart Radar User Guide Radar Settings on Client/Server On a Client/Server Radar (CSR) system a physical interswitch is not used. Client nodes connect to Server nodes via a network of Ethernet switches. The Clients are virtually interswitched to the requested Server, with each Server connected to a transceiver. -
Page 89: Radar Transmission Pulse Length
Radar/Chart Radar User Guide Basic Operation of Radar Radar Transmission Pulse Length The current selection of pulse length is indicated in the pulse length toggle button. The caption is an abbreviation of the current pulse length selection (SP, MP or LP). The pulse length can only be changed on a master display and in Transmit. -
Page 90: Chart/Radar Maps View & Chart Database Selection
Basic Operation of Radar Radar/Chart Radar User Guide Chart/Radar Maps View & Chart Database Selection Where the system is enabled for Chart Radar the following viewing options may be selected from the Chart and Radar Maps button: Chart Filled - displays a complete chart presentation, with land and sea shown as different colours. -
Page 91: Ais Input And Filter Button
Radar/Chart Radar User Guide Basic Operation of Radar All variations of SevenCs charts are installed from the SevenCs ChartHandler utility, which runs without requiring the VMFT node to be shutdown. For information refer to Installing SevenCs Charts. C-Map charts are installed from the Sperry Chart Installer utility. This process requires shutting down the VMFT application and is therefore described in the Supplementary Features User Guide, 65900014, Chapter 1, `Chart Installation'. -
Page 92: Video Processing Controls
Basic Operation of Radar Radar/Chart Radar User Guide Video Processing Controls The video processing controls are located in the bottom left hand corner of the display. The current level is indicated by the shaded bar adjacent to the video control caption. All the video processing levels are shown in grey colour (non-editable) in Standby. - Page 93 Radar/Chart Radar User Guide Basic Operation of Radar Always use the control with great care. Excessive suppression can cause loss of small targets. It is often advantageous to use this control to search for targets in the clutter region, returning the control to zero after the search.
-
Page 94: Enhanced Video Mode
Basic Operation of Radar Radar/Chart Radar User Guide 3. Left click to set the level and de-activate the bar adjustment. The bar will return to its green shaded state and the percentage figure disappears. When Auto Anti-Clutter check box is ticked after adjustment the Rain and Sea anti clutter settings appear grey. -
Page 95: Dual Radar Video Processing Controls
Radar/Chart Radar User Guide Basic Operation of Radar Dual Radar Video Processing Controls On a dual radar system the Gain and anti- clutter controls (Rain and Sea) can be independently adjusted for each channel. For example, the Auto/Manual control on Channel 1 may be set to manual (Man 1) with Channel 2 remaining in Auto (Auto 2). -
Page 96: Radar Fine Tuning
Basic Operation of Radar Radar/Chart Radar User Guide Radar Fine Tuning The radar tuning indicator is located in the bottom left hand of the display, below the video processing controls. The current level of tuning is indicated by the shaded bar adjacent to the Tune caption and is continuously updated. -
Page 97: Manual Fine Tuning Adjustment
Radar/Chart Radar User Guide Basic Operation of Radar Manual Fine Tuning Adjustment For manual fine tuning, long pulse (LP) must be selected, ideally using the highest range scale that shows a known target near to the edge of the radar circle. The tuning mode should be set to Manual. To manually fine tune do the following. -
Page 98: Radar Fine Tuning On A Dual Radar
Basic Operation of Radar Radar/Chart Radar User Guide Radar Fine Tuning on a Dual Radar On dual radar both radar channels may be separately tuned, providing each transceiver is set as a Master. On dual radar a Tune control is accessed from the features area of the display, similar to the controls described previously for adjusting dual radar video processing. -
Page 99: Synthetics Button
Radar/Chart Radar User Guide Basic Operation of Radar Synthetics Button The Synthetics button enables all synthetics on the screen to be temporarily suppressed. Radar video and trails are not suppressed. To suppress synthetics: 1. Left click and hold the left key down on the Synth On button. The button changes to Synth Off and the screen displays radar video only. -
Page 100: Trial Manoeuvre
Basic Operation of Radar Radar/Chart Radar User Guide Trial Manoeuvre Trial Manoeuvre is a facility that allows the effect of a proposed manoeuvre, based on rate of turn for own ship, to be displayed, both graphically and alpha-numerically. This gives the operator the ability to evaluate the possibility of collisions, by observing the theoretical relative target vectors that would be produced. - Page 101 Radar/Chart Radar User Guide Basic Operation of Radar The ranges and default values for trial manoeuvres are shown in the table below. Parameter Ranges Power on Default Final True 0 to 359.9°, in 0.1° increments 000.0° Course Manoeuvre 0.0 kn to 75 kn 15 kn Speed Time to...
-
Page 102: Delay Countdown
Basic Operation of Radar Radar/Chart Radar User Guide Turn Radius The turn radius figure is generated from the manoeuvre speed and the rate of turn and is therefore not editable. Delay Countdown To start the manoeuvre delay countdown tick the Timer check box, the time value previously entered in the Time to Turn field starts to count down to zero in real time, whether or not Manoeuvre On is enabled. -
Page 103: Trial Manoeuvre Vector
Radar/Chart Radar User Guide Basic Operation of Radar The display of True or Relative vectors for trial manoeuvre is determined by the Vector mode selection button. Enter the proposed vector time by left clicking in the value field and moving the joystick left or right to increase or decrease the vector time. -
Page 104: Watch Mode
Products not available from the Watch Mode list can be purchased from your VisionMaster FT supplier. For user information on the Conning Information Display (CID), Playback mode and Third Party Applications refer to the Supplementary Features User Guide, 65900014. -
Page 105: Total Watch Features
Radar/Chart Radar User Guide Basic Operation of Radar Total Watch Features When a watch mode is changed on a Total Watch product, certain settings made that are common to Radar/Chart Radar and ECDIS are retained across modes. These common settings include: Transmit/Standby ... -
Page 106: Safety Checking
Basic Operation of Radar Radar/Chart Radar User Guide Safety Checking The safety checking facility provides the operator with advanced warning that own ship may be headed towards objects that could endanger the safety of own ship, as indicated in the ENC or mariner object database. - Page 107 Radar/Chart Radar User Guide Basic Operation of Radar box has been ticked in the Dangers sub menu, see Dangers in Chapter 12, Charts. WARNING! THE ABILITY TO DETECT CHART DANGERS IS RELIANT ON THE QUALITY OF THE DATA CONTAINED IN THE LOADED AND ENABLED CHART DATABASE AND THE QUALITY OF THE VECTOR CHART COVERAGE.
-
Page 108: Multi-Node Support
Basic Operation of Radar Radar/Chart Radar User Guide Multi-node Support All nodes on a multi-node system perform safety checking. Each node in the system will list the objects of concern detected by own ship safety checking the charts on that particular node. The periodic own ship safety checking is triggered on all nodes at the same time. -
Page 109: Alternate Bow
Radar/Chart Radar User Guide Basic Operation of Radar Alternate Bow If an alternate bow in use has been configured the system assumes that there are two bows that may be used, the `normal bow’ at the front of the ship and the ‘alternate bow’, usually at the rear of the ship. The system should also be configured to include two CCRPs, one applicable for each bow direction. -
Page 110: Russian River Register Selection
Basic Operation of Radar Radar/Chart Radar User Guide Russian River Register Selection This is an optional feature that allows the system to satisfy the differing requirements of vessels that must confirm to IMO regulations whilst at sea, and Russian River Register (RRR) regulations when navigating rivers. When the feature is configured the operator can switch between IMO mode (default mode), and RRR mode by clicking on a selection button that displays the current... -
Page 111: Appendix A - Operational Functions Specific To Multi-Node And
Radar/Chart Radar User Guide Basic Operation of Radar Appendix A - Operational Functions specific to Multi-node and Client/Server Systems The following operational function is specific to a multi-node system. System In Control The following operational function applies to a multi-node system and Client/Server Radar (CSR) system. -
Page 112: Automatic Transfer Of Control
Basic Operation of Radar Radar/Chart Radar User Guide If any of the functions listed above are accessed from a node assigned as `Never In Control’, the function's values are greyed out and a temporary prompt appears confirming that SIC has restricted access to this feature. -
Page 113: Database Synchronization
Radar/Chart Radar User Guide Basic Operation of Radar Database Synchronization In a multi-node system and/or Client/Server Radar (CSR) system VisionMaster uses a database to record and share certain information. This information includes Routes, PI Lines, GoTo locations, Radar Maps, Manual Chart Updates and User Profiles. In both multi-node and CSR systems one node is assigned to be the master copy of this database (the master node is displayed on the Database tab in the System Diagnostics menu). -
Page 115: Chapter 4 Sensor Management Sensors Menu
Radar/Chart Radar User Guide Sensor Management Chapter 4 Sensor Management Sensors Menu The Sensors menu allows the operator to select the sensor source to be used for each type of data (e.g. heading, water speed, position etc.). In addition to the selection of a sensor source, adjustments to the heading alignment can be made at the Heading sensor, and an offset position can be applied to a Position sensor. -
Page 116: Sensor Data Source
Sensor Management Radar/Chart Radar User Guide Sensor Data Source The name of each available sensor data source is listed. The sensor source currently used and its current value are highlighted in bold and the sensor's radio button selected. Heading Sensor To change the current sensor source for heading, see Heading Source Values. -
Page 117: Primary Sensors On Radar Systems
Radar/Chart Radar User Guide Sensor Management Primary Sensors on Radar Systems The following is a list of primary sensors applicable to a Radar system: True Heading Speed Through Water Position Course Over Ground Speed Over Ground ... -
Page 118: Sensor Data Sources
Sensor Management Radar/Chart Radar User Guide Sensor Data Sources Heading Source Values The Heading folder is divided into two areas; Sensors and Alignment. The Sensors area lists the available heading sensor sources with the active sensor source and its current value in highlight. The Alignment area shows alignment information applicable to each of the alignable heading sensors in the system. -
Page 119: Stw Source Values
Radar/Chart Radar User Guide Sensor Management 2. Move the trackball left or right to alter the value. The heading readout changes when the alignment value changes even if the compass is unaligned. STW Source Values folder lists the available STW sensor data sources with the currently active sensor source and its value in highlight. -
Page 120: Cog Source Values
Sensor Management Radar/Chart Radar User Guide COG Source Values sensor provides information about own ship course based on actual position history (when a position sensor such as GPS is providing the data). The COG folder lists the available COG sensor data sources with the currently active sensor source and its value in highlight. -
Page 121: Sog Source Values
Radar/Chart Radar User Guide Sensor Management 4. Where the sensor is changed the values shown against the selected sensor source are applied. If manual data is entered the COG readout shown in the Indicator Display is displayed in yellow and the ship's vector line displayed in red. If your SOG goes below 0.5 knots the COG value will show as a series of green dashes. -
Page 122: Position Values
Sensor Management Radar/Chart Radar User Guide 3. When the sensor being selected for SOG also provides other data types (e.g. COG and Position), a window appears prompting to select which of these other data types should also be taken from manual data, with the data type's current sensor source displayed. - Page 123 Radar/Chart Radar User Guide Sensor Management Dead Reckoning values If valid position data for own ship is not received within a short period of time from the sensor interface the system establishes a computed position by dead reckoning from the last valid position received using own ship’s direction and speed.
- Page 124 Sensor Management Radar/Chart Radar User Guide 1. To enter manual sensor data click in the Man field, the text changes to green (editable). Move the trackball left or right to enter the required value and left click to exit edit mode. 2.
- Page 125 Radar/Chart Radar User Guide Sensor Management Position Offset The Position Offset area shows the current sensor and enables the operator to enter a position on the chart known to correspond with own ship’s position and enter an offset bearing value. Offset values are applied to all data received from the applicable position sensor.
-
Page 126: Depth Source Values
Sensor Management Radar/Chart Radar User Guide Depth Source Values The Depth sensor provides information on the current depth values: depth below keel (DBK) depth below transducer (DBT) depth below waterline (DBW) The specific sensor information available will depend upon installed and configured sensor devices. - Page 127 Radar/Chart Radar User Guide Sensor Management 1. To enter manual sensor data click in the Manual Set and Drift fields, the text changes to green (editable). Move the trackball left or right to enter the required value and left click to exit edit mode. 2.
-
Page 128: Rate Of Turn Values
Sensor Management Radar/Chart Radar User Guide Rate of Turn Values The Rate of Turn (ROT) folder lists the available ROT sensor data sources with the currently active sensor source and its value in highlight. When Computed is selected for the sensor data source for ROT the system continually computes the values based on other active types of sensor data received conventionally... -
Page 129: Chapter 5 Presentation, Motion, Vector And Trail Modes
Radar/Chart Radar User Guide Presentation, Motion, Vector and Trail Modes Chapter 5 Presentation, Motion, Vector and Trail Modes The following topics are covered in this chapter: Selecting a presentation mode and how this affects the video display. Selecting a motion mode and how this affects the display of own ship and other targets on the display. -
Page 130: Presentation Modes
Presentation, Motion, Vector Radar/Chart Radar User Guide and Trail Modes Presentation Modes Data from the compass can be processed to produce a correct ‘stabilised ’ display. There are three types of stabilised mode available: Stabilised Head Up, North-Up and Course-Up. A valid source of heading data must be selected to use a stabilised mode. - Page 131 Radar/Chart Radar User Guide Presentation, Motion, Vector and Trail Modes Stabilised Head-Up (H Up stab) In this mode (as in Unstabilised Head Up) the ship’s heading marker is always shown vertically upwards indicating straight ahead movement, irrespective of own ship's current bearing. The bearing scale shows ship's current heading at the top of the video circle.
- Page 132 Presentation, Motion, Vector Radar/Chart Radar User Guide and Trail Modes North-Up (N Up) The bearing scale shows 000° at the top of the video circle (assumed to be true north). The ship’s heading marker is shown at the appropriate bearing. If the vector mode is True then own ship's vector is displayed.
- Page 133 Radar/Chart Radar User Guide Presentation, Motion, Vector and Trail Modes To change the presentation mode, do the following: 1. Click the presentation mode button. This will cycle through N Up and C Up presentation modes only. Or, to select a Head Up presentation mode: 1.
-
Page 134: Dual Radar Presentation
Presentation, Motion, Vector Radar/Chart Radar User Guide and Trail Modes Dual Radar Presentation On a dual radar system Channel 1 and Channel 2 video origin can be at different locations, depending on transceiver offsets made in commissioning. Channel 1 Video Origin A small symbol is displayed centred on the channel 1 video origin. -
Page 135: Motion Modes
Radar/Chart Radar User Guide Presentation, Motion, Vector and Trail Modes Motion Modes The currently selected Motion Mode is displayed at the top right of the screen. There are two motion modes available: True Motion (TM) Relative Motion (RM) The motion mode determines how chart information is updated;... - Page 136 Presentation, Motion, Vector Radar/Chart Radar User Guide and Trail Modes Range Scales affecting Motion Modes RM is available at all range scales. TM is available on range scales 0.5 NM to 48 NM. If the range scale is outside these limits, the motion mode will temporarily revert to RM, with the RM lettering displayed in a warning colour (amber).
-
Page 137: Vector Modes
Radar/Chart Radar User Guide Presentation, Motion, Vector and Trail Modes Vector Modes Vectors are shown on the radar display to indicate the velocity (speed and direction) of own ship and moving targets. All vectors are shown as a dashed line beginning at own ship CCRP or the target origin. The length of the vector indicates speed and its bearing indicates direction. - Page 138 Presentation, Motion, Vector Radar/Chart Radar User Guide and Trail Modes Relative Vectors If own ship is moving, all targets, both moving and stationary, have a vector representing their movement (speed and direction) relative to own ship. Own ship will not have a vector in this mode.
-
Page 139: Vector Time
Radar/Chart Radar User Guide Presentation, Motion, Vector and Trail Modes Vector Time The Vector Time selected will determine the length of the vectors shown on the radar display. The length of a vector represents the distance the ship or target will travel in the vector time. For example: ... -
Page 140: Trails Mode
Presentation, Motion, Vector Radar/Chart Radar User Guide and Trail Modes Trails Mode In addition to a target's vector the radar shows decaying video trails, showing the history of a target’s movements. Video trails may be displayed in True or Relative mode: ... -
Page 141: Trail Length Time
Radar/Chart Radar User Guide Presentation, Motion, Vector and Trail Modes The Trails button is displayed at the top right of the screen. True or relative mode is denoted by the letter T or R. The trail mode listed above is also shown on the button. - Page 142 Presentation, Motion, Vector Radar/Chart Radar User Guide and Trail Modes When switching between trails length, it takes as long as the new time selection for the trail time to be representative. For example, changing from 30 seconds on Short to 90 seconds on Long will take 60 seconds for the trails to represent how far the targets have moved.
-
Page 143: Chapter 6 Navigation Tools
Radar/Chart Radar User Guide Navigation Tools Chapter 6 Navigation Tools This section covers the creating, editing and deleting of the following navigation tools: Parallel Index Lines Clearing Lines Mapping Objects Line of Position Ownship History ... -
Page 144: Parallel Index Lines
Navigation Tools Radar/Chart Radar User Guide Parallel Index Lines The Parallel Index (PI) Lines facility allows multiple sets of parallel index lines to be displayed simultaneously. Each set may include up to fifteen lines. The lines span the entire video circle, irrespective of the range scale in use. -
Page 145: Edit Parallel Index Lines
Radar/Chart Radar User Guide Navigation Tools Edit Parallel Index Lines The Edit tab folder opens as default when Parallel Index Lines is selected, and the Selected Set shows <Default Set>. Information on PI lines associated with the default set is displayed in the Line Data section of the folder. -
Page 146: Adding Pi Lines Or Deleting Sets
Navigation Tools Radar/Chart Radar User Guide Adding PI Lines or deleting Sets To add a PI line or delete a set do the following: 1. With the PI set name entered click the Add Line button. A line is created and the default line values are shown in the Line Data area. -
Page 147: Realigning Pi Lines And Sets
Radar/Chart Radar User Guide Navigation Tools Realigning PI Lines and Sets A set of PI Lines may be realigned so that all lines are redrawn to own ship's current heading. This feature applies to the Default Set as well as operator defined sets of PI lines. -
Page 148: Copying Or Renaming Pi Line Sets
Navigation Tools Radar/Chart Radar User Guide Copying or Renaming PI Line Sets To copy or rename a PI line set do the following: To copy a PI Line set: 1. Highlight the set name from the Selected Set drop down list and click on the Copy Set button. -
Page 149: Editing Pi Lines
Radar/Chart Radar User Guide Navigation Tools Editing PI Lines To edit a PI line do the following: A different line style for each PI line may be selected, or a line style may be applied to all lines in the set. To select a line style for each PI line: 1. - Page 150 Navigation Tools Radar/Chart Radar User Guide To change which side of the ship a PI line is displayed: 1. From the Line Data area click on the Toggle Side of Ship button to the right of the line bearing 2. The selected PI line changes to the other side of own ship, without changing its bearing value.
- Page 151 Radar/Chart Radar User Guide Navigation Tools When a truncated PI line is selected a short line is drawn perpendicular to the PI line's axis at the truncated end. To delete a PI line, select the line as described above and click the Delete Line button.
-
Page 152: Display Parallel Index Lines
Navigation Tools Radar/Chart Radar User Guide Display Parallel Index Lines The Display tab folder enables the selection of one or more sets of Parallel Index Lines to be displayed on the video circle. When Display is initially accessed no PI Line Sets are selected for display. -
Page 153: Importing And Exporting Pi Lines
Radar/Chart Radar User Guide Navigation Tools Importing and Exporting PI Lines A set of named PI lines can be saved to an external device and imported or exported via the import/export (I/O) tab To import or export a set of PI lines do the following. To export PI lines: 1. -
Page 154: Clearing Lines
Navigation Tools Radar/Chart Radar User Guide Clearing Lines Clearing lines are bearing lines or range lines used to approximate a position where a danger to own ship lies. The clearing line bearing or range value is used to navigate around the dangerous area such that the mariner would want ownship to remain no less than or no greater than the range or bearing of the... - Page 155 Radar/Chart Radar User Guide Navigation Tools In the figure below the mariner would want to keep the ship's range to be not more than 1.0 nautical miles to stay in safe water. To create clearing lines, do the following: To create clearing lines, either click the Add Bearing button or the Add Range button in the Cursor Options area.
- Page 156 Navigation Tools Radar/Chart Radar User Guide 2. To define a specific Lat/Lon position click in the Origin fields, the current Lat/Lon values change to green (editable) and a drop down keypad appears. There are a number of ways of defining the origin's Lat/Lon position.
- Page 157 Radar/Chart Radar User Guide Navigation Tools 1. Click in the Brg field, the current bearing value changes to green (editable). Move the trackball left or right to decrease or increase the value, left click to accept and exit edit mode. 2.
- Page 158 Navigation Tools Radar/Chart Radar User Guide To change the NMT or NLT value click the respective radio button, the abbreviation below the line will change to reflect the selection. A description of a Clearing Line set and a label for each clearing line may be entered: 1.
- Page 159 Radar/Chart Radar User Guide Navigation Tools 2. Add the type of clearing line to auto join by clicking the Add Bearing or Add Range button, the selected button is highlighted, in addition to the Auto Join button. 3. Create a clearing line on the chart display as described previously. 4.
- Page 160 Navigation Tools Radar/Chart Radar User Guide 3. To open a saved set of clearing lines click the Open button. An Action Required popup window appears listing the previously saved clearing lines sets. 4. Select a set from the list to open and click the OK button.
-
Page 161: Monitoring Clearing Lines
Radar/Chart Radar User Guide Navigation Tools Monitoring Clearing Lines A saved set of clearing lines may be loaded for monitoring. To monitor a set of clearing lines: 1. Click the Monitor tab on the Clearing Lines sub menu. The window lists the saved sets available for monitoring. -
Page 162: Import/Export Clearing Lines
Navigation Tools Radar/Chart Radar User Guide Import/Export Clearing Lines A set of named clearing lines can be saved to an external device and imported or exported via the import/export (I/O) tab. To import or export a set of Clearing Lines, do the following: To export one or more sets of clearing lines: 1. - Page 163 Radar/Chart Radar User Guide Navigation Tools 4. Select the required action and either click the Apply To Selected button to a selected set, or to apply the action to all imported sets, click the Save button. 5. When an import action is selected the file (or files) are imported and a temporary prompt appears confirming the import and folder name.
-
Page 164: Mapping Features
Navigation Tools Radar/Chart Radar User Guide Mapping Features Mapping The Mapping facility includes the ability to display, edit, group or import/export mapping object symbols from a database library anywhere within the video circle. Mapping objects are displayed in either Standby or Transmit mode. -
Page 165: Maps
Radar/Chart Radar User Guide Navigation Tools Maps The Maps tab folder displays all the object maps created on the workstation. If no maps have been created then the window is blank. The folder includes the options to name and add a new map, and delete or rename a previously created map. - Page 166 Navigation Tools Radar/Chart Radar User Guide To rename a selected map do the following: 1. Highlight the map to be renamed from the Maps list. 2. Click in the Map Name: field, the screen keypad appears. 3. Enter a new name for the map using the keypad, when a name has been entered click the OK button, the keypad disappears from the screen.
-
Page 167: Editing Maps
Radar/Chart Radar User Guide Navigation Tools Editing Maps All the creating, editing and deleting functions of Radar Maps are done in the Edit tab folder. Create Radar Maps All mapping objects are created by clicking on the Create Radar Maps button. When the Create Radar Maps button is clicked a Radar Map Creation window appears. - Page 168 Navigation Tools Radar/Chart Radar User Guide Creating Geo Shapes Geo shapes include a number of geometric objects such as arcs, circles, lines, squares etc. that may be created. To create a geo shape and specify its parameters, do the following: 1.
- Page 169 Radar/Chart Radar User Guide Navigation Tools Creating Beacons, Buoys and Danger Points The creation of beacons, buoys and danger point symbols is the same procedure. To create beacons, buoys and danger points, do the following: 1. Select the mapping type (Beacons, Buoys or Danger Points) from the Type drop down list.
- Page 170 Navigation Tools Radar/Chart Radar User Guide Creating Mapping Lines and Areas In the creation of line and area objects you must specify the multiple geographic positions that form the line or area. To create a line or area do the following: 1.
- Page 171 Radar/Chart Radar User Guide Navigation Tools 8. The line segment type defaults to Rhumb Line. To change the line type to Great Circle click on the drop down arrow and select from the list. 9. To exit the Create Radar Maps mode click the Done button, the symbols created are fixed in position and the view returns to the Edit folder.
-
Page 172: Viewing And Editing Radar Maps
Navigation Tools Radar/Chart Radar User Guide 7. The display label for tidal streams denotes the approximate speed of the tide in kilometres, with a range from 0 to 498 kn. To enter a value click in the Display Label field and move the trackball left or right until the required speed is shown. - Page 173 Radar/Chart Radar User Guide Navigation Tools The Left Click Action drop down list allows other types of edit actions to be made for the selected line or area object. Changing the selection in this drop down list modifies the behaviour of subsequent left clicks inside the video circle.
- Page 174 Navigation Tools Radar/Chart Radar User Guide To view or edit a line or area object from the video circle do the following: The following editing actions are available by right clicking on the line or area in the video circle. ...
-
Page 175: Deleting Radar Maps
Radar/Chart Radar User Guide Navigation Tools Deleting Radar Maps You can delete previously created mapping objects, either from the Radar Map Deletion folder, or directly from the video circle, by right clicking on the object. To delete a mapping object from the Radar Map Deletion folder do the following: 1. -
Page 176: Maps Display Settings
Navigation Tools Radar/Chart Radar User Guide Maps Display Settings The Display tab folder lists all available maps and object types. If no maps have been generated then the Displayed Maps window shows <Default Map> only. From the Display folder you can also apply an offset to a specified location for all the radar maps in the video circle. -
Page 177: Importing And Exporting Objects
Radar/Chart Radar User Guide Navigation Tools Importing and Exporting Objects The I/O (Import/Export) tab folder enables you to import or export radar map objects. Mapping objects not currently on a workstation can be imported from an external drive, such as a USB memory stick. Mapping objects that have been produced on a workstation can be exported to other workstations via the external drive. -
Page 178: Exporting Objects
Navigation Tools Radar/Chart Radar User Guide Exporting Objects To export objects do the following: 1. Select the external drive to export the objects to. 2. Click on the drop arrow in the Export field, the export options available are: All Objects - all mapping objects on your workstation. -
Page 179: Line Of Position
Radar/Chart Radar User Guide Navigation Tools Line of Position The geographic location of own ship can be determined by using Lines of Position (LOP), which are created by taking bearings and/or radar measurements from own ship to suitable objects. Visual bearings taken on fixed aids to navigation or landmarks such as smokestacks or towers are typically used for bearing LOPs, while the distance to a distinct shoreline or point of land measured by radar may be used for a range LOP. - Page 180 Navigation Tools Radar/Chart Radar User Guide The location, or selected object, is highlighted with a red circle symbol, and a red shaded background colour inside the circle. The circle symbol represents the active point used as a bearing object for calculating the LOP fix. 4.
-
Page 181: Lop Fixes
Radar/Chart Radar User Guide Navigation Tools LOP Fixes When two or more LOPs are drawn and intersect, a temporary position fix is created. A LOP temporary fix symbol is drawn at the intersection point to indicate the position of the fix. When three or more LOPs are created with no intersection point, the temporary position fix is drawn at a calculated position, defined as the... - Page 182 Navigation Tools Radar/Chart Radar User Guide A minimum of three LOPs are required for a Visual, Range, or Composite type fix. Only two LOPs are required for an EP Fix. The table below gives a description of each LOP fix label. Label Description Position was obtained using two points.
-
Page 183: Editing Lops
Radar/Chart Radar User Guide Navigation Tools Editing LOPs To edit LOPs, do the following: When one or more LOPs are created, the list of LOPs is displayed in the Line Of Position window. The time displayed with each LOP is the system time that the LOP was created. -
Page 184: Using A Lop Position Sensor
Navigation Tools Radar/Chart Radar User Guide 7. To accept a position fix, click the Accept Fix button. A permanent fix symbol is created, see the LOP Fixes section below. 8. To delete all LOPs from the system click the Clear button. All LOPs are removed from the display and the Line Of Position window. -
Page 185: Ownship History
Radar/Chart Radar User Guide Navigation Tools Ownship History Ownship history tracks are a series of lines indicating the past locations of ownship as defined by position sources. There are two types of history track: Primary - a line indicating the past location of ownship as defined by the configured position sensor (usually GPS). -
Page 186: Secondary History Tracks
Navigation Tools Radar/Chart Radar User Guide Secondary History Tracks Secondary history tracks include other available position sensor data sources as defined in the Position Sensor, these may include the following: dead reckoned sensor. LOP Sensor manual position sensor To select a position source for a secondary history track tick the sensor source check box. -
Page 187: Event Marks
Radar/Chart Radar User Guide Navigation Tools 4. When the required time value is shown, click OK to complete. Position Spacing The spacing of positions controls the gap between the past position dots. The minimum is 1 minute and the maximum is 120 minutes. To change the position spacing click in the Desired field and when the current value changes to green move the trackball to increase or decrease the value, click again to accept the selected time. -
Page 188: Parallel Cursor
Navigation Tools Radar/Chart Radar User Guide Parallel Cursor The Parallel Cursor facility enables a rotating parallel cursor centred on own ship's CCRP to be displayed. The parallel cursor graphics consist of two dashed orthogonal lines (axes) extending to the edge of the video circle with their axis crossing point at CCRP, the end points of each line are marked with a semi-circular marker at the edge of the video circle. - Page 189 Radar/Chart Radar User Guide Navigation Tools 4. From the Bearing Type drop down arrow select between Relative and True. When True is selected the parallel cursor is azimuth stabilised (i.e. maintains a constant orientation with respect to north). When Relative is selected the parallel cursor is unstabilised (i.e.
-
Page 190: Display Settings Features
Navigation Tools Radar/Chart Radar User Guide Display Settings Features Display Settings The Display Settings menu includes the following tab folders: Ownship EBL (if configured) Grid Ownship The Ownship tab folder enables the display of synthetics data for own ship to be controlled. The folder includes the following options: ... - Page 191 Radar/Chart Radar User Guide Navigation Tools Beam Line Length The length of the beam line defaults to 10mm, this is the minimum length the line extends each side of own ship's CCRP. To lengthen the beam line left click in the Beam Line Length field, the value figure changes to green (editable).
- Page 192 Navigation Tools Radar/Chart Radar User Guide Antenna Position The antenna position may be displayed when own ship is in true scale only. The antenna position is shown as a pair of small crossed lines, between 1mm and 2mm long, centred at the location on the display corresponding to the position of the radar antenna.
- Page 193 Radar/Chart Radar User Guide Navigation Tools Predicted Vector The Predicted vector tool is used to indicate where own ship will go based on current speed, course, and rate of turn. Predicted vector is NOT intended to access risk of collision. Predicted vector is a vector arc drawn from own ship's CCRP with a radius based on the selected Rate of Turn sensor and the current ground...
- Page 194 Navigation Tools Radar/Chart Radar User Guide Predicted ship will be displayed regardless of whether the display setting is in predicted vector, predicted path or COG vector. When predicted vector is enabled the location of each predicted ship CCRP is shown as a small dot on the vector line.
-
Page 195: Next Turn Ebl
Radar/Chart Radar User Guide Navigation Tools Next Turn EBL The system supports the input of a Next Turn EBL sentence that transfers data from a VMS, this data can then be represented graphically on screen. In order to display Next Turn EBL graphics an input must have been previously configured. -
Page 196: Grid
Navigation Tools Radar/Chart Radar User Guide Grid A latitude/longitude (LAT/LON) grid can be displayed on the chart window. The LAT/LON grid values are taken from the latest valid position of own ship’s CCRP, as reported by the Position sensor. The LAT/LON grid is only displayed when the presentation mode is N-UP. The grid is removed from the display if the presentation mode is changed to H-UP or C-UP. -
Page 197: Anchoring
Radar/Chart Radar User Guide Navigation Tools Anchoring Anchoring Description The Anchoring feature allows the operator to plan an anchorage, monitor the anchoring status, control the display of the anchorage parameters, and monitor the anchor drag after the ship is anchored. The Anchoring function may be in Anchor Watch (anchor dropped), or Anchor Approach. -
Page 198: Anchoring Planning
Navigation Tools Radar/Chart Radar User Guide Anchoring Planning The Anchoring Planning tab enables a precise anchorage location to be entered. The operator should enter a head bearing to steer for anchorage, and may also plan a single drop bearing object, and/or a single drop range object. Precision Anchoring An anchor position may be selected, by entering Lat/Long coordinate values or by selecting a... - Page 199 Radar/Chart Radar User Guide Navigation Tools Anchor Track Anchor Track enables a true head bearing to the anchor point to be entered or selected on the chart display out to a distance of 5000 yards. The head bearing value is displayed on the chart at the start of the head bearing line. The head bearing is the planned course to steer as the ship approaches anchorage.
- Page 200 Navigation Tools Radar/Chart Radar User Guide Drop Bearing Object A Drop Bearing object (DBO) is an object that can be observed at a planned bearing when ownship is correctly positioned to drop anchor. A DBO can be manually selected by specifying its Lat/Long coordinates, or by clicking the On Chart button, positioning the cursor over the object and left clicking.
- Page 201 Radar/Chart Radar User Guide Navigation Tools Anchor Depth The Anchor Depth is the water depth value at the Anchor Point. The depth at the anchor point may be retrieved from the chart soundings, when switched on in Chart Settings. An anchor depth of between 1 and 100 metres may be entered when the chain scope is set any value other than None.
-
Page 202: Display
Navigation Tools Radar/Chart Radar User Guide Drag Radius The Drag Radius is used as a boundary where, if violated, triggers an alert indicating that the anchor drag limit has been exceeded. The drag circle radius is automatically calculated as equal to the chain length plus the distance from the hawsepipe to the CCRP. - Page 203 Radar/Chart Radar User Guide Navigation Tools The following display options only apply when in anchor approach display: Drop Bearing Object - a drop bearing object is an object that can be observed at a planned bearing when ownship is correctly positioned to drop anchor.
-
Page 204: Status
Navigation Tools Radar/Chart Radar User Guide Status The Status tab enables you to monitor the anchor drag after the ship is anchored. All values in the Status tab are read-only, generated from values entered at Planning. Anchor Watch Mode Click the Drop Anchor button to switch to Anchor Watch mode, the anchor drop display is drawn, set to ownship hawsepipe position. - Page 205 Radar/Chart Radar User Guide Navigation Tools Anchorage The Anchorage area displays the following read-only data: Latitude/Longitude - Lat/Long of planned anchorage Range - ships range to anchorage TTG - estimated remaining time to anchorage Anchor Brg - hawsepipe's true bearing to planned anchorage (click the bearing button to toggle between True and Relative).
-
Page 206: Man Overboard
Navigation Tools Radar/Chart Radar User Guide Man Overboard The Man Overboard (MOB) function enables management of a MOB emergency. When MOB is active, a symbol is displayed on the chart display representing `Oscar' – the person in the water. A MOB operation may be immediately activated by clicking on the top-level MOB (Oscar) button, situated below the Safety check icon. - Page 207 Radar/Chart Radar User Guide Navigation Tools When a MOB event has been activated, the Man Overboard window displays the following read- only data: Bearing (R) - the relative bearing from CCRP to Oscar. Bearing (T) - the true bearing from CCRP to Oscar.
- Page 208 Navigation Tools Radar/Chart Radar User Guide The Manual Edit function can also be used to enter range and bearing data, or select a position on the chart, but this should only be done if a visual sighting allows the operator to improve the accuracy of the indicated Oscar location.
- Page 209 Radar/Chart Radar User Guide Navigation Tools 3. If the MOB event was not started using the top-level button the Start button at the bottom of the window will be active and must be pressed to start the event. To turn off the MOB event, click on the Cancel Oscar button. An Action Required window appears prompting to confirm cancellation of the MOB Event, click the Yes button to confirm.
-
Page 210: Navigation Marks
Navigation Tools Radar/Chart Radar User Guide Navigation Marks Navigation marks (Nav Marks) are generated by the operator to indicate positions of interest. The Nav Mark is displayed as an orange information note symbol in a square box. When a Nav Mark is created and viewed in Chart mode a vertical orange line with a dot at the end is displayed below the symbol box. - Page 211 Radar/Chart Radar User Guide Navigation Tools For further information on Chart Query see Query Results and Query Options in Chapter 12, Charts. To delete a Nav Mark do the following: 1. Right click on the Nav Mark, a semi- transparent window appears at the position selected.
-
Page 213: Chapter 7 Alerts
Radar/Chart Radar User Guide Alerts Chapter 7 Alerts The alert management system generates alerts related to displayed information or equipment malfunction. In addition, prompts (permanent and/or temporary) are raised to communicate information that does not necessarily require operator action. The Alerts menu includes a Mute Settings facility, which enables the operator to either change the length of time the alert buzzer is temporarily muted, or mute the alert buzzer for an unlimited period of time. -
Page 214: Prompts
Alert Sources There are two types of alert sources: internal and external. Internal alerts are generated by the VisionMaster FT. External alerts are those relayed to the Central Alert Management (CAM) by external sources. Internal alerts are displayed and acknowledged through the display menu, see Alert Display. -
Page 215: Alert Status Indicator
Radar/Chart Radar User Guide Alerts Alert Status Indicator The Alert Status Indicator displays the current alert status of the system. The display of alerts is prioritised; with active alarms first, followed by warnings and then cautions. The Alert Status Indicator's background colour is based on the state and status of active alerts in the system. -
Page 216: Alert Status
Alerts Radar/Chart Radar User Guide Alert Status There are three types of alert status: Unacknowledged Alerts When an alert is detected, that alert appears with a flashing background colour in the Alert Status Indicator and the Alert display. If more than one alert condition exists, the alert with the highest priority is shown. -
Page 217: Alert Display
Radar/Chart Radar User Guide Alerts Alert Display To view a list of all the currently active alerts, including alerts acknowledged on the status indicator, click on the Alerts in the menu list, or right click on the Alert Status Indicator. The Alerts window shows the current alert state and provides a description and a means of acknowledging alerts. -
Page 218: Viewing Alert Details
Alerts Radar/Chart Radar User Guide Viewing Alert Details To view more information on a particular alert right click on the text. Details of the alert, including activation date, time and description are shown below the list. Hide Acknowledged To hide acknowledged alerts tick the Hide Acknowledged check box. -
Page 219: Alert Buzzer
Radar/Chart Radar User Guide Alerts Alert Buzzer An alert buzzer is physically located in the LCD monitor. The buzzer is connected to one of the following types of discrete outputs to the LCD monitor: PCIO Basic Control Panel ... -
Page 220: Alerts On A Multi-Node System
The table on page 7-31 `Client/Server Radar Alerts’ lists the alerts that are generated due to failure conditions specific to a CSR . Some alerts listed in this table are replicated on standard VisionMaster FT systems (see List of Alarms, Warnings and Cautions) however the possible causes of the alerts will be different and are described in the table. -
Page 221: Alert Behaviour Specific To Radar
Radar/Chart Radar User Guide Alerts Alert Behaviour specific to Radar Alert management behaves slightly differently, dependent on whether your VMFT is an exclusively ECDIS system or a Radar/Chart Radar system The following describes the alert behaviour for primary sensors on a Radar/Chart Radar system (for a list of primary sensors applicable to a radar system refer to `Primary Sensors on Radar Systems’... -
Page 222: Prompts
Alerts Radar/Chart Radar User Guide Prompts Prompts appear in the field directly underneath the Alert Status Indicator and can be either temporary or permanent. Permanent prompts Permanent prompts denote a state or mode of operation, provide instruction to the operator, or may display settings. Under normal operation the permanent prompt field displays the current system date and time in either UTC or Local (see Time Management) when there are no other permanent prompts to display. -
Page 223: Mute Settings
Radar/Chart Radar User Guide Alerts Mute Settings The Mute Settings sub menu enables the operator to adjust the length of time, in minutes, that the alert buzzer is temporarily muted. It also enables the operator to mute the buzzer for an unlimited period of time. To change the mute settings do the following: 1. -
Page 224: Central Alert Management
Radar/Chart Radar User Guide Central Alert Management If your VisionMaster FT (VMFT) is configured as a Total Watch, the option for a node to be selected as a Central Alert Management (CAM) is available. In this role, alerts from the bridge and other equipment are sent to the VMFT internal alert system. -
Page 225: Picture Freeze
Prompts. If the VisionMaster FT includes a PCIO, an alert beep will sound denoting an internal error, in addition to the prompt freeze. If the system returns to normal operation then the prompt field will continue to cycle between prompts and system time, but an internal error alert will be generated. -
Page 226: List Of Alarms, Warnings And Cautions
Alert Behaviour Specific to Radar. Alerts raised on a Client/Server Radar (CSR) system may have different sets of failure causes from a standard VisionMaster FT. For a list of CSR alerts see pages 7-31 to 7-32. Consistent Common Reference System (CCRS) data includes the various types of data that describe the state of the ship, and which are usually received via sensors. - Page 227 Radar/Chart Radar User Guide Alerts Alarm Description Owner Backup Navigator Description text set at runtime. System (Emergency Alarm) Communication with the AIS unit has failed. AIS targets are not AIS Communication Failed Targets available. AIS Interface Error No AIS messages received Targets Possible anchor drag detected.
- Page 228 Alerts Radar/Chart Radar User Guide Alarm Description Owner Config File Modified Config File Modified System Control Panel Comms Communication with the control panel has failed. System Course Criteria Violated A traffic monitored target violated course criteria for a zone Targets Course Difference Difference limit between heading and route bearing exceeded.
- Page 229 Radar/Chart Radar User Guide Alerts Alarm Description Owner Interswitch Comms The interswitch communications has failed Radar Interswitch Model Conflict The interswitch model conflicts with the configured model Radar Invalid Datum In Use Datum in use is not WGS84. Charts Lost Connection Lost connection to Distribution Service System Lost Echo Reference...
- Page 230 Alerts Radar/Chart Radar User Guide Alarm Description Owner Sonar Communication Error Communications with the sonar system has failed Sonar Sonar Returns Detected Sonar return detected within safety region and above safety depth Sonar Sonar System Error The sonar system has reported an error Sonar Target Anchor Drift Target out of the anchor watch limit circle.
- Page 231 Radar/Chart Radar User Guide Alerts Warning Description Owner 3D Chart Suppressed 3D Chart not supported for this region Display Active AIS Full Activated AIS Target Limit Reached (max 40) Targets Actual Speed Value Error Actual Speed value is above the threshold value Actual Fuel usage Value Actual Fuel usage value is above the threshold value Error...
- Page 232 Alerts Radar/Chart Radar User Guide Warning Description Owner AZ Full Acquisition Zone Full Targets The number of azimuths per revolution has varied from its nominal value of Azimuth Error Radar 4096 Bypassed Critical Point(s) One or more critical points have been bypassed by temp route. Routes No chart displayed at the ship's position, but a chart is available for the ship's Chart Available...
- Page 233 Radar/Chart Radar User Guide Alerts Warning Description Owner The node(s) listed are switched off or not connected to the network. Any changes made while nodes are not connected will result in their data being Database Node Missing overwritten with the current database when they reconnect. This potentially System affects Routes, PI Lines, GoTo locations, Radar maps, and Manual chart updates.
- Page 234 Alerts Radar/Chart Radar User Guide Warning Description Owner External Route Degraded/ External route data from the selected source is degraded. Routes Unusable Heading Joystick Interface An interface to the heading joystick has failed Autopilot Failure Heading Marker Error A heading marker has not been received for at least 10 seconds Radar Interswitch Request Failed The Interswitch has failed to respond to a request.
- Page 235 Radar/Chart Radar User Guide Alerts Warning Description Owner Bad Data: The LCD monitor failed to acknowledge a command. Use the Monitor Data Display external knob to manually adjust backlight brightness. Multiple Interfaces On SCU A switched SCU is communicating over multiple interfaces Autopilot Man Over Board is active with no valid set and drift data.
- Page 236 Alerts Radar/Chart Radar User Guide Warning Description Owner The autopilot has transferred steering control to this system. Control of the Steering Control Received heading command and the ability to activate track control is available at one or Autopilot more stations. This system has relinquished steering control.
- Page 237 Radar/Chart Radar User Guide Alerts Warning Description Owner Turning Unit speed not Optimal operation with turning unit speed faster than {0} RPM requires a Radar optimal hardware update of the scan converter card Video Failed Radar video cannot be displayed. Radar The system will not provide messages to indicate planned course changes because 'Wheelover Notifications' is switched off on the 'Monitor Route' menu.
- Page 238 Alerts Radar/Chart Radar User Guide Caution Description Owner Absolute Humidity Sensor Absolute Humidity Integrity Sensors Degraded/Unusable Aggregated Generic Data Sensor Aggregated Generic Data Integrity Sensors Degraded/Unusable Active AIS Almost Full Activated AIS Target Limit Almost Reached (95%) Targets AIS Almost Full AIS Target Limit Almost Reached (95%) Targets Aggregated Generic Data...
- Page 239 Radar/Chart Radar User Guide Alerts Caution Description Owner Engine RPM Degraded/Unusable Sensor Engine RPM Integrity Sensors Engine Speed Degraded/Unusable Sensor Engine Speed Integrity Sensors Engine Thrust Value Sensor Engine Thrust Value Integrity Sensors Degraded/Unusable Engine Torque Value Sensor Engine Torque Value Integrity Sensors Degraded/Unusable Engine Total Revolutions...
- Page 240 Alerts Radar/Chart Radar User Guide Caution Description Owner Generic Data with Units Sensor Generic Data with Units Integrity Sensors Degraded/Unusable Magnetic Course Over Ground Sensor Magnetic Course Over Ground Integrity Sensors Degraded/Unusable Magnetic Deviation Sensor Magnetic Deviation Integrity Sensors Degraded/Unusable Magnetic Set and Drift Sensor Magnetic Set and Drift Integrity Sensors...
- Page 241 Radar/Chart Radar User Guide Alerts Caution Description Owner Propulsion Equipment Data Sensor Propulsion Equipment Data Integrity Sensors Degraded/Unusable Rate of Turn Degraded/Unusable Sensor Rate of Turn Integrity Sensors Relative Humidity Sensor Relative Humidity Integrity Sensors Degraded/Unusable Relative Wind With Relative Sensor Relative Wind With Relative Direction Integrity Sensors Direction Degraded/Unusable...
- Page 242 Alerts Radar/Chart Radar User Guide Caution Description Owner Ship Total Power Sensor Ship Total Power Integrity Sensors Degraded/Unusable Ship Total Propulsion Power Sensor Ship Total Propulsion Power Integrity Sensors Degraded/Unusable Specific Fuel Rate Corrected Sensor Specific Fuel Rate Corrected Integrity Sensors Degraded/Unusable Specific Fuel Rate Observed...
- Page 243 Radar/Chart Radar User Guide Alerts Client/Server Radar Alerts Alarm Description Possible Causes 1. Client/Server channel connection unavailable. The communications from the Transceiver Comms 2. Server to PCIO cable disconnection. selected transceiver have failed 3. Server to Transceiver comms disconnection. The PCIO USB communications PCIO USB Comms Server to PCIO USB cable disconnection.
- Page 244 Alerts Radar/Chart Radar User Guide Warning Description Possible Causes 1. Client/Server channel connection unavailable. A heading marker has not been Heading Marker Error 2. Server to PCIO cable disconnection. received for at least 10 seconds 3. Server to Transceiver comms disconnection. A Client node has unsuccessfully attempted to change a Client/Transceiver connection at the Interswitch menu.
-
Page 245: Chapter 8 Routes
Radar/Chart Radar User Guide Routes Chapter 8 Routes This section describes route editing, monitoring, display and storage. The following topics are covered. A description of Routes. Creating and editing routes graphically on screen, see Creating a Route. Editing a route from a menu, see Edit Route. - Page 246 Routes Radar/Chart Radar User Guide File Import / Export Route Display Settings The Routes sub menu list will also include External Route, depending on system configuration. Refer to Chapter 1 `Configuration' in Volume 2 of the VisionMaster Ship's Manual. To view abbreviated data on the currently monitored route left click on the Routes tab in the lower right of the screen, see Monitoring a Route Plan.
-
Page 247: Routes
There are three types of routes: Internal Routes - An internal route can be created and saved at a single VisionMaster FT console, or it may have been created on another ship’s VisionMaster FT system and copied using the file Import/Export function. -
Page 248: Multi-Node Support
Routes Radar/Chart Radar User Guide It is advisable that routes created by the operator should be backed up to an external device (usually a USB memory stick). This is done from the File Import/Export window. Multi-node Support On a multi-node system internal routes are saved and retrieved from a database Routes saved to the database can also be loaded for monitoring from any node on the network;... -
Page 249: Creating A Route
Radar/Chart Radar User Guide Routes Creating a Route To create waypoints, you must first select Edit Route, by selecting the Routes menu. When Edit Route is selected waypoints can be created anywhere within the video circle. Adding a Waypoint There are two screen options initially available when adding waypoints: ... - Page 250 Routes Radar/Chart Radar User Guide Add Waypoint Add Waypoint is selected where the insertion of a new waypoint is to be made after the last waypoint, e.g. if the last waypoint on the route was W5 then the appended waypoint will be W6. To add a waypoint to a route, do the following: 1.
-
Page 251: Changing A Waypoint's Position
Radar/Chart Radar User Guide Routes Inserting a Waypoint A new waypoint can be inserted at a selected point along the straight segments of a route leg. A wheel-over line is automatically created with the waypoint. To insert a new waypoint, do the following: Right click on the route leg where you want to insert a waypoint and select Insert New Waypoint from the semi-transparent window. -
Page 252: Delete A Waypoint
Routes Radar/Chart Radar User Guide To numerically specify an exact LAT/LON position for the waypoint refer to Editing a Route Plan. Delete a Waypoint A waypoint's position can be deleted either directly on screen, or in the Waypoints tab folder, see Edit Route. To delete a waypoint from a route, do the following: 1. -
Page 253: Editing A Route
Route tab. The Dangers tab will only appear if Safety Checking has been selected in the system configuration. Refer to Chapter 1 `Configuration' in Volume 2 of the VisionMaster FT Ship's Manual. 65900010... -
Page 254: Route Tab Folder
Routes Radar/Chart Radar User Guide Route Tab Folder Routes are managed from the Route tab folder of the Edit Route sub-menu. The folder is divided into the following areas: Route Total Distance and Duration XTD Alarm Limit ... - Page 255 Radar/Chart Radar User Guide Routes Editor Table - enables the operator to edit all waypoint and leg attributes for the edited route via a separate movable window, see Route Editor Table. Print - if a printer is connected to the system (either local or network) a print of the currently loaded route can be made.
- Page 256 Routes Radar/Chart Radar User Guide To open a previously saved route: 1. Click on the Open button. The Open Route window appears prompting to select a route to open and displaying a list of existing routes on the workstation with the last modified date of each route.
- Page 257 Radar/Chart Radar User Guide Routes To reverse a route do the following: 1. Open the saved route you wish to reverse from the routes database. 2. Click the Reverse button. 3. If you have made changes in the existing route an Action Required message appears stating that the unsaved changes to the existing route will be lost if you proceed.
- Page 258 Routes Radar/Chart Radar User Guide To change the ETD/ETA data do the following: 1. Click inside the ETD or ETA field on the specific data to be changed. The field data changes to green (editable) and the specific data is highlighted. An editing window appears directly below the selected field.
-
Page 259: Waypoints Tab Folder
Radar/Chart Radar User Guide Routes Description and Notes To add a description of the route or create notes do the following: 1. Move the cursor inside the respective field and left click. A screen keypad appears from where you can enter text. 2. - Page 260 Routes Radar/Chart Radar User Guide To edit the Waypoint data do the following: The Waypoint area displays the waypoint currently selected (e.g. W3). To < select the previous waypoint in the route plan click the button, to select > the next waypoint in the route plan click the button.
- Page 261 Radar/Chart Radar User Guide Routes To specify a waypoint Lat/Lon position: 1. Select the waypoint by using the Waypoint navigation buttons. 2. To centre the display on the selected waypoint click the Goto button. 3. To change the Lat/Lon position of the waypoint click in the Lat/Lon data fields, the text becomes editable (green) and a drop down keypad appears.
- Page 262 Routes Radar/Chart Radar User Guide Approaching Leg The Approaching Leg area enables you to edit the following attributes of the leg approaching the selected waypoint: Rhumb Line or Great Circle Leg Speed - estimate average speed for the route leg (maximum speed 99 Kn.) ...
- Page 263 Radar/Chart Radar User Guide Routes Turn The Turn area enables you to edit the following turn attributes: Turn Rate - the maximum turn rate is 1200°/minute. Turn Radius - the maximum turn radius is 10 NM. Speed - speed of turn, the maximum speed is 99 Kn ...
- Page 264 Routes Radar/Chart Radar User Guide Departing Leg The Departing Leg area enables you to edit the following attributes of the leg of the route, which departs from the selected waypoint: Rhumb Line or Great Circle Leg Speed - estimated average speed for the route leg. The maximum speed is 99 Kn.
-
Page 265: Dangers
Radar/Chart Radar User Guide Routes Dangers The Dangers tab folder enables the operator to view objects and areas that could endanger the safety of own ship on the edited route. When a route is opened for editing or monitoring the system continually searches the chart database and mariner objects database for objects and areas that intersect the route plan safety region. - Page 266 Routes Radar/Chart Radar User Guide 4. To navigate to the next danger in the list click the arrow. To move up the list click the arrow. As each danger is highlighted it is shown on the video circle. 5. To view cautions on the route repeat the procedure above. Display Safety Regions The Dangers tab folder also includes the option of displaying the route safety region.
-
Page 267: Critical Points
Radar/Chart Radar User Guide Routes Critical Points The Critical Points tab folder enables the operator to create specific LAT/LON positions on a route which are defined as critical points. An alarm or warning alert is generated when own ship is in the proximity of each critical point on the route (the alert can be triggered by either a specified distance or time). - Page 268 Routes Radar/Chart Radar User Guide 3. To change a CP label from the default CP1, CP2 etc. select the CP and click in the field to the right of the label, the screen keypad appears. Enter a label name using the keypad and click the keypad OK button.
- Page 269 Radar/Chart Radar User Guide Routes To delete a critical point do the following: 1. In the Critical Points window navigate to the CP to be deleted using the navigation buttons and click on the Delete button. The CP is removed from the screen and list. 1.
-
Page 270: Editor Table
Routes Radar/Chart Radar User Guide Editor Table The route editor table enables the operator to edit aspects of a route that has been opened from the Edit Route folder and is displayed on screen. The Route Editor table is only available when the system is in Standby. Click on the Editor Table button in the Route tab of the Edit Route sub menu to open the route editor table. - Page 271 Radar/Chart Radar User Guide Routes If changes to the route result in validation errors the No Error button changes to displaying Errors with a yellow background and the route name shown in an invalid colour (orange). Click on the button to open a popup window that lists the validation errors, for more information see Waypoints Tab Folder.
- Page 272 Routes Radar/Chart Radar User Guide Leg Data on Route Editor Table The following leg data can be edited on the route editor table: Speed - planned ground speed of ownship along route leg. Min Speed – the minimum planned ground speed of own ship along route leg.
- Page 273 Radar/Chart Radar User Guide Routes appears with a list of objects in the immediate area (see Chart Query). Select the object from the list, the waypoint is repositioned over the chart object and a red circle filled with a red shaded background is drawn around the waypoint. iii.
-
Page 274: Monitoring A Route
Routes Radar/Chart Radar User Guide Monitoring a Route Monitor Route The Monitor Route window enables you to monitor all aspects of a route against own ship's course. The monitored route must be initially saved and validated in the Edit Route sub menu. The Monitor Route window contains the following tab folders: Route - displays read only data monitoring own ship's progress ... -
Page 275: Route
Radar/Chart Radar User Guide Routes Route The data shown in the Route tab folder is calculated internally from the monitored route and is read-only. A summary of the active leg of the monitored route is also shown on the Route tab in the lower right area of the screen. - Page 276 Routes Radar/Chart Radar User Guide Route Summary The name of the route currently monitored. Name Ship State The state of ship on route e.g. 'Sailing To W2 (2/5)' Ship State denotes next waypoint on route and total number of waypoints.
- Page 277 Radar/Chart Radar User Guide Routes Overall Distance & Distance and time to go to the Time To Go end of the route using distance along legs with own ship SOG for this leg and planned speeds for future legs. ...
- Page 278 Routes Radar/Chart Radar User Guide Settings Wheelover Alerts will be displayed in Notifications monitoring mode when the check box is ticked. Note that wheelover points are all bow referenced, NOT referenced to the CCRP. If an alert is not acknowledged after a period of 30 seconds the Alert is then escalated to an Alarm.
- Page 279 Radar/Chart Radar User Guide Routes To clear a route: 1. With the route details shown in Monitor Route, click on the Clear Route button. The route and its data are removed from the screen and Monitor Route tab folder. Editing a currently monitored Route When a route is being monitored the route is rendered in the non-editable monitor colour (red).
-
Page 280: Dangers
Routes Radar/Chart Radar User Guide Dangers The Dangers tab folder enables the operator to view objects and areas that could endanger the safety of own ship on the currently monitored route. WARNING! TEMPORARY ROUTES ARE NOT SEPARATELY SAFETY CHECKED. THE OPERATOR MUST RELY ON OWN SHIP SAFETY REGION FOR DETECTING DANGERS WHILE OWN SHIP IS ON A... -
Page 281: Critical Points
Radar/Chart Radar User Guide Routes Critical Points The Critical Points tab folder enables you to select and view position and alert trigger details on critical points that have been generated in the Critical Points tab folder of the Edit Route menu. -
Page 282: Eta Calculator
Routes Radar/Chart Radar User Guide ETA Calculator The ETA Calculator window enables you to calculate the time, speed and distance between waypoints on a monitored route. With a route loaded for monitoring, click on the ETA Calculator sub menu from the Routes menu. - Page 283 Radar/Chart Radar User Guide Routes To change the ETA Calculator values do the following: 1. To change the Distance or Speed values click in the respective fields, with the value shown as green move the trackball left, to decrease, or right to increase the value. When the distance and speed values are changed the Time and ETA values are automatically updated.
-
Page 284: Route Eta
Routes Radar/Chart Radar User Guide Route ETA The Route ETA (Estimated Time of Arrival) enables the following settings to be changed or selected on a monitored route: Waypoint selection - click on the drop down arrow to select a waypoint on the monitored route. -
Page 285: Required Speed
Radar/Chart Radar User Guide Routes Required Speed Required Speed enables the user to specify a desired arrival time for any selected waypoint on a monitored route. When a desired arrival time is entered the system calculates own ship speed required to the present leg, and speed required for the remaining legs in order to achieve this arrival time. -
Page 286: Speed Planning
Routes Radar/Chart Radar User Guide Speed Planning Speed Planning allows the operator to manually specify a plan for speeds to be used on remaining segments of the monitored route, and see what arrival times result from these plans. It also enables a desired arrival time (for any given waypoint) to be specified, and see recommended adjustments to planned speeds needed to achieve this arrival time. - Page 287 Radar/Chart Radar User Guide Routes Speed Table - shows planned speeds and limits for each leg and turn of the route. Arrival Date/Time (UTC) and Arrival Time To Go - displays arrival times for the various choices of speeds (planned speed, max speed, etc.).
- Page 288 Routes Radar/Chart Radar User Guide The Desired Arrival Date/Time allows the operator to enter the date and time that they wish to arrive at the arrival waypoint. This value is then used to compute the Required Speed . Note that the Desired Arrival Date/Time value only has an effect if Limited Required Speed is selected.
- Page 289 Radar/Chart Radar User Guide Routes Speed Command Setting The Speed Command Setting area allows the operator to select how the speed commands are entered into the plan. It includes two settings: Manual and Limited Required Speed. Manual allows the operator to manually enter a speed command for each leg.
- Page 290 Routes Radar/Chart Radar User Guide To manually enter speed commands for each leg/turn segment: 1. Click in the required field of the Speed Command column for the Leg/Turn, the text changes to green (editable). 2. Move the trackball left to decrease the value, or right to increase. Left click again to exit edit mode.
-
Page 291: Monitoring Speed Planning
Radar/Chart Radar User Guide Routes Monitoring Speed Planning When the required selections have been made to the speed plan click the Begin Monitoring button, the plan is locked and the system begins monitoring based on the speed plan. The following read-only values, configured in the speed planning setup window, are displayed in the Speed Planning window: ... -
Page 292: Temporary Route Plans
Routes Radar/Chart Radar User Guide Temporary Route Plans A temporary route (temp route) can be created and displayed on screen, either independently, or in addition to a currently displayed planned route. The temp route is edited and monitored independently of the planned route via the Temp Route tab folder. -
Page 293: Monitoring A Temporary Route
Radar/Chart Radar User Guide Routes 4. The Overall, Selected Turn or Waypoint DTG default values may be changed by clicking in the relevant fields and moving the trackball left or right to increase or decrease the values. The Wheelover DTG is changed by adjusting the Waypoint DTG. When own ship has passed the wheelover DTG the field changes to displaying Past on a red background. -
Page 294: Transitioning A Temporary Route To A Monitored Route
Routes Radar/Chart Radar User Guide Transitioning a Temporary Route to a Monitored Route A temp route may be used to transition own ship's course to a monitored route. To transition a temp route to a monitored route do the following: 1. -
Page 295: Search And Rescue
Radar/Chart Radar User Guide Routes Search and Rescue Search and Rescue (SAR) patterns are specialized routes that can be used to patrol a given area. The following SAR search patterns are supported (see descriptions and figure below): Parallel Line - formed from a series of parallel legs, moving out from left or right of the initial heading. -
Page 296: Creating Sar Patterns
Routes Radar/Chart Radar User Guide Creating SAR Patterns To create and edit SAR patterns click on Search and Rescue in the Routes menu. The last SAR pattern selected will appear on the video circle and the following default values are applied to each SAR pattern at the time the Search and Rescue menu is displayed: ... - Page 297 Radar/Chart Radar User Guide Routes iii. To move the date or time back click on the Down arrow, to move the date or time forward click on the Up arrow. To move the highlight back or forward (e.g. from Month to Year) click on the side arrows.
- Page 298 Routes Radar/Chart Radar User Guide The following parameter default values apply to each SAR pattern: Parameter Default Pattern Length 5 NM Creeping Line, Parallel Line Width 2 NM Creeping Line, Parallel Line, Expanding Box Separation 1 NM Creeping Line, Parallel Line Expanding Box Sector Width 5 NM...
-
Page 299: External Routes
Radar/Chart Radar User Guide Routes External Routes The VisionMaster FT system can be configured to accept external routes from up to five external sources (for example, a GPS system), providing they are transmitted to the system in an acceptable format. -
Page 300: Multi-Node Support
Routes Radar/Chart Radar User Guide The system is designed to display the “working” portion of the route received from an external source. This means that only a subset of the total number of legs and waypoints in the actual route will be displayed. -
Page 301: Importing And Exporting A Route
Importing and Exporting a Route The Import/Export sub menu enables you to import or export routes that have been created on a VisionMaster FT. Routes not currently on a console can be imported from an external drive (usually a USB memory stick), and existing routes can be exported to an external drive. -
Page 302: Exporting Routes
Routes Radar/Chart Radar User Guide Exporting Routes To export routes do the following: 1. If the external drive where the route(s) are to be exported to is a USB memory stick connect the device to a USB port at the front of the VisionMaster PC. -
Page 303: Route Display Settings
Radar/Chart Radar User Guide Routes Route Display Settings The Route Display Settings sub-menu enables you to select the graphic display of labels associated with the displayed route. The following display settings are available: Display Monitored Route - displays the route currently being monitored, defaults to ticked. -
Page 305: Chapter 9 Electronic Range And Bearing Lines Electronic Range And Bearing Lines (Erbls)
Radar/Chart Radar User Guide Electronic Range and Bearing Lines Chapter 9 Electronic Range and Bearing Lines Electronic Range and Bearing Lines (ERBLs) Two electronic bearing lines (EBLs) and two variable range markers (VRMs) are available in both Standby and Transmit modes and can be displayed simultaneously or separately on the video circle. -
Page 306: Off-Centring, Carrying And Dropping An Erbl
Electronic Range and Bearing Lines Radar/Chart Radar User Guide Off-Centring, Carrying and Dropping an ERBL The default position for EBL1/VRM1 and EBL2/VRM2 is centred on own ship's CCRP. When centred the ERBL can be offset, dropped, or its end point dropped. After being offset, the ERBL is carried at a constant relative bearing and range from the CCRP. -
Page 307: Electronic Bearing Line (Ebl)
Radar/Chart Radar User Guide Electronic Range and Bearing Lines Electronic Bearing Line (EBL) Each EBL can be turned on or off independently. Previous settings are remembered when they are switched off. To turn on an EBL from the ERBL window, do the following: 1. -
Page 308: Changing The Ebl Position
Electronic Range and Bearing Lines Radar/Chart Radar User Guide To change the EBL bearing from the readout: 1. Left click in the readout field. The readout text becomes editable (green). 2. Move the trackball left or right until the required readout is displayed. - Page 309 Radar/Chart Radar User Guide Electronic Range and Bearing Lines 2. When Offset is selected, the EBL is immediately positioned wherever the cursor is on the video circle. Using the trackball, move the EBL to the required offset location. When the EBL is offset, the origin of the EBL is indicated by a white dot.
-
Page 310: Variable Range Marker (Vrm)
Electronic Range and Bearing Lines Radar/Chart Radar User Guide Variable Range Marker (VRM) Each VRM can be turned on or off independently. Previous settings are remembered when they are switched off. The default range value for VRM 1 is 2.5 NM; the default range value for VRM 2 is 4.5 NM. To turn on a VRM do the following: 1. -
Page 311: Changing The Vrm And Ebl Position
Radar/Chart Radar User Guide Electronic Range and Bearing Lines Changing the size of the VRM does not change the EBL bearing. As the VRM size changes the EBL origin remains constant. To change the VRM range from the Control Panel: 1. - Page 312 Electronic Range and Bearing Lines Radar/Chart Radar User Guide 2. When Offset is selected the VRM is immediately positioned wherever the cursor is on the video circle. Using the trackball move the VRM to the required offset location. When the VRM is offset the centre of the VRM is indicated by a white dot.
-
Page 313: Chapter 10 Targets
Radar/Chart Radar User Guide Targets Chapter 10 Targets The Targets facility provides information and management of all targets, including locally tracked targets and AIS targets To open the menu left click on the Targets button in the main menu list. The Targets sub- menu list is displayed with the following selection options: ... -
Page 314: Tracking Targets
Targets Radar/Chart Radar User Guide Tracking Targets You can manually acquire individual local targets to be tracked, providing the targets are within the tracking range of 0.25 NM to 40 NM. The maximum number of targets that can be tracked by the system is 100. Local targets can also be tracked automatically when they enter auto acquisition zones, see Acquisition Zones. -
Page 315: Target Data Received From Tlb Sentence
Radar/Chart Radar User Guide Targets Target Data received from TLB Sentence If target data is being received from legacy radar equipment (for example, a BridgeMaster E [BME] or other radar hardware) via a port on the PCIO used for TLB communications, then target names may also be prefixed with the contents of the TLB message's label field in parentheses, with a space between this TLB name and the name assigned internally. -
Page 316: Tracked Targets Capacity
Targets Radar/Chart Radar User Guide If the target passes into a blind arc of one radar but is still visible on the other, the target will continue to be tracked as normal without any alerts being raised. The same limits on maximum number of targets tracked apply as for a single radar system. -
Page 317: Ais Targets
Radar/Chart Radar User Guide Targets AIS Targets AIS Rendering Conditions AIS targets are only rendered when the following conditions apply: There is a valid position and heading for own ship Enable Input is checked in AIS Display AIS target messages are being received and are valid. - Page 318 Targets Radar/Chart Radar User Guide Activated When an activated target is selected a dashed square outline appears centred on and Selected the target origin and information on the target is shown in the AIS Info window. When an activated AIS target’s length and beam exceed the standard AIS symbol triangle, the AIS triangle is drawn with the ship’s outline around it.
-
Page 319: Ais Target Display Capacity
Radar/Chart Radar User Guide Targets When the target enters an auto acquisition zone, see Acquisition Zones. To manually activate an AIS target do the following 1. Left click on the AIS target, an activated AIS target will display a heading and speed/course vector. -
Page 320: Active Ais Target Capacity
Targets Radar/Chart Radar User Guide In the event of AIS display capacity being exceeded, only the closest 240 AIS targets to own ship are displayed and used for CPA/TCPA. AIS targets further away will not be rendered until the maximum capacity has receded. Active AIS Target Capacity The maximum number of active AIS targets on a single node or multi-node is 40. -
Page 321: Target Alert States
Radar/Chart Radar User Guide Targets Target Alert States The following alert states apply to any AIS target in any state, (with the exception that sleeping targets do not raise the Lost alert): CPA/TCPA/BCR or Acquisition Zone infringement Lost CPA/TCPA/BCR When an AIS target infringes the CPA/TCPA /BCR criteria, or when it... -
Page 322: Ais Safety Messages
Targets Radar/Chart Radar User Guide AIS Safety Messages Safety messages can be sent from own ship to selected AIS targets. The safety message is sent using an AIS minimum Keyboard & Display (MKD) which can be accessed by either right clicking on the AIS target, or from the AIS Info tab folder in the Selected Target sub menu. -
Page 323: Classes And Types Of Ais
Radar/Chart Radar User Guide Targets Classes and Types of AIS There are two classes of AIS target, Class A and Class B, as well as different types of AIS used for shore stations (Base Stations), Aids to Navigation (AtoN), AIS on search and rescue (SAR) aircraft and AIS Search and Rescue Transmitters (SART). -
Page 324: Target Monitoring
Targets Radar/Chart Radar User Guide Target Monitoring All targets are monitored for Lost Target. Established tracked targets and AIS targets (both activated and sleeping) are monitored for CPA/TCPA using own ship’s CCRP for reference and BCR/BCT infringements, using own ship's bow for reference. Lost Target If the system loses track of a target then a Lost Target alert (warning) is raised for that target and an appropriate flashing alarm symbol placed over... -
Page 325: Target Monitoring Symbols
Radar/Chart Radar User Guide Targets The CPA/TCPA and BCR/BCT values for a target are shown on the Target Data tab folder of the Selected Target sub menu. Target Monitoring Symbols The system shows the following alarm monitoring symbols used for targets. Solid circle CPA/TCPA and BCR infringements see Limits... -
Page 326: Multi-Node Support
Targets Radar/Chart Radar User Guide Multi-Node Support The same target monitoring limits (CPA/TCPA, bow crossing) are applied on all nodes in the system. These values are calculated on individual displays so that a target may, for example, have a different CPA/TCPA on each display, depending on the results from the target tracker. -
Page 327: Echo Reference Target
Radar/Chart Radar User Guide Targets Echo Reference Target Echo reference is a method for generating a ground stabilised own ship’s velocity by using a tracked target that is known to be stationary as a reference point. Any tracked target can be selected as an echo reference, providing the target is established (i.e. - Page 328 Targets Radar/Chart Radar User Guide To select a target for echo reference, do the following: 1. Left click on AIS On button, and from the AIS Display window uncheck Enable Input 2. Right click on the target to be selected as an echo reference and left click on Select for Echo Reference from the semi-transparent window.
- Page 329 Radar/Chart Radar User Guide Targets 3. An Action Required window appears requesting confirmation of which other data types should be received from the selected source i.e. if SOG data type has been changed then the system prompts to change the COG data type from echo reference to the sensor source selected for SOG.
-
Page 330: Selected Target Functions
Targets Radar/Chart Radar User Guide Selected Target Functions Selected Target The Selected Target sub menu is the default opening window in the features area of the screen. The sub menu enables real time data on a selected target to be displayed. When a target has been selected it is tracked and identified on screen with a green broken line box centred on the target origin for tracked targets and AIS targets. -
Page 331: Target Data
Radar/Chart Radar User Guide Targets Target Data The Target Data tab folder shows the following tracking data on a selected target: Range - the distance of the target from own ship's CCRP. True Bearing - the true bearing of the target from own ship's CCRP. - Page 332 Targets Radar/Chart Radar User Guide Tracked targets can be named from the Target Data folder. To name a target: 1. Click in the target name field below the target identifier. The on screen keypad appears. 2. Enter a name for the target using the keypad, when finished click on the keypad OK button.
-
Page 333: Ais Info
Radar/Chart Radar User Guide Targets AIS Info The AIS Info tab folder displays alphanumeric information for an activated AIS target. AIS targets are only shown in Transmit mode shown when there is a valid position and heading for own ship and AIS Input is enabled in the AIS Display window. - Page 334 Targets Radar/Chart Radar User Guide Dynamic Data The following dynamic data is displayed: Lat/Lon position of target RAIM in Use Indication Position Accuracy Time COG – the target’s course bearing SOG – the target’s speed over ground ...
- Page 335 Radar/Chart Radar User Guide Targets Static Data The following static data is displayed (if no static data is available then Missing or Unknown is displayed): IMO number. Call Sign - vessel identification name (data not available for Class B targets). ...
- Page 336 Targets Radar/Chart Radar User Guide AIS Safety Messages The AIS Info tab includes the ability to send safety related messages from own ship to a selected AIS vessel. Safety messages that have been sent from own ship are stored in the `Message Tx’...
-
Page 337: Multiple Targets
Radar/Chart Radar User Guide Targets Multiple Targets The Multiple Targets menu can display information on up to eight activated AIS and tracked targets. The following summary data for each target, based on distance and time from own ship, is displayed: ... -
Page 338: Automatic Sorting Of Targets
Targets Radar/Chart Radar User Guide Automatic Sorting of Targets Targets can be automatically sorted from the nearest to the furthest away from own ship by the following criteria: CPA (default) TCPA Range To sort the targets by CPA click on the triangle symbol in the CPA button. To sort by TCPA click on the TCPA button to activate and then click the triangle symbol in the TCPA button. -
Page 339: Target Display
Radar/Chart Radar User Guide Targets Target Display The Target Display window shows the display parameters for all targets. Targets are only displayed when the system is in Transmit. If the system is switched to Standby then all targets are dropped. Targets can be tracked either manually or automatically by auto acquisition, see Acquisition Zones. -
Page 340: Identification
Targets Radar/Chart Radar User Guide Identification The target identification is displayed adjacent to each target’s vector origin and remains visible as long as the target origin is visible. You can select the target identification to display one of the following: ... -
Page 341: Past Position Dots
Radar/Chart Radar User Guide Targets Tracking Parameters The basic tracking parameters are shown in the following table. Parameter Value Tracking Range 0.25 to 40 NM Acquisition Range 0.25 to 40 NM Cancellation range 0.0 to 40 NM Max number of tracked targets Max tracking velocity 150 knots true Time to display motion trend vector... -
Page 342: Auto Drop Targets
Targets Radar/Chart Radar User Guide A thin dotted line connecting the target and its associated dots may be selected to be drawn. To turn the line on or off tick the Connecting Line check box. To change the past position time interval: 1. - Page 343 Radar/Chart Radar User Guide Targets Tracked targets are dropped automatically if they meet all of the following criteria: The target is not in an auto-acquisition zone. The target is not currently selected for display in the Target tote. ...
-
Page 344: Cancelling Tracked Targets
Targets Radar/Chart Radar User Guide Cancelling Tracked Targets Tracked targets can be cancelled individually or collectively. When a target is cancelled all alerts relating to the target are automatically cleared. If local tracked targets are being displayed then the tracked target is cancelled on the current node only. -
Page 345: Target Repair
Radar/Chart Radar User Guide Targets Target Repair The Target Repair facility enables tracked targets to be repositioned if they become separated from their target video. This is done by the operator moving the tracked target origin to a new position. Target Repair can only be made to tracked targets;... -
Page 346: Ais Display
Targets Radar/Chart Radar User Guide AIS Display The AIS Display window includes the following areas: Settings All Nodes Filter Settings Other Target Count All Nodes The AIS Display window may be quickly accessed from the main screen by left clicking on the AIS On button at the top right of the screen. -
Page 347: Filter Settings
Radar/Chart Radar User Guide Targets Filter Settings Filter Settings enables different types of AIS targets and AIS Nav symbols to be displayed (ticked) or not displayed (unticked). The system prioritises AIS targets into class A and class B vessels. The distinction is made based on the type of message received via the AIS transponder installed on the originating vessel. -
Page 348: Other
Targets Radar/Chart Radar User Guide AIS Nav Symbols The icons used for AIS Nav symbols appear blue on the video circle when the symbol is in the `on position'. See the table below. AtoN AtoN SART Virtual Base Station If an AIS AtoN symbol is in an `off position' (floating), the colour of the symbol and text changes from blue to red. -
Page 349: Test Targets
Radar/Chart Radar User Guide Targets Test Targets The Test Target facility provides a simulation that allows data to be entered for a test target that can then be tracked by the system. The tracked data can be used to compare with the test target data to assess the performance of the tracking system. - Page 350 Targets Radar/Chart Radar User Guide Moveable Test Targets The number of user definable test targets is determined by the type of radar interface board installed in your VisionMaster system. The table below defines the number of targets each interface board supports.
-
Page 351: Using Test Targets
Radar/Chart Radar User Guide Targets Using Test Targets To switch Fixed Test Targets on, tick the Display check box. A fixed test target pattern is displayed flashing on the video circle. To switch on all moveable test targets, click the On button. The Target Active check box is automatically ticked and all moveable test targets are displayed on the video circle with decaying video trails, showing the history of the targets'... -
Page 352: Using Test Targets As A Training Exercise
Targets Radar/Chart Radar User Guide Using Test Targets as a Training Exercise The following training exercise using movable test targets may be undertaken. 1. In order to make the CPA/TCPA calculations easier to visualize, it is advisable to make own ship stationary. To do this, right click on STW on the Sensor Data Display, and click Select STW Source from the drop down list. -
Page 353: Test Targets On Dual Radar
Radar/Chart Radar User Guide Targets Test Targets on Dual Radar On dual radar, test targets can be displayed and tracked separately for each channel, or selected for display and tracking on both channels. The Test Targets window for dual radar includes all the functionality described previously for single radar systems, but with the addition or three tab buttons: Channel 1,... -
Page 354: Test Targets On Client/Server Radar
Targets Radar/Chart Radar User Guide Test Targets on Client/Server Radar On a Client/Server Radar (CSR) the same test targets are applied to all Servers and therefore appear at all Clients on the system. For example; If Client 1 is connected to Server 1, turning the display of moving test targets on at Client 1 will also turn the display on at Client 2, connected to Server 2, with the same settings. -
Page 355: Acquisition Zones
Radar/Chart Radar User Guide Targets Acquisition Zones An acquisition zone is a defined annular or polygonal area of the display. When the system is in Transmit mode, targets that enter the area are automatically acquired and tracked. AIS targets are activated when entering an acquisition zone in both Transmit and Standby mode. -
Page 356: Annular Acquisition Zones
Targets Radar/Chart Radar User Guide There is a limit on the number of trackable targets within all active zones. An AZ Full warning is raised when the next trackable target enters the zone after the limit has been reached. The AZ Full warning is cleared when the number of trackable targets falls below the limit. - Page 357 Radar/Chart Radar User Guide Targets To edit the zone range: 1. Click inside the Start field. The start degree number changes from white to green (editable). 2. Move the trackball left to decrease the range of the zone from ownship, or right to increase the range from own ship. As the Start range is changed the End range numerical degree changes proportionally.
-
Page 358: Polygonal Acquisition Zones
Targets Radar/Chart Radar User Guide Polygonal Acquisition Zones A polygonal acquisition zone is a randomly shaped zone constructed from operator defined zone points (maximum of 10), which are entered directly on to the chart display. Polygonal lines may be drawn up to a maximum distance of 40 NM from own ship. -
Page 359: Own Ship Ais
Radar/Chart Radar User Guide Targets Own Ship AIS The Own Ship AIS window includes the following three tab folders: Own Ship Message Rx Message Tx The following describes data available on the Own Ship tab folder. For information on AIS safety messages that have been sent and received refer to Own Ship AIS Messages. - Page 360 Targets Radar/Chart Radar User Guide Status - the navigational status of own ship includes the following states: Underway At anchor Not under command Restricted manvre Constrain draught Moored Aground Fishing Sailing If one of these states does not apply the Status field displays: Unknown.
-
Page 361: Own Ship Ais Messages
Radar/Chart Radar User Guide Targets Own Ship AIS Messages The Own Ship AIS function includes tab folders for messages sent from own ship (Message Tx) and messages received from other vessels (Message Rx). Message Tx The Message Tx tab folder lists up to 50 safety messages that have been generated by own ship and sent to AIS vessels. - Page 362 Targets Radar/Chart Radar User Guide To send broadcast messages do the following: 1. To broadcast a message to all AIS vessels included in the message recipient list click the Send Broadcast Message button. A message popup window appears. 2. Click in the message field and compose a message using the AIS MKD, for information refer to `AIS Safety Messages' in AIS Info.
- Page 363 Radar/Chart Radar User Guide Targets Message Rx The Messages tab folder displays messages that have been generated from an external device. The messages may for example have been sent from another ship in the area. AIS messages are used to convey to the operator information that requires attention.
-
Page 364: Limits And Settings
Targets Radar/Chart Radar User Guide Limits and Settings The Limits and Settings window defines the following: CPA/TCPA limits Bow crossing (BCR/BCT) limits Target Association settings and limits Lost Target Alert enablement and lost target range limit setting A target is considered dangerous if it infringes the defined limits set in this window. -
Page 365: Target Association
Radar/Chart Radar User Guide Targets Target Association Target association enables the system to decide if a target tracked or activated on one node is the same as a target tracked or activated on other nodes. The difference in the target's range, bearing and velocity values must be less than the association limits for a target to be considered the same. -
Page 366: Collision Avoidance Criteria
Targets Radar/Chart Radar User Guide Collision Avoidance Criteria Collision avoidance must be carried out in strict compliance with the COLREG (Convention of the International Regulations for the Preventing of Collisions at Sea). Relative velocity is fundamental to the activity of collision avoidance. VisionMaster calculates relative velocity in both ground and sea stabilisation modes and presents individual target CPA/TCPA data. -
Page 367: Pads
Radar/Chart Radar User Guide Targets PADs Predicted Areas of Danger (PAD) ) is an optional feature where outlines are drawn on the video circle to mark an area that needs to be avoided in order to prevent a CPA violation to own ship by an established tracked target or active AIS target. - Page 368 Targets Radar/Chart Radar User Guide Intercept Lines - these are lines that connect ownship's CCRP to the PPC. This line represents the course of ownship, based on present speed, to intercept with the target at the PPC. If a target associated with a PAD goes into an alarm state (i.e. the target and its vector flash red) the PAD and intercept lines will also flash red in sequence with the target.
- Page 369 Radar/Chart Radar User Guide Targets When a target is manually selected (i.e. the target appears in the User tab of the Multiple Targets menu) a cross hatch will appear within the boundaries of the target's PAD. 65900010 10-57...
-
Page 371: Chapter 11 Radar
Radar/Chart Radar User Guide Radar Chapter 11 Radar The Radar menu provides access to the following radar/video functions: Transceiver - enables switching the system between standby and transmit mode, pulse length selection and radar fine tuning to be made. ... -
Page 372: Transceiver
Radar Radar/Chart Radar User Guide Transceiver The Transceiver window displays the selected transceiver's alpha identity (A to F if a six-way Interswitch is connected, see Interswitch), its status (Master or Slave) and the scanner unit the transceiver is connected to (X-band or S- band). -
Page 373: Pulse Length
Radar/Chart Radar User Guide Radar Pulse Length The current pulse length selection in the Transceiver sub menu is reflected in the pulse length toggle button below the transceiver identity field. For information on pulse lengths, see Radar Transmission Pulse Length. Tune The radar fine tuning adjustment and tuning control selection in the Transceiver sub menu is reflected in the Tune field, below the Video... -
Page 374: Video
Radar Radar/Chart Radar User Guide Video The Video sub-menu enables the following settings and mode selections to be made: Video Processing Controls - enables adjustment of the Gain setting and the anti-clutter (Rain and Sea) settings. Auto Anti-Clutter and Enhance Video mode ... -
Page 375: Interswitch
Radar/Chart Radar User Guide Radar Interswitch On a conventional radar system the Interswitch sub-menu is divided into the following areas: Request for Display and Status. On a Dual Radar system or Client/Server Radar system the Interswitch sub menu will show slightly different information, see Interswitch on Dual Radar and Interswitch on Client/Server Radar for details. -
Page 376: Interswitch On Dual Radar
Radar Radar/Chart Radar User Guide Interswitch on Dual Radar If your system is dual radar with an Interswitch, the Interswitch window enables each display radar channel to be associated with any one of the transceivers in the system. A transceiver can be selected from its associated channel as a Master for controlling that scanner unit, or as a Slave, if the other channel has selected the... -
Page 377: Interswitch On Client/Server Radar
Radar/Chart Radar User Guide Radar Interswitch on Client/Server Radar On a Client/Server Radar (CSR) system the Interswitch window shows the Master/Slave status of the particular Client node, and enables a request for control of available transceivers to be made. Each transceiver will be connected to the system via a Server. -
Page 378: Radar Alerts
Radar Radar/Chart Radar User Guide Radar Alerts The following series of radar alerts may be raised by the system. Video Alerts Low Video Level The signal level of the video received from the transceiver is monitored at regular intervals when the display is in transmit. If the level falls below an optimal video level a low video alert is raised. -
Page 379: Transceiver Alerts
Radar/Chart Radar User Guide Radar Transceiver Alerts Trigger Error A trigger error alert is raised when the transceiver is in transmit and there are fewer valid triggers than expected. Azimuth Error An azimuth error alert is raised when the transceiver is in transmit and either: ... -
Page 380: Sector Blanking
Radar Radar/Chart Radar User Guide Sector Blanking A top unit may have one or two blanking sectors active. When sector blanking is configured for a particular transceiver, that transceiver will not transmit in any active blanked sector defined for it and the video in that sector is blanked. -
Page 381: Chapter 12 Charts
Radar/Chart Radar User Guide Charts Chapter 12 Charts This section covers all aspects of chart information. The following topics are covered. A description of charts, including chart types, chart rendering, factors that may affect chart accuracy and indications of chart overscale, see About Charts. -
Page 382: About Charts
Charts Radar/Chart Radar User Guide About Charts Chart Types The system allows vector charts to be displayed within the video circle in either Standby or Transmit mode. The Charts facility will only be available if the system has been configured for Chart Radar. Vector charts are electronic chart data stored in a database. -
Page 383: Chart Rendering
Chart Datum The chart datum is the mathematical model used by a chart maker to map the earth’s surface. VisionMaster FT uses the datum known as World Geodetic System 1984 (WGS-84) Ellipsoid Earth model. Charts and all chart objects are displayed using the WGS-84 datum whenever possible. -
Page 384: Chart Overscale
Charts Radar/Chart Radar User Guide When displaying a chart that was created using a datum other than WGS- 84, a warning displays information about the chart’s datum. The Chart Legend window also shows the datum of the displayed chart, see Legend Detail. -
Page 385: Larger Scale Available Prompt
Radar/Chart Radar User Guide Charts Display Overscale Prompt The display overscale prompt appears as Primary Display Overscale when any of the following conditions are met: The largest scale chart at the centre of the display is overscaled, in most cases the display is covered by several charts. ... -
Page 386: Chart Tools
Charts Radar/Chart Radar User Guide Chart Tools Chart Tools is the opening sub-menu on the Charts menu. From Chart Tools you can select the following functions: Chart Match - correct the display of any discrepancies between the radar video and the chart, see Chart Match. -
Page 387: Chart Match
Radar/Chart Radar User Guide Charts Chart Match The Chart Match facility allows the operator to correct a discrepancy between the radar video and the video circle. By selecting the radar object and the chart object to be matched, an offset can be created that is applied to the video circle. -
Page 388: Chart Updates Summary
Charts Radar/Chart Radar User Guide Chart Updates Summary The Chart Updates Summary enables update information on SevenCs chart databases, and updates made by the operator using manual chart update to be displayed in a secondary window when the system is in Standby mode. To access the window click the Show Summary button. - Page 389 Radar/Chart Radar User Guide Charts If a chart update has failed the Chart Update Summary displays Rejected in the Status column and the reason for the rejection is shown in the Error column of the table. For a list of chart update error messages with explanations and recommended actions, refer to `Chart Update Error Messages’.
-
Page 390: Chart Update Error Messages
For information on installing charts from the SevenCs database (ENC charts) refer to Chart Installation. For information on installing C-Map charts, refer to Chapter 1 `Chart Installation’ in the VisionMaster FT Supplementary Features User Guide, 65900014. Update Errors 1. Could not verify signature for file Each ENC chart is delivered with a signature file that verifies the data was created by a proper authority (official hydrographic office). - Page 391 Radar/Chart Radar User Guide Charts 4. No Base Cell for Update This indicates that the import of an update failed because the corresponding base edition for that chart was not present. Often this error can be ignored in the case that the failed updates correspond to a cancelled chart (sometimes update applications are attempted by the ChartHandler tool after a cancellation operation).
-
Page 392: Chart Installation
SevenCs provides two chart databases: ENC (includes S-57, S-64 and DirectENC) and ARCS. Both databases are installed from within the VisionMaster FT application without requiring the system to be shutdown. CAUTION: When charts are installed in this way the database that is being installed will be unavailable to the system. - Page 393 Radar/Chart Radar User Guide Charts 2. To select a database tick the ENC check box (ARCS charts are not applicable to a Chart Radar) and click the Launch ChartHandler button. If the selected chart database is the currently active database the charts will be unavailable for navigation while the ChartHandler is running and an `Action Required’...
- Page 394 Charts Radar/Chart Radar User Guide 4. To install charts from a different data source, click the Browse button and navigate to the root directory that contains the chart data. A Browse For Folder window opens from where you can navigate to the external drive (CD, DVD or USB memory stick) and/or source directory where the chart files reside.
- Page 395 Radar/Chart Radar User Guide Charts NGSM recommends that the user carefully reads all the information provided by the chart data supplier. This applies particularly to chart sets used where the vessel sails near shoals or high traffic areas. When you have installed all the SevenCs charts required, exit the ChartHandler by clicking the Close ChartHandler button on the Chart Installation window.
- Page 396 Charts Radar/Chart Radar User Guide NAVTOR Charts Encrypted ENC charts (S-63) are provided by NAVTOR on CD, DVD or USB memory stick (NavStick). The chart loading process uses the installed cell permits to decrypt chart cells, verify the cells against the S-57 standard, and compile them into SENC format used in the VisionMaster system.
- Page 397 Radar/Chart Radar User Guide Charts 4. From the S-63 Permits window verify that PRIMAR.CRT selected under S-63 Certificate with a valid expiration date 5. If S-63 chart permits are listed remove the existing permits by clicking the Clear All Permits button. 6.
- Page 398 Charts Radar/Chart Radar User Guide 3. On the Chart Installation window tick the ENC check box and click the Launch ChartHandler button. An `Action Required' popup window appears requesting confirmation of chart deactivation. Click the OK button to confirm. 4. If the active chart database is ENC the chart is removed from the display and the Charthandler application opens (if ARCS is the active database the ARCS charts remain on the screen).
- Page 399 Radar/Chart Radar User Guide Charts Chart Permits The Permits window (accessed by clicking on the Permits button in Chart Installation window) displays a list of the currently installed S-63 chart permits. The window includes the following columns: Chart Name – the reference of each chart in the database ...
- Page 400 Charts Radar/Chart Radar User Guide 2. With the PERMIT.TXT file selected in the Browse dialog, click the Open button to install the permits from this file. After the permits from the file have been processed by the system, an information dialog is displayed that includes the total number of permits processed, the number of new permits found, and the number of updated permits found.
- Page 401 Radar/Chart Radar User Guide Charts Important Note: The only circumstances where a new certificate should be installed when an existing certificate has expired, or when the key information of the scheme administrator has been compromised and subsequently a new certificate issued. The certificate file that should be used for installation of S-63 charts from a particular provider is often found within the root directory of the media on which the charts are distributed.
- Page 402 Charts Radar/Chart Radar User Guide The Charts at Remote Nodes table provides the latest available information about charts installed at remote nodes. The same chart time, date and update information is provided for charts on remote nodes as is provided for the local node. The Status column provides an indication of whether the charts on the remote node match the locally installed charts.
- Page 403 Radar/Chart Radar User Guide Charts 5. To cancel the copy operation click the Cancel Copy Operation button while the copy is in progress, the copy will be cancelled and any partially set of copied files will be removed from the remote node.
-
Page 404: Permissions / User Permits
Charts Radar/Chart Radar User Guide Permissions / User Permits The Permissions/User Permits area includes the following access buttons: Export S-63 Permit Export 7Cs Hardware ID Export ARCS User Permit C-Map Permissions The Export ARCS User Permit selection is only valid if your system is configured as a Total Watch and a presentation option of the Total Watch includes an ECDIS. - Page 405 Radar/Chart Radar User Guide Charts 5. With the export location highlighted and a name entered click the Export button, the S-63 permit is exported to the location as a .txt file. If successful a temporary prompt is displayed confirming that the permit has been exported with the selected location detailed in the prompt.
- Page 406 Charts Radar/Chart Radar User Guide C-Map Permissions When in Standby, information on the C-Map charts, including product (ENC), region covered and permit expiration date can be viewed by clicking on the C-Map Permissions button. A tabular window appears over the video circle.
-
Page 407: Chart Index
Radar/Chart Radar User Guide Charts Chart Index Chart Index catalogues each chart for all loaded chart databases. The Index facility includes a number of display filtering options, the display of chart outlines within the current display area and the option to move the display location to a selected chart. - Page 408 Charts Radar/Chart Radar User Guide Chart Filtering Options The chart Index table includes the following filter options: Usage Level and Database. All charts are defined with a usage level (e.g. Harbour or Coastal) with each usage level displayed in a particular colour. All the usage types are listed in a Usage Level drop down list, which defaults to displaying all.
- Page 409 Radar/Chart Radar User Guide Charts Go To Chart The Go to Selected Chart button pans the display to the centre of a selected chart from the Chart Index window. To pan to a particular chart, select the chart by clicking anywhere within the chart row, and with the selected chart highlighted click the Go To Selected Chart button.
-
Page 410: Chart Settings
Charts Radar/Chart Radar User Guide Chart Settings The Chart Settings sub menu includes two tab folders: Features Symbology The Features folder enables you to choose a chart display mode and enable/disable custom display settings from a list of chart format features, additional to those displayed on the currently selected mode. -
Page 411: Features
Features The selection of the display mode defines the behaviour used by the chart engine when rendering chart data. VisionMaster FT includes the following four types of chart display modes: Base Standard Other - includes all Standard and Other... - Page 412 Charts Radar/Chart Radar User Guide Standard The Standard display mode includes all features defined by Base, plus the additional features listed in the Standard display features list. This display mode is intended to be used as a minimum during route planning and route monitoring.
-
Page 413: Symbology
Radar/Chart Radar User Guide Charts Symbology The Symbology folder lists the display settings available for all chart types and all other configured chart databases (as listed in Chart Databases). The All, None and Default buttons work in the same way as described previously in the Features section. - Page 414 Charts Radar/Chart Radar User Guide Setting Name Setting Description Default Value Chart Scale Displays a boundary around the largest scale Boundary chart data in view Data Quality Pattern Pattern indicating the quality of chart data Ignore Time Display chart objects regardless of their S-57 Attributes date and time dependency attributes (PERSTA, PERENC, DATSTA, DATEND)
- Page 415 Radar/Chart Radar User Guide Charts The chart symbology display settings below are available for the ENC (S- 57) chart database. Setting Name Setting Description Default Value Display Admiralty Information Overlay data Light Distinction Provides non-standard symbology for fixed lights so they can be easily distinguished from floating lights.
- Page 416 Charts Radar/Chart Radar User Guide The chart symbology display settings below are available for C-Map chart databases. Setting Name Setting Description Default Value Coverage Boundaries indicating chart coverage. Boundaries Danger Symbol Danger symbol displayed for dangers in waters shallower than the safety contour. Lights Leg Real light leg lengths.
-
Page 417: Chart Projections
Radar/Chart Radar User Guide Charts Chart Projections There are two primary projection types supported by the VisionMaster system: Mercator Polar Stereographic Mercator is the default chart projection, used to display geographic areas between 0 degrees and 80 degrees latitude north or south. The exception to that is with non-navigational scales (1:1,000,000 or above) where Mercator can view regions up to 85 degrees North/South. -
Page 418: Chart Depths/Heights
Charts Radar/Chart Radar User Guide SevenCs vector based charts are displayed in all chart projections, whereas CMAP is only displayed in Mercator projection. At high latitude regions, using Polar Stereographic projection, CMAP charts are suppressed and a permanent prompt Chart Suppressed at High Latitude appears. -
Page 419: Shallow And Deep Contours
Radar/Chart Radar User Guide Charts Shallow and Deep Contours The Deep Contour and Shallow Contour areas are highlighted on the Video circle by colour shading, with the shallow water areas indicated by lighter shades. Contours, prohibited areas, and areas with special conditions are considered dangerous if their depth is less than own ship’s safety depth or no depth is defined for that object. -
Page 420: Chart Databases
Charts Radar/Chart Radar User Guide Chart Databases The Chart Databases window lists all chart databases available to the system and allows databases to be enabled or disabled. When the system is in its initial state, i.e. the first time the system is run; all chart databases that have been configured for the system are listed as enabled. -
Page 421: Supported Chart Engines And Databases
Radar/Chart Radar User Guide Charts Supported Chart Engines and Databases The VisionMaster system supports CMAP and SevenCs chart engines. The CMAP chart engine supports the following chart databases: C-MAP Professional (CD version) C-MAP ENC C-MAP Professional+ (Upgraded DVD) ... -
Page 422: Official And Unofficial Chart Data
Charts Radar/Chart Radar User Guide Official and Unofficial Chart Data Chart databases may be classified as Official or Unofficial chart data. Official chart data is known as Electronic Navigational Chart (ENC) data. All official ENC chart data must comply with data standards set by members of the International Hydrographic Organisation (IHO) and published in their document S-57, Edition 3. -
Page 423: Chart Legend
Radar/Chart Radar User Guide Charts Chart Legend The Chart Legend sub menu enables you to view read only information on every chart currently visible on the screen. The Chart Legend window is divided into three tab folders: Select Detail ... -
Page 424: Legend Detail
Charts Radar/Chart Radar User Guide Legend Detail The Detail folder displays all the chart legend information on the chart selected from the Select folder. The information displayed in the Detail folder is divided into the following sections: Chart Usage/Scale ... - Page 425 Radar/Chart Radar User Guide Charts Deep Contour and Shallow Contour All vector charts contain information about the contour and shape of the sea floor at a particular depth, this information is called Depth Contour. Each chart contains depth contour information with varying levels of detail based on the survey that was originally performed to create the chart.
- Page 426 Charts Radar/Chart Radar User Guide Safety Depth The safety depth is the depth threshold at which spot soundings should be displayed with or without emphasis. The Safety Depth value set in Chart Depth/Heights is reflected in the Safety Depth field. The illustration below shows a typical chart annotated with contour areas and safety depth areas.
-
Page 427: Legend Updates
Radar/Chart Radar User Guide Charts Legend Updates The Update folder displays the following data on updates applied to the selected chart. time and date the update was applied date that the update was issued action taken i.e. Add, Modify or Delete ... -
Page 428: Manual Chart Update
Charts Radar/Chart Radar User Guide Manual Chart Update The manual chart update facility enables the operator to add chart objects to the currently enabled chart. Added chart objects are displayed using the same symbology as ENC chart data but with a manual update symbol superimposed. -
Page 429: Manual Chart Update Functions
Radar/Chart Radar User Guide Charts Manual Chart Update Functions Chart Layers The Layers tab enables you to create, edit, and delete layers. Layers provide a way to group sets of related manual chart updates, see Create Chart Update. Groupings may be made based on different criteria such as geographic region, time period, navigational mode, or danger classification. -
Page 430: Edit Chart Update
Charts Radar/Chart Radar User Guide Edit Chart Update The Edit tab folder is divided into two areas: Create Chart Update and Modify Chart Update. The Create Chart Update area includes the following links: Create New object Add Annotation Mark Add Deletion Mark ... - Page 431 Radar/Chart Radar User Guide Charts 3. To select the object type, click on the Type drop down arrow and select from the list. The following object types are assigned: Areas Beacons Buoys Danger Points Geo Shapes ...
- Page 432 Charts Radar/Chart Radar User Guide The Manually Create… button can also be used to manually specify the position of additional points for a line or area objects. 11. Click in the LAT/LON fields, enter a position using the screen keypad, and click the OK button. A symbol is created in the position specified.
- Page 433 Radar/Chart Radar User Guide Charts Add Annotation Mark The Add Annotation Mark feature allows you to highlight an object (an area, line or point) on the chart display and add a note to the annotated chart object. To annotate a chart object do the following: 1.
-
Page 434: Modify Chart Update
Charts Radar/Chart Radar User Guide Modify Chart Update The Modify Chart Update area of the Edit tab folder enables you to do the following: View or Edit a chart update Delete a chart update Viewing or Editing a Chart Update To view or edit a chart update, do the following: 1. - Page 435 Radar/Chart Radar User Guide Charts 5. To change the object's position either: Click in the LAT/LON fields and enter a position using the screen keypad; Move the cursor over the object, hold down the left key and use the trackball to drag the object to the required position. When editing a line or area object, select the specific point to be edited by moving the cursor over the point and left clicking.
-
Page 436: Display Chart Updates
Charts Radar/Chart Radar User Guide Display Chart Updates The Display tab enables you to select the layers and object types to be displayed on the currently enabled chart. Each layer and type currently displayed will have their check box ticked. The Displayed Layers area lists the default layer and all the operator defined layers created in Layers. -
Page 437: Importing Or Exporting Chart Updates
Radar/Chart Radar User Guide Charts Importing or Exporting Chart Updates The I/O (Import/Export) tab folder enables you to import or export manual chart updates to and from VisionMaster workstations. Chart updates not currently on a workstation can be imported from an external drive such as a USB memory stick. - Page 438 Charts Radar/Chart Radar User Guide Exporting Chart Updates To export chart updates do the following: 1. Select the external drive where the update is to be exported to. 2. Select the export option required by clicking on the drop arrow in the Export field, the export options available are: ...
-
Page 439: Chart Query
Radar/Chart Radar User Guide Charts Chart Query The Chart Query facility enables the operator to highlight and view detailed information on specific chart areas and geographic objects in the video circle. A chart query can be activated from the Chart Query Results folder, or by right clicking on a chart object in the video circle and selecting Query Chart from the semi-transparent window. -
Page 440: Query Features
Charts Radar/Chart Radar User Guide Query Features Query Results The Query Results folder includes an objects list, information panel, and navigation controls. Objects List The objects list displays a tree view of all the chart objects. The objects are divided into the following groups: ... - Page 441 Radar/Chart Radar User Guide Charts For Points and Clusters a red circle filled with a red shaded background is drawn around the selected object. Areas are outlined in red and filled with a red shaded background Lines are displayed in red. At the bottom of the menu, two controls are provided to control the display of query results and highlighting.
-
Page 442: Query Options
Charts Radar/Chart Radar User Guide Query Options The Chart Query Options control allows you to set the following query options: Filter - search by geometry type (points, lines, areas, arcs and/or 3D and cluster points) Area Size - search area as a factor of scale (small, medium, large) To include the basic geometry types in chart queries tick their check box. - Page 443 Radar/Chart Radar User Guide Charts Click the Show File button. A secondary window opens showing details of the notice, either as a chart text viewer or where there is pictorial representation, a chart picture viewer. A Chart Picture Viewer displaying a graphic image will include a button to automatically scale the picture file to fit the viewer window.
-
Page 444: Chart Dangers
Safety Checking must be configured as an optional feature in system configuration before the operator can view chart dangers, see Chapter 1 `Configuration' in Volume 2 of the VisionMaster FT Ship's Manual. WARNING! SAFETY CHECKING WILL NOT BE APPLIED TO AN AREA OF AIO DATA (FOR INFORMATION ON AIO REFER TO CHART SYMBOLOGY ON PAGE 12-35). -
Page 445: Chart Dangers Information
Radar/Chart Radar User Guide Charts given below the list and the danger object is highlighted in the video circle. When all dangerous objects have been acknowledged in the Dangers window the red background is removed from the Dangers icon, although the objects will remain listed. -
Page 446: Danger Settings
Charts Radar/Chart Radar User Guide Danger Settings The following Danger settings can be enabled, or the default values adjusted: Look-Ahead Range Added Breadth Alarm on Cautions Display Safety Region To change the Danger settings do the following: The Look-Ahead range controls how far in advance an alert is given before a specified range limit is reached. - Page 447 Radar/Chart Radar User Guide Charts In some circumstances it may be desirable for the operator to select a zero value for Look-Ahead time or distance, for example, when ownship is in a crowded harbour area. If a zero value is selected a `Minimal Safety Region' caution is generated.
-
Page 448: Chart 1
Charts Radar/Chart Radar User Guide Chart 1 The Chart 1 facility provides access to the SevenCs and C-Map Chart 1 catalog and the SENC color diagram. The Chart 1 Catalogs and Color Diagram windows are only available when the system is in Standby. -
Page 449: Color Diagram
Radar/Chart Radar User Guide Charts Color Diagram The color diagram ensures that any adjustments made to the brightness and contrast settings on the VisionMaster monitor will enable the SENC data, such as coastlines, safety contour and other objects to be adequately displayed. -
Page 451: Appendix A Chart Datum Codes
Radar/Chart Radar User Guide Chart Datum Code Appendix A Chart Datum Codes The table below lists Chart Data with their identification codes. Code Description Abidjan, Ivory Coast Leigon Pillar (GCS No 121), Accra, Ghana Adindan (30th Meridian), Sudan Afgooye, Somalia Ain el Abd 1970, Saudi Arabia M36 Astro 1975 adjustment, Montserrat DOS Astro A14 1977 adjustment, Antigua... - Page 452 Chart Datum Codes Radar/Chart Radar User Guide Code Description Castello Di Sao Jorge, Lisboa, Portugal (Bessel) Canton Island Astro 1966 Cape Datum, South Africa Camp Area Astro 1961-62, Antarctica Castania Delle Furie, Sicily Carthage, Tunisia Chatham Island Astro 1971, Chatham Island, New Zealand Chua Astro, Paraguay Corrego Alegre, Brazil Cruz Astro 1947, Guadalcanal, Solomon Islands...
- Page 453 Radar/Chart Radar User Guide Chart Datum Codes Code Description German Genoa, 1908, Italy Geodetic Datum 1949, New Zealand DOS 1968, Gizo Island, New Georgia Goenoeng Dempo, Sumatra, Indonesia Graciosa Base SW 1948 Goenoeng Segara (P5) 1933, Kalimantan E Grand Turk Astro 1943 Guam 1963 Helsinki, Kallio Church, Finland Hermannskogel, Austria...
- Page 454 Chart Datum Codes Radar/Chart Radar User Guide Code Description Le Pouce, Mauritius Latvia LC5 Astro 1961, Little Cayman and Cayman Brac Liberia 1964 (Roberts Field Astro) Lisboa (Castelo Di Sao Jorge), Portugal (International spheroid) Luzon (1911), Philippines Massoua (Eritrea), Ethiopia Madrid 1853, Spain Merchich, Morocco Mercury Datum (Satellite Reference System Only)
- Page 455 Radar/Chart Radar User Guide Chart Datum Codes Code Description Norwegian (New) Panama Colon, Panama Ayabelle Lighthouse (Phare D'Ayabelle), Djibouti Pitcairn Astro 1967 Pico de la Nieves, Gran Canaria, Canary Islands Port Etienne, Mauritania New Porto Santo Potsdam, Germany Principe, Sinal Domorro Do Papagaio Provisional South American 1956 PSAD56 Puerto Rico 1927, Puerto Rico, Greater Antilles Qatar National...
- Page 456 Chart Datum Codes Radar/Chart Radar User Guide Code Description South West Africa Tananarive Observatory 1925, Malagasy Rebublic Tete, Mozambique Timbalai 1948 (datum point), Sabah (Bessel 1841) Timbalai 1948 (datum point), Sarawak + Brunei (Everest) Tokyo, Japan Tokyo Astronomical Observatory (Old) 1918 Varesmae (System 1937), Estonia HMS Vidal 1967 Astro Vienna (Hermanskogel)
-
Page 457: Chapter 13 Brilliance Brilliance Menu
Radar/Chart Radar User Guide Brilliance Chapter 13 Brilliance Brilliance Menu The Brilliance menu provides access to the following functions: Day Night Modes Brilliance Groups Chart Symbols Brightness Check 65900010 13-1... -
Page 458: Day And Night Modes
Brilliance Radar/Chart Radar User Guide Day and Night Modes The Day / Night modes function enables you to select the correct colour setting for optimum display purposes in various lighting conditions. The colour modes include two daylight settings, one dusk and two night time settings. The current setting is shown with its radio button highlighted. -
Page 459: Brilliance Groups
Radar/Chart Radar User Guide Brilliance Brilliance Groups This feature enables you to independently adjust the brilliance of the following predefined groups: Chart Symbols Mariner Objects (Nav Tools) Alarms / Warnings Routes ARPA / AIS data (to extinction) ... -
Page 460: Chart Symbols
Brilliance Radar/Chart Radar User Guide Chart Symbols The Chart Symbols window enables access to a colour diagram, which ensures that any adjustments made to the brightness and contrast settings on the VisionMaster monitor will enable the SENC data, such as coastlines, safety contour and other objects to be adequately displayed. -
Page 461: Brightness Check
Radar/Chart Radar User Guide Brilliance Brightness Check The Brightness Check is a method of accurately setting the monitor's brightness control to an optimal setting. The brightness check window contains a grey box within a black rectangle. When a brightness check is performed the operator adjusts the monitor controls while observing the grey box. -
Page 463: Chapter 14 System
Radar/Chart Radar User Guide System Chapter 14 System The System menu provides access to the following system facilities: User Profiles Standard Settings Options Diagnostics Commissioning Time Management Shutdown If selected in configuration, the System menu will also include NAVTEX, Weather Fax and Third Party Applications. -
Page 464: User Profiles
System Radar/Chart Radar User Guide User Profiles The User Profiles sub-menu enables you to create, delete, apply, save, view and update profiles that contain node specific chart, route, and other display settings. Saved profiles are maintained by the system and are available after a system restart. -
Page 465: Create New Profile
Radar/Chart Radar User Guide System Create New Profile When creating a new user profile, you have the option of selecting values for the various settings, and also the option of choosing whether or not a given setting is included in your profile. For example, a profile may be created that only contains display settings for routes, or one that only contains settings for charts. -
Page 466: Available Profiles
System Radar/Chart Radar User Guide Available Profiles Saved profiles in the Available Profiles list are viewed and edited in the same way as described in View/Edit Profiles. When a settings profile is applied, the system updates the corresponding features with the setting values stored in the profile only on the node where the profile was applied. -
Page 467: View/Edit Profiles
Radar/Chart Radar User Guide System View/Edit Profiles To change a Profile's settings, with a Profile created and displayed in the Available Profiles field, click the View/Edit button. Two tab folders are available; Editing and Selection. View/Edit Profile – Selection The Selection tab folder lists all the profile groups that can be selected, once selected the group is listed in the Editing folder where user profile settings can be defined. - Page 468 System Radar/Chart Radar User Guide To change profile selections do the following: All features listed in the Profile Selection groups are selected by default. Features may be deselected, although once deselected in the Selection tab those features will not be available to edit in the Editing tab.
-
Page 469: View/Edit Profile - Editing
Radar/Chart Radar User Guide System View/Edit Profile – Editing The features selected in the Selection tab folder will be available for editing in the Editing tab folder. Note that if a feature has been deselected in Selection it will not appear in the Editing folder. To edit a user profile, do the following: 1. -
Page 470: Standard Settings
System Radar/Chart Radar User Guide Standard Settings The Standard Settings facility lists a set of collision avoidance settings that the operator can select to be applied when in Radar or Chart Radar watch mode. On a Multi-node system the Standard Settings facility is not available on ECDIS nodes, or on Server nodes that are part of a Client/Server Radar (CSR) system. - Page 471 Radar/Chart Radar User Guide System Setting Function Standard Applicable Value Off centring Centre or Max view Motion True motion (TM) or Relative motion mode (RM) Presentation Display mode: North Up, Course N UP Mode Up, Head Up (Stabilised and Unstabilised) Range Range scales: 0.125 NM to 96 NM 6 NM...
- Page 472 System Radar/Chart Radar User Guide Setting Function Standard Applicable Value Closest Point of Approach limit to 2 NM System own ship wide Vector Time Determines length of vectors 6 min Vector True or Relative Relative mode Stabilisation Ground or Water based mode Ground Chart Chart Filled, Unfilled, Radar Maps...
-
Page 473: Options
Radar/Chart Radar User Guide System Options The Options window displays a selection of common units which are displayed when the system is running, (e.g. metres, knots, degrees etc.) If the selection of units has not been enabled for the operator at commissioning (which is the default mode), then the Options window displays the units as read-only information. -
Page 474: Diagnostic Functions
For a description of these functions refer to Chapter 2 `Diagnostics, Commissioning and Service Mode' in Volume 2 of the VisionMaster FT Ship's Manual. Time - displays transmission time and total persisted runtime data. Tx/Rx Config - displays configuration data on the currently selected transceiver. -
Page 475: Performance Monitor
Radar/Chart Radar User Guide System When a user has logged in by entering a user name and password the following additional diagnostic features are available: S/W - displays version information of all operational system software, including charting data. Performance Monitor The Performance Monitor folder displays the current operational Transceiver (Tx/Rx);... - Page 476 System Radar/Chart Radar User Guide The precise bearing value will alter depending on the Heading line offset value. To adjust the Performance Monitor, do the following: 1. Select Receiver monitoring mode by clicking the Receiver radio button. The current tuning level is shown as a green bar. 2.
-
Page 477: Report
Radar/Chart Radar User Guide System Report The Report folder enables you to export a system fault report to an external device such as a USB memory stick. You can quickly access the Reports folder by right clicking on the iHelp button on the lower popup toolbar. - Page 478 System Radar/Chart Radar User Guide All fault report options are generated as single compressed file, with the file extension .rpt to distinguish it as a report file. In order to access the files within the report the file extension should be changed to .zip on the service desktop, or on a separate PC.
-
Page 479: Datalog
Radar/Chart Radar User Guide System To export diagnostic log files do the following: 1. Follow steps 1 to 3 in the previous procedure. 2. Select the Diagnostic Log Files radio button. 3. If required, enter a description of the log files in the Description field. - Page 480 System Radar/Chart Radar User Guide View DataLog Individual log files can be selected from a list and their contents viewed in table format via the Data Log Viewer. To view datalog files do the following: 1. Click on the View Data Log button. The Data Log Viewer window appears on the video circle (in Standby mode only).
- Page 481 Radar/Chart Radar User Guide System Export DataLog A copy of the datalog file can be exported to an external device, such as a USB memory stick. To export a datalog file do the following: 1. Insert an external device into the PC and click on the DataLog tab folder.
-
Page 482: Sensor Status
System Radar/Chart Radar User Guide Sensor Status The system determines the status for received sensor data for each of the four data types (HDG, STW, COG and SOG) in the Sensor Data Display. If a multi-sensor interface is used to receive data from other sensors, in addition to a data type, then these sensors will also be shown in the table. - Page 483 Radar/Chart Radar User Guide System Unacknowledged Faults - any unacknowledged faults on the sensor data, e.g. Uncompensated, Unaligned etc. See `Description of Sensor Data States' for a description of all fault conditions. Acknowledge button (Ack), which enables faults relevant to that sensor to be acknowledged.
- Page 484 System Radar/Chart Radar User Guide There is a possibility that the data is not accurate, based on some of the information being supplied by the sensor. For example, if position data is supplied in a Inaccurate datum other than WGS84, and the sensor does not supply the offset needed to adjust it to WGS84, the data will be considered inaccurate.
- Page 485 Radar/Chart Radar User Guide System The data is received in a form that requires alignment, and this alignment has not been performed yet. This Unaligned would typically apply to heading data received via a synchro or stepper interface. When this applies, the data is considered unusable.
-
Page 486: Connection Status On A Multi-Node System
System Radar/Chart Radar User Guide Connection Status on a Multi-Node System The Connection Status folder determines the connection of each node on a multi-node system. The connection state for all nodes on the system is shown as a table in the Connection Status tab folder. -
Page 487: Connection Status On A Client/Server Radar System
Radar/Chart Radar User Guide System Safe Mode If your node has been configured to operate in Safe Mode, the node will automatically disconnect from the network and operate as a standalone node if it detects conditions on the network that prevent it from operating reliably. -
Page 488: Buzzer
To test click on the Test Buzzer button. The alarm buzzer should sound. If there are any problems with the alarm buzzer refer to section 7.7 `Announcements' in Chapter 1 `Configuration' of the VisionMaster FT Ship's Manual, Volume 2. Database... -
Page 489: Dual Radar - Diagnostic Functions
Radar/Chart Radar User Guide System Dual Radar – Diagnostic Functions On dual radar the following diagnostic functions contain read-only data for each channel: PM (Performance Monitor) TxRx Config TxRx Data TxRx BITE To view the data for each channel click on either Channel 1 or Channel 2 tab buttons. -
Page 490: Commissioning
Additional Service diagnostic information, including diagnostic forms for CCRS, Sensors and Time Management. For a description of the following Commissioning functions refer to Chapter 2 `Diagnostics, Commissioning & Service Mode' in Volume 2 of the VisionMaster FT Ship's Manual. Login ... -
Page 491: Authorization
Radar/Chart Radar User Guide System Authorization The Authorization tab folder displays the current authorization status of the display. If the authorization state is valid the following message is displayed at the top of the tab folder: The system is fully authorized. The authorization folder displays a five digit system PIN, which is encrypted when the system is initially commissioned. - Page 492 System Radar/Chart Radar User Guide Unauthorized System If the system is not authorized the tab folder states that the system is unauthorized and will revert to a degraded state of functionality, counting down from 7 days after the authorization initially failed. When the system is in a degraded state, the display becomes unstabilised (Head Up mode).
-
Page 493: Config Update
Radar/Chart Radar User Guide System Config Update The Config Update feature enables the operator to export a copy of their system configuration to an external USB memory stick. When exported, the configuration is saved as a compressed file which can then be forwarded as an email attachment to your system supplier, or to Northrop Grumman Sperry Marine (NGSM) service control. - Page 494 System Radar/Chart Radar User Guide Importing a Configuration To import a configuration do the following 1. Connect a USB memory stick to a USB port at the front of the VisionMaster PC. The device name appears in the Import Configuration File field. 2.
-
Page 495: Characteristics
Radar/Chart Radar User Guide System Characteristics The Characteristics tab folder displays persistent static data relating to own ship that has been entered in the system configuration. The read only data includes own ship length, beam, height and maximum draft in metres, design speed, maximum speed in knots and maximum rate of turn in degrees per minute. -
Page 496: Service
System Radar/Chart Radar User Guide Service The Service tab folder displays the following navigation tree items: Communications Port Monitor Port Logging PCIO PCIO diagnostic form The Communications sub menu enables the following data to be viewed: ... - Page 497 Radar/Chart Radar User Guide System 5. With all required settings made click on the Start button. The Port Monitor window displays real time received and sent data for the selected port and the Start button changes to Stop. 6. To halt the port monitor process click on the Stop button. The port monitor stops its updating based on data being sent or received.
- Page 498 System Radar/Chart Radar User Guide Port Logging The Port Logging window lists all the currently configured ports on the system and provides the option to capture data for the specified port. 1. To access Port Logging click on the Communications + button, highlight Port Logging in the tree menu and click on the Display Selected button at the bottom of the tab folder.
-
Page 499: Dual Radar - Commissioning Functions
Radar/Chart Radar User Guide System PCIO Diagnostic Form The PCIO diagnostics form records the error rate on received data from serial input ports TSCA, TSCD and TCSE (Serial Ports 1, 2 and 3) on the PCIO. If any data errors are received on these PCIO serial inputs the number of error messages over a selected time period appears against the serial input line. -
Page 500: Local Offset
System Radar/Chart Radar User Guide Time Management The Time Management facility enables the operator to select local date and time and set a time zone offset from .The window also displays the sensor (e.g. GPS) used as the time source. The Time Management window is divided into three areas: ... -
Page 501: Shutdown
Radar/Chart Radar User Guide System Shutdown The Shutdown facility enables the operator to shut down or restart a single node, or all nodes on the system. In Operator mode, the Service Mode and Service Mode All buttons will be greyed out. They will only be available if the current operator is logged on as a Service Engineer. -
Page 503: Annex A Sarts, Beacons & Target Enhancer Detection On X-Band
Radar/Chart Radar User Guide Annex A - SARTs, Beacons & Target Enhancer Detection on X-Band Radar Annex A SARTs, Beacons & Target Enhancer Detection on X-Band Radar WARNING! THE FOLLOWING DEVICES WILL ONLY BE DETECTED BY X- BAND (3CM) RADAR; THEY WILL NOT BE SEEN ON S-BAND (10CM) RADAR. -
Page 504: Radar Range Scale
Annex A - SARTs, Beacons & Target Enhancer Radar/Chart Radar User Guide Detection on X-Band Radar When the range to the SART is reduced to about 1 NM, the radar display may also show the 12 responses generated during the fast sweeps. These additional dot responses, which are also equally spaced by 0.64 NM, will be interspersed with the original line of 12 dots. -
Page 505: Radar Bandwidth
Radar/Chart Radar User Guide Annex A - SARTs, Beacons & Target Enhancer Detection on X-Band Radar Radar Bandwidth This is normally matched to the radar pulse length and is usually switched with the range scale and the associated pulse length. Narrow bandwidth of 3-5 MHz are used with long pulses on long range scales and wide bandwidths of 10-25 MHz with short pulses on short ranges. -
Page 506: Video Gain
Annex A - SARTs, Beacons & Target Enhancer Radar/Chart Radar User Guide Detection on X-Band Radar Video Gain For maximum range SART detection the normal gain setting for long range detection should be used, i.e. with a light background noise speckle visible, see Video Processing Controls. -
Page 507: Radar Beacons
Radar/Chart Radar User Guide Annex A - SARTs, Beacons & Target Enhancer Detection on X-Band Radar Radar Beacons Radar Beacons (RACONS) are receiver/transmitter devices operating in the radar frequency bands 9 and 3 Ghz. RACONS are used to enhance the detection and identification of certain radar targets. -
Page 508: Target Enhancer Detection
Annex A - SARTs, Beacons & Target Enhancer Radar/Chart Radar User Guide Detection on X-Band Radar Target Enhancer Detection A Radar Target Enhancer (RTE) is designed to respond to X-Band radar by receiving a transmitted pulse, amplifying the pulse and re-transmitting the pulse back to the radar at the same frequency. -
Page 509: Annex B Static Site Static Site Description
Radar/Chart Radar User Guide Annex B – Static Site Annex B Static Site Static Site Description Static Site is an optional facility that allows for a stationary installation. This is intended for small single node installations (for example, an oil rig) and larger multi-node, land based Vessel Traffic Services (VTS) installations. -
Page 510: Static Site Features
Annex B – Static Site Radar/Chart Radar User Guide Static Site Features Features specific to a Static Site The following table lists features specific to a Static Site facility. Feature Additional details Verifies that vessels at anchor are not drifting by Target Anchor Watch assigning an anchor watch to a target. - Page 511 Radar/Chart Radar User Guide Annex B – Static Site The following navigation tools are unavailable: Lines Of Position Navigation Tools History Tracks Anchoring Man Overboard Static position only. Own ship dead reckoning Position Data and position offset unavailable. Target Autodrop or Echo Reference selection Target Display Functions unavailable.
-
Page 512: Static Heading
Annex B – Static Site Radar/Chart Radar User Guide Static Heading On start up, the static heading value defaults to 000.0. As a Static Site may operate without compass input, the heading value is always displayed as green (valid). To obtain correct orientation of a static site picture in North Up the true bearing at which the heading line is pointing needs to be entered. -
Page 513: Static Position
Radar/Chart Radar User Guide Annex B – Static Site Static Position At start up, the static position LAT/LON values default to 00º North and 000º East. As a Static Site may operate without position input, the position value is always displayed as green (valid). -
Page 514: Target Anchor Watch
Annex B – Static Site Radar/Chart Radar User Guide Target Anchor Watch Target anchor watch enables the operator to verify that vessels at anchor are not drifting by assigning an anchor watch to a target. An anchor watch comprises a dotted line circle centred on the target's anchor position, and a small anchor symbol next to the target's symbol. -
Page 515: Target Based Range And Bearing
Radar/Chart Radar User Guide Annex B – Static Site To remove all anchor watch selections, navigate to Multiple Targets and select the Anchor tab. The anchor folder lists the ID number of all targets with an anchor watch, the radius of the watch circle and the target drift in percentage terms. - Page 517 Radar/Chart Radar User Guide Glossary Glossary Activated Target: A symbol representing the automatic or manual activation of a sleeping target for the display of additional graphically presented information including: a vector (speed and course over ground); the heading; and ROT or direction of turn indication (if available) to display actually initiated course changes.
- Page 518 Glossary Radar/Chart Radar User Guide British Admiralty. Backup Navigator Alarm: The Backup Navigator Alarm is affected by activating a commissioned PCIO relay output by way of an active alarm. BCR: Bow Crossing Range BCT: Bow Crossing Time BIST: Built-In Self-Test BITE: Built in Test Equipment Bulkhead Transceiver: Transmitter/Receiver mounted below decks with microwave or co-axial connection to the Turning Unit.
- Page 519 Radar/Chart Radar User Guide Glossary (CPA) or time to closest point of approach (TCPA) are referenced. Typically the CCRP is the conning position of the ship’s bridge. CD ROM: Compact Disk Read-Only Memory. Checksum: A numeric value used to verify the integrity of a block of data. When data is transmitted from point to point in a packet, the sending computer counts the bytes and adds a check digit at the end of the packet.
- Page 520 Glossary Radar/Chart Radar User Guide commercial sources are not available. Digitized charts do not conform to any standards for chart display. DGPS: Differential GPS (see also GPS). Position sensor intended for precise commercial navigation in coastal waters. The DGPS employs an additional receiver for the reception of correction signals from a land-based transmitter to be applied to the satellite- based GPS position information.
- Page 521 Radar/Chart Radar User Guide Glossary ECS: Electronic Charting System. A chart display system that does not comply fully with the ECDIS standard as defined by IMO. ENC: Electronic Nautical Chart. Chart data conforming to specification published in IHO Special Publication No. 57 (S57). Charts complying with this specification are available from various suppliers.
- Page 522 Glossary Radar/Chart Radar User Guide GPS: Global Positioning System. A system by which receivers anywhere on earth can obtain accurate position data. The term "GPS" is also used to refer to the receiver device. Great Circle (GC): A circle drawn around the Earth such that the centre of the circle is at the centre of the Earth.
- Page 523 Radar/Chart Radar User Guide Glossary HSC: Heading-to-Steer Command. Heading order sent to an autopilot from an external electronic navigation aid, such as the ECDIS. IHO: International Hydrographic Office. IHO has developed an ENC product specification as the standard for ECDIS data, and has published this specification in its Special Publication No.
- Page 524 Glossary Radar/Chart Radar User Guide Lost Target: A target representing the last valid position of a target before its data was lost. The target is displayed by a “lost target” symbol. Long Pulse (available from 3 NM and upwards) Metre Magnetron: Device that is comprised of an electric circuit inside a strong but variable magnetic field, designed to generate coherent microwaves.
- Page 525 Radar/Chart Radar User Guide Glossary NIMA: National Imagery and Mapping Agency. An agency of the United States government, supplying navigational charts to the United States Navy. Nautical mile – The nautical mile is closely related to the geographical mile which is defined as the length of one minute of arc on the earth's equator.
- Page 526 Glossary Radar/Chart Radar User Guide Performance Monitor Polar Stereographic: Chart projection used to display any region of the earth, including the north and south poles (up to 90 degrees north or south). POS: Position PPI: Plan Position Indicator PRF: Pulse Repetition Frequency – the number of radar pulses transmitted each second.
- Page 527 Radar/Chart Radar User Guide Glossary Rhumb Line (RHL): A line on a sphere that cuts all meridians at the same angle; the path taken by a ship or plane that maintains a constant compass direction RM(R): Relative Motion – Relative Trails RM(T): Relative Motion –...
- Page 528 Glossary Radar/Chart Radar User Guide SCU: Scanner Control Unit SENC: System Electronic Navigational Chart (SENC) means a database resulting from the transformation of the ENC by ECDIS for appropriate use, updates to the ENC by appropriate means, and other data added by the mariner. It is this database that is actually accessed by ECDIS for the display generation and other navigational functions, and is the equivalent to an up-to-date paper chart.
- Page 529 Radar/Chart Radar User Guide Glossary System PIN: Personal Identification Number that uniquely identifies a system. T BRG: Target Bearing/True Bearing Target: Object of interest on a radar display. Targets can be labelled (acquired) and tracked. TCPA: Time to Closest Point of Approach [to own ship] True Motion TO-Waypoint: The waypoint to which the ship is approaching...
- Page 530 Glossary Radar/Chart Radar User Guide TX COMMS: Transceiver Communications TxRx: Transceiver UTC: Universal Time Coordinated – the international standard of time, kept by atomic clocks around the world. Formerly known as Greenwich Mean Time (GMT), local time at zero degrees longitude at the Greenwich Observatory, England.
- Page 531 Radar/Chart Radar User Guide Glossary The watch alarm should be operational whenever the ship's heading or track control system is engaged, unless inhibited by the Master. Watch Mode: See Total Watch. Waypoint: A geographical location (for example, latitude and longitude) on a route indicating a significant event on a vessel’s planned route (for example, course alteration point, calling in point, etc.).
Need help?
Do you have a question about the VisionMaster FT and is the answer not in the manual?
Questions and answers