
Related Manuals for Extech Instruments RHT10


Summary of Contents for Extech Instruments RHT10
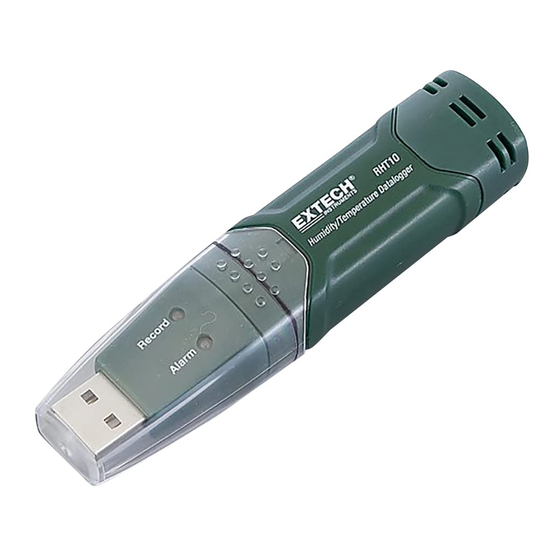
- Page 1 USER GUIDE Humidity / Temperature Datalogger Model RHT10 Contact sale@ponpe.com www.ponpe.com...
- Page 2 Relative Humidity, Temperature and Dew Point data can then be graphed, printed and exported to other applications. GPP (grains per pound) data can be viewed using the optional RHT10-SW software. The data logger is supplied with a long-life lithium battery, which can typically allow logging for one year. This meter is shipped fully tested and calibrated and, with proper use, will provide years of reliable service.
-
Page 3: Operation
5. Once installed, plug the RHT10 unit into the PCs USB port and start the RHT10 software. Note: When the RHT10 is connected to the USB port, the battery inside the device is discharged at a higher rate than normal. To conserve battery life, do not leave the RHT10 connected to the USB port for a prolonged... - Page 4 RUNNING THE GRAPHING SOFTWARE With the RHT10 inserted in the PC’s USB port, double-click the Datalogger Graph icon to launch the program. The opening screen will appear as shown below. Press “Connect” to open the main screen, Press “About” to view the version number, Press “View File”...
-
Page 5: Menu Bar Description
(INSTANT), or at a later time (MANUAL). The LOGGER NAME field allows the user to select a unique name for the RHT10. The SAMPLE POINTS field instructs the RHT10 to take a fixed number of readings. -
Page 6: Data Download
When in doubt, we recommend that you always install a fresh battery before logging critical data. If INSTANT was selected in the SETUP window, the RHT10 begins logging at the instant the SETUP button is pressed. If MANUAL was selected, the RHT10 must be manually started by pressing and holding the device’s yellow button for approx. - Page 7 In the screen below press VIEW to see the data graphically. If there are no readings currently stored in the RHT10, the program will let the user know via a warning screen. Contact RHT10-EN v4.0 4/14 sale@ponpe.com www.ponpe.com...
- Page 8 The Data Graph window presents the transferred data in an x-y graph format with Date/Time represented on the horizontal axis and Temperature / Relative Humidity / Dew Point / Grains per pound GPP (with optional RHT10-SW only) / Alarm Limits represented on the vertical axis: To zoom in and out of data regions, there are several approaches: Use the mouse to click and drag a box around any data area to magnify the selected area.
-
Page 9: File Print
Note that color graph windows can be accurately printed on color printers. Note: The RHT10 retains data in its internal memory until the user begins a new logging session. Starting a new logging session clears all of the RHT10’s stored readings; be sure to save previous data before starting a new logging session. - Page 10 Download data - RHT10 memory full To save power, the RHT10’s LED flashing cycle can be changed to 20s or 30s via the supplied software. To save power, alarm LEDs for temperature can be disabled via the supplied software. †...
-
Page 11: Specifications
Accuracy (25 C, 40 to 100%RH) ±4.0 F (±2 Grains per pound 1120 gpp (160g/kg) max.; Available only with optional RHT10-SW software Logging rate Selectable sampling interval: From 2 seconds up to 24 hours Operating temperature -31 to 176 F (-35 to 80 Battery type 3.6V Lithium (1/2 AA) (SAFT LS14250, Tadiran TL-5101 or equivalent) -
Page 12: Battery Replacement
It is highly recommended that the battery be replaced every 12 months, or prior to logging critical data. The RHT10 does not lose its stored readings when the battery weakens or when the battery is replaced; the data logging process will however be stopped and cannot be re-started until the battery has been replaced and the logged data has been downloaded to PC. -
Page 13: Warranty
Cette garantie ne s’applique pas aux dommages imputables à l’utilisateur, tels que l’usage impropre ou abusif, un mauvais câblage, une utilisation non conforme aux spécifications, un entretien ou une réparation incorrecte, ou toute modification non autorisée. FLIR Systems, Inc. déclinera spécifiquement toute garantie ou qualité marchande ou aptitude à l’emploi prévu, et ne sera en aucun cas tenu responsable pour tout dommage conséquent, direct, indirect ou accidentel. La responsabilité totale de FLIR est limitée à la réparation ou au remplacement du produit. La garantie définie ci‐dessus est inclusive et aucune autre garantie, écrite ou orale, n’est exprimée ou implicite. Calibrage, réparation et services après‐vente FLIR Systems, Inc. offre des services de calibrage et de réparation pour les produits Extech Instruments que nous commercialisons. Nous fournissons également une certification NIST pour la plupart des produits. Contactez notre service client pour toute information sur les services de calibrage disponibles pour ce produit. Un calibrage doit être effectué chaque année pour vérifier les performances et la précision du mètre. Nous offrons également une assistance technique et un service à la clientèle. Veuillez vous reporter aux coordonnées fournies ci‐dessous. Lignes d’assistance: États‐Unis (877) 439‐8324; international: +1 (603) 324‐7800 Service d’assistance technique : Option 3 ; E‐mail : support@extech.com Réparations et retours : Option 4 ; E‐mail : repair@extech.com Les spécifications produit sont sujettes à modifications sans préavis. Pour les toutes dernières informations, veuillez visiter notre site Web. www.extech.com FLIR Commercial Systems, Inc., 9 Townsend West, Nashua, NH 03063 USA Certifié ISO 9001 Copyright © 2014 FLIR Systems, Inc. Tous droits réservés, y compris la reproduction partielle ou totale sous quelque forme que ce soit. www.extech.com Contact RHT10-EN v4.0 4/14 sale@ponpe.com www.ponpe.com... - Page 14 Servicios de calibración, reparación y atención a clientes FLIR Systems, Inc., ofrece servicios de reparación y calibración para los productos que vendemos de Extech Instruments. Además ofrecemos certificación NIST para la mayoría de los productos. Llame al Departamento de Servicio al Cliente para solicitar información de calibración para este producto. Para verificar el funcionamiento y precisión se debe realizar la calibración anual. Además se provee Soporte Técnico y servicios generales al cliente, consulte la información de contacto en seguida. Líneas de soporte: EE.UU. (877) 439‐8324; Internacional: +1 (603) 324‐7800 Soporte Técnico Opción 3; correo electrónico: support@extech.com Reparación / Devoluciones: Opción 4; correo electrónico: repair@extech.com Las especificaciones del producto están sujetas a cambios sin aviso Por favor visite nuestra página en Internet para la información más actualizada www.extech.com FLIR Commercial Systems, Inc., 9 Townsend West, Nashua, NH 03063 USA Certificado ISO 9001 Copyright © 2014 FLIR Systems, Inc. Reservados todos los derechos, incluyendo el derecho de reproducción total o parcial en cualquier medio www.extech.com Contact RHT10-EN v4.0 4/14 sale@ponpe.com www.ponpe.com...
Need help?
Do you have a question about the RHT10 and is the answer not in the manual?
Questions and answers