
Related Manuals for a-eberle PQ-Box 150

Summary of Contents for a-eberle PQ-Box 150
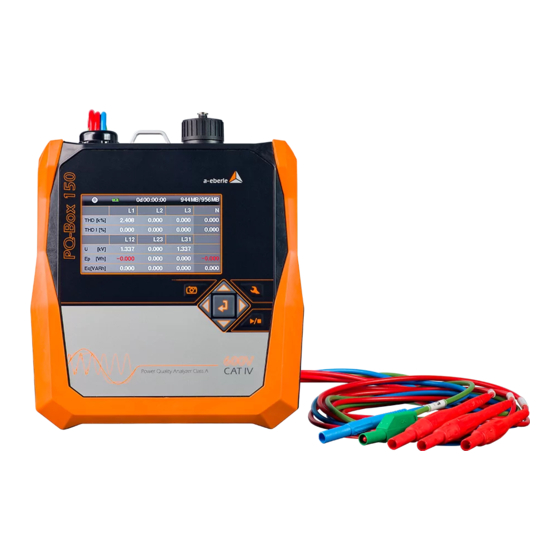
- Page 1 Operating Manual Network Analyzer PQ-Box 150 Power-Quality Evaluation Software Model PQ-Box 150...
- Page 2 In this case, either contact us directly or refer to the most recent version of the operating manual, available on our website (www.a-eberle.de). A. Eberle GmbH & Co. KG Frankenstraße 160...
-
Page 3: Table Of Contents
Other Symbols ...........................6 Safety Instructions ......................7 Safety instructions ........................7 Meaning of the symbols used on the device ................8 Scope of Delivery/Order Codes PQ-Box 150 ..............9 Scope of Delivery ........................9 Order Codes ..........................9 Technische Daten PQ-Box 150 ....................12 External power supply .................... - Page 4 10.1.9 PQ-Box 150 Setup ........................32 10.1.10 Keypad Lock ........................... 35 10.1.11 Password Protection and Interface Lock ................35 10.1.12 Memory management ......................36 10.1.13 Delete device memory ......................37 10.1.14 Continuous mode without power supply ................37 10.1.15 TCP-IP settings........................38 Evaluation software WinPQ mobile ................
- Page 5 Online - Phasor Diagram ...................... 112 14.11 Power Triangle ........................113 14.12 Online Status PQ-Box ......................114 Measurement Data – PQ-Box 150 .................. 115 15.1 PQ-Box Measurement Procedure / Formulas ..............115 Maintenance/Cleaning ....................124 Calibration ........................124 Disposal ........................124...
-
Page 6: User Guidance
User Guidance Warnings Types of Warnings Warnings are distinguished according to the type of risk through the following signal words: → Danger warns of a risk of death → Warning warns of physical injury → Cau=on warns of damage to property Structure of a warning Nature and source of the danger Actions to avoid the danger. -
Page 7: Safety Instructions
Safety Instructions Safety instructions Follow the operating instructions. Keep the operating instructions with the device. Ensure that the device is operated only in a perfect condition. Never open the device. When opening the battery compartment, disconnect the power supply. Ensure that only qualified personnel operate the device. Connect the device only as specified. -
Page 8: Meaning Of The Symbols Used On The Device
Meaning of the symbols used on the device Nature and source of the danger! Read the safety instructions inside the manual! Voltage ground USB-interface TCP-IP interface CE marking guarantees compliance with the European directives and regulations regarding EMC. The unit is fully protected by double or reinforced insulation. IP65 6X = Protection against dust Protection against water X5 = Protection against water jets from any angle... -
Page 9: Scope Of Delivery/Order Codes Pq-Box 150
With a licence code, the PQ-Box 150 can be upgraded with option B1 -Optional “Ripple control recorder” (R1) - Used for triggering and recording ripple control signals for voltages and currents. With a licence code, the PQ-Box 150 can be upgraded with ripple control recorder. - Page 10 582.0511 Network adapter connector socket for 1 ~; 4mm safety plugs Calibration set for PQ-Box 100/150/200; calibration software and adapter box 111.7039 Kensington lock - Lock for PQ-Box 150/200, 1.8 m length 111.7032 111.7008 Kit of magnetic voltage taps DCF 77 radio controlled clock 111.9024.01...
- Page 11 Measurement / Functions PQ-Box 150 Automatic event detection and evaluation standards for: EN50160 (2011) / IEC61000-2-2 / IEC61000-2-12 /IEC61000-2-4 (Class 1; 2; 3) / NRS048 / IEEE519 / IEC61000-4-30 Ed. 3 class A / IEC61000-4-7 / IEC61000-4-15 Continuous recording with user defined interval of >3,500 parameters including:: Voltage: min.
-
Page 12: Technische Daten Pq-Box 150
Technische Daten PQ-Box 150 4 voltage inputs (TRMS): L1, L2, L3, N, PE Maximum input voltage: 565V AC/800V DC L-N 980V AC/1380V DC L-L Input Impedance: 10 MΩ impedance 4 current inputs (AC/DC): 1000 mV-input for Rogowski 330mV for current clamps Impedance: 10 kΩ... - Page 13 Measurement quantity Error limits according IEC 61000-4-30, Class A Fundamental oscillation: r.m.s. ±0.1% of U over 10% ~ 150% of U Fundamental oscillation: Phase ± 0.15° over 50% ~ 150% of U over f ±15% 2nd ... 50th harmonic ±5% of display over U = 1% ~ 16% of U ±0.05% of U over U...
-
Page 14: External Power Supply
Wide range power supply with safety plugs and integrated high-load fuses (111.7069) 2 pcs. 4mm safety connectors (582.2037) The PQ-Box 150 is equipped with an extremely robust power supply unit. The power supply is designed for high noise immunity of 600V CAT IV and meets the IP65 protection class. - Page 15 In fuse carrier only 6.3mm x 32mm, 3 A, F, fuses are allowed, with a shut-off value of 50kA. Only fuses with the identical data must be used. Suggestion: SIBA, Part.no. 7009463; 3AF With two short adapter cables, the user has the option to staple the wide range power supply and the voltage leads the network analyzer to one dolphin clip.
-
Page 16: Accessories For Current Measurement
Accessories for current measurement - Standard accessories are automatically recognized by the meter. - The conversion factor is automatically adjusted for the connected accessory. 5.1.1 Rogowski current clamps Rogowski current clamp 4~: Ident-No. 111.7001 Rogowski current clamp 4~: Ident-No. 111.7006 Model 111.7001/6 Model 111.7001 Pro Flex 3000 4~... -
Page 17: Current Clamps
Automatic current clamp factor detection. In this example the PQ-Box set the clamp factor to 1 5.1.2 Current clamps The MU-metal clamp is especially applicable for small current measurements on secondary transformers in medium- and high-voltage networks. High accuracy and small angle errors are combined. Mu-Metal Mini-Current clamps 3~: Ident-No. - Page 18 Mu-Metal Mini-Current clamp 0…5A 1~: Ident-No. 111.7043 Current range: 5mA to 5A AC RMS Frequency range: 40Hz to 20kHz Free current adapter set necessary AC/DC Current clamp 1~: Ident-No. 111.7020 AC/DC hall sensor clamp. Set with power supply and 2 pcs. 4mm connectors Current range 60A/600A (two ranges) Model 111.7020 Measurement range...
-
Page 19: Accessories For Current Measurement
The product is exclusively for the measurement and evaluation of voltages and currents. The current inputs are mV-inputs. Description The Network Analyzers PQ-Box 150 & 200 are suitable for analysis in low, medium and high-voltage networks. They meet all the requirements of the measurement equipment standard IEC61000-4-30 Ed. 3 class A. -
Page 20: Hardware Pq-Box 150
Hardware PQ-Box 150 PQ-Box 150 Hardware 8.1.1 Overview PQ-Box 150 Top panel view 1) Securely connected voltage inputs L1 (red + label L1) L2 (red + label L2) L3 (red + label L3) N (blue + label N) Measurement ground (green + label E) - Page 21 Bottom view 1) Kensington lock 2) TCP/IP interface 3) USB 2.0 interface Side view 1) RS232 interface – for connecting a DCF77 or GPS radio clock Rear view Under the cover you find a battery pack and a card slot for a micro SD card (1 Gb to 32 Gb) Open the screws with a torx (TX15) screw driver.
-
Page 22: Battery Management And Micro Sd Card
Micro SD card To replace the microSD card, please note the following: The PQ-Box 150 support microSD cards up to a maximum size of 32 We recommend the use of an industrial micro-SD card, to reach the temperature range from -20 °... -
Page 23: Network Connection Pq-Box 150
Network connection PQ-Box 150 10.1.1 Direct connection to a 3-phase low voltage network Connection in a 3-phase 4-wire AC network Voltage connection Ensure that voltage measurement cable PE is connected for every measurement. If no PE connection is available, connect E and N together. -
Page 24: Connection To A Single-Phase Low Voltage Network
10.1.2 Connection to a single-phase low voltage network Connection for single-phase measurements Voltage connection Ensure that voltage measurement cable E is connected for every measurement. If no PE connection is available, connect E and N together. Ensure that switching “1-wire system” is selected. (Setting via display or software) Not necessary to connect phases L2 and L3 for voltage and currents in single phase measurement. -
Page 25: Connection To An Isolated Network
10.1.3 Connection to an isolated network Connections Connect terminals E and N together and connect it to a ground potential. Ensure that switching (3-wire) is selected. (Setting via display or software) The input impedance of a measuring input is 10 mega ohms. If the high-resistance ground connection is not desired, it is also possible to interconnect the terminals E and N and to hang open. -
Page 26: Connection To Secondary Transformer
10.1.4 Connection to secondary transformer Connections Ensure that voltage measurement cable E is connected for every measurement. If no PE connection is available, connect E and N together. Ensure that switching (3-wire) is selected. (Setting via display or software) Set the voltage transformer ratio Enter the nominal conductor-conductor voltage Set the current transformer ratio In 3-wire connection the 4... - Page 27 Special circuit types Configurations such as a V connection or aron connection can be parameterized. – V connection (parameterization through the evaluation software or device setup) – Aron connection (parameterization through the evaluation software or device setup) Isolated networks Connections Connect voltage measurement conductors E and N to ground If this is not desired in the plant due to isolation monitoring, the E and N connections can be connect- ed together and remain free without connection.
-
Page 28: Display
10.1.5 Display Pressing the right and left arrows on the directional pad changes the page of the Display. Display page 1 1) Recording "On" is indicated by a flashing red light 2) Display state of charge battery state of charge >= 100% --> four green bars state of charge >= 75% -->... - Page 29 Display page 3 → Display of the apparent, active and reactive power with sign prefix (individual phases and total per- formance) Display page 4 → Display of the current and voltage THD (individual phases, neutral conductor) → Display of the conductor-conductor voltages →...
- Page 30 Graphic display PQ-Box With the keypad by pressing, "up" or "down" you get into the graphic screens. Graphic display 1: Phasor diagram voltage and current Scroll to the right or to the left with the keypad to reach the oscilloscope pictures. Graphic display 2: oscilloscope voltage and current Graphic display...
-
Page 31: Starting A Measurement
10.1.6 Starting a measurement Press the key to stop or start measuring. Recording "On" is indicated by a flashing red light For a positive display of the active power Ensure that the arrows on the current clamps point towards the consumer. 10.1.7 Manual Trigger Press the key to set manual trigger. -
Page 32: Time Synchronisation Using The Rs232 Interface
- Automatic synchronisation of the measurement equipment after connecting receivers. If synchronisa- tion is lost, the PQ-Box 200 runs with an internal quartz clock. - A detected external clock is shown on the equipment display on display page 5. 10.1.9 PQ-Box 150 Setup Press the key to open Setup. - Page 33 Parameterisation page 1 1) Freely adjustable measurement interval: 1 sec to 30 min (default interval setting = 600 sec) Settings < 1 min should only be used for short measurements. 2) Switch between 1~; 3~ and 4~ conductor networks. In a single phase network, only phase L1, neutral and earth will be measured. In a 3-conductor system, all evaluations of the standard reports are calculated from the phase- phase voltages.
- Page 34 Changing parameters Press → the colour of the selected parameter changes to orange Select position → the value can now be changed with the up and down arrows Press to accept the changed value → the new value appears in the Menu Settings page 1 1) Change the display language 2) Change the date...
-
Page 35: Keypad Lock
10.1.10 Keypad Lock Press and hold the Setup key for > 5 sec while a measurement is in progress. → Keypad lock acIve. Then press and hold > 5 sec. → Keypad lock inacIve. It is possible to see the measurement readings when the keypad is locked. The Setup menu and screen pages are locked. -
Page 36: Memory Management
In active interface lock mode the device can only be unlocked with the correct PIN. After more than eleven incorrect PIN entries, user access is locked permanently and the device has to be sent to the A. Eberle support address. 10.1.12 Memory management So that the recorder data does not fill the whole memory when a too sensitive or incorrect trigger level... -
Page 37: Delete Device Memory
PQ-Box 150 can be started directly without power supply. press start button > 10 seconds → PQ-Box 150 starts without power supply via battery. → PQ-Box 150 is now in the "Battery continuous operation“ Deactivate battery mode via the setup menu "Off". -
Page 38: Tcp-Ip Settings
10.1.15 TCP-IP settings In “Setup/ Ethernet Interface” you can change all parameters for IP interface. This example shows the basic settings for the PQ Box 150 interface. All parameters can be changed with the control keys on the box. To accept the changed parameters, the device must be restarted... -
Page 39: Evaluation Software Winpq Mobile
Evaluation software WinPQ mobile The evaluation software WinPQ mobile supports the PQ-Box 100, PQ-Box 150, PQ-Box 200 and PQ Box portable network analyzers. It was developed in collaboration with power supply companies with the goal of creating an easy-to-use and adaptable solution for the evaluation of power quality parameters in energy distribution networks. - Page 40 Before uninstalling the program, the components launched must be closed. Software Update The evaluation software and all updates are available free of charge on our website under the category "Power Quality": www.a-eberle.de Please update both, the software and the firmware of the PQ-Box 150, to avoid problems.
-
Page 41: Software Wizard
11.2 Software Wizard If you install the software on a new PC, after the first opening, a setup assistant will start. Customer and country-specific settings are automatically queried and copied into the software. All settings can be changed later in the Software General Settings. Select language Select software design (Windows design or Black Magic design) Setup country specific standard settings... -
Page 42: Winpq Mobile Start Screen
11.3 WinPQ mobile start screen Start screen of the evaluation software WinPQ mobile - Open a measurement on the disk - Load the measurement data from the PQ-Box - Change the PQ-Box setup - Online measurement with the PQ-Box Data converter... -
Page 43: General Software Settings
11.3.1 General Software Settings Changing the language The evaluation software language can be changed in the "Settings“ menu. After changing to a new lan- guage, the software must be restarted for the change to take effect. Changing the colours of lines Here, each measuring channel can be assigned a specific colour. - Page 44 Export Preferences: Basic settings for data export Decimal point separator: (,) = German Windows (.) = English Windows Options: Suppress Header – Information like device number, measuring interval and comments will be not in the header of the export file Fill gaps –...
- Page 45 General Change the logo in printouts and headers Set the header for automatic standard reports Two predefined comment fields can be set. These will be shown in any printout, as well as in the standard report. Insert your own logo for printouts and 1) Extended standard report: This feature extends the standard report for all PQ event information and the ITIC...
- Page 46 Harmonics settings Under "Settings / Harmonics Settings“, the type of presentation can be set. Voltage harmonics: Display as “Volt” or “% of the fundamental oscillation” Current harmonics / THD, TDD current: Display as “Ampere”, “% of the fundamental oscillation” or “% of the nominal current“ All diagrams and bar graphs in the software will use the selected units (volts or %;...
- Page 47 Changing the WinPQ mobile design WinPQ mobile offers two different designs for screen displays. – Windows native – Black magic Example: "Black magic“ design with a black background With the "Black magic“ setting, all print tasks are printed in "Windows native“.
-
Page 48: Tcp-Ip Settings In Winpq Mobil
11.3.2 TCP-IP Settings in WinPQ mobil In the analysis software in "Settings / Network Connections", multiple network connections from PQ- Box devices are stored. address, port number, and a free name of the analyzer can be stored. Pick up with "Add" this connection to the software menu. -
Page 49: Transferring Measurement Data From The Pq-Box To The Pc
11.4 Transferring measurement data from the PQ-Box to the PC Connect the power quality analyzer to the PC with the USB cable or TCP-IP connection. When the PQ-Box is connected the icon can be used to display all of the available measurement data within the PQ-Box memory. -
Page 50: Data Folder In Windows Explorer
In this view, four comments can be attached to each measurement. If no comment has been entered yet, this field contains "-". Double-click a comment field to edit it. All four comment fields appear in the printed reports. 11.4.1 Data folder in Windows Explorer If a text is entered in the first comment field of a measurement file, the folder containing the measure- ment data will also be called this in Windows Explorer. -
Page 51: Transferring Measurement Data While A Measurement Is In Progress
11.4.2 Transferring measurement data while a measurement is in progress To transfer measurement data from the device after a measurement has been started, the measure- ment is stopped briefly during the data transfer. Confirm the question "Should the recording be stopped?"... -
Page 52: Fast Data Transfer In Usb Disc Mode
The measurement is resumed by pressing the "Continue" button. All of the measurement data are available at the end of the recording in a complete measurement file. 11.4.3 Fast data transfer in USB disc mode If PQ Box 150 is in the setting "USB disc mode", huge data files can be transmitted very quickly to the PC. Use the tap "Import"... -
Page 53: Evaluation Of Measurement Data
11.5 Evaluation of Measurement Data All measurements available on the PC are listed in the "Hard disk" folder. The various measurement data can be sorted by "Date" and "Comment" in ascending or descending order. The button opens the selected measurement for analysis. icon removes the measurement data from the PC´s hard disk. -
Page 54: Change The Measurement Data Directory
Brückengleichrichter_000” by double-clicking on one of the icons as shown in the example below. The WinPQ mobile starts automatically and opens the selected measurement. 11.5.1 Change the measurement data directory The button opens an Explorer window. Here the folder is assigned in which the measurement data are located. Do not select the measurement data folder directly but only the parent folder. - Page 55 After pressing the "OK" button, the specified period of the selected measurement is opened. All of the measurements and analyses shown below have been prepared with demo data, which are included in every installation.
- Page 56 Start screen after loading one measurement: Create a report in accordance Range of the voltage and current harmonics, and the interhar- with EN50160/IEC61000-2-2 or monics. Scaling according to the specified standard IEC61000-2-4 Information about the selected measurement: -Nominal voltage -Measurement interval -Ripple control frequency -Measurement start -Measurement end...
-
Page 57: Standard Evaluation For En50160 And Iec61000-2-2
Clicking on a sign of an oscilloscope recorder, RMS recorder, ripple signal recorder or transient recorder automatically opens the corresponding fault description. 11.5.2 Standard evaluation for EN50160 and IEC61000-2-2 button gives you a quick overview of all voltage measurement value, with regard to the com- patibility levels of the specified standard. - Page 58 Harmonic oscillations: In the bars of the voltage harmonics all the measurements of the 2nd to 50th harmonic are compared with the respective performance level of standards EN50160 and IEC61000-2-2. The harmonic is dis- played that is the next to the corresponding limit or exceeds it. All standard limits can be changed by the user in the software "Configuration / Limits"...
- Page 59 In the "Details" panel of the standard report, detailed information is given on the respective maximum and minimum value, and the reference to the standard limit. Example: Standard flicker evaluation The maximum values for the phases are: L1 = 0.61; L2 = 1.02; L3 = 0.63. As the Plt limit is 1, the bars for the phases L2 exceed the limit line in the overview display.
- Page 60 The bars show in a clear format the 95% reading in red and the highest "100% value" measure- ment value occurring in blue. In the "Harmonic" page the limits of the selected standard, and the 95% values and maximum values of the individual phases are shown in a table.
- Page 61 Create EN50160 / IEC61000-2-2 report: With the Print function, a multi-page standard report opens. Send a report Create PDF Change printer Scroll through the to the printer document settings standard report...
-
Page 62: Bar Chart Of The Harmonics And Interharmonics
11.5.3 Bar chart of the Harmonics and Interharmonics Voltage harmonics and Current harmonics and Interharmonics Interharmonics Using the two icons, all voltage and current harmonics, as well as voltage and current interharmonics are displayed graphically or in a table form. The scaling can be changed in “setup harmonics”... - Page 63 The example shows the list of all current harmonics of the three phases and neutral. The ordinals 5 and 7, 11 and 13, 17 and 19 stand out. Red bar represents the 95% measured value, the blue bar represents the 100% value. Table of harmonic values...
-
Page 64: D-A-Ch-Cz Report
11.5.4 D-A-CH-CZ report The software produces an automatic report according the D-A-CH-CZ standard. All current harmonics will be compared to the maximum allowed limit of this standard. You have to fill the “short circuit power” of the network, the connected load and the nominal voltage. DACH-CZ report compare all current harmonics to the limits. -
Page 65: Level-Time Diagrams Of The Long-Term Data
11.5.5 Level-time diagrams of the long-term data In the "Cyclic data" menu item all permanent recorded measurement data are listed. In each measure- ment more than 3800 different measurement values (voltage, harmonics, interharmonics, current, power and energy) are saved. Any measurement values can be displayed together in a level-time dia- gram. - Page 66 Zoom function in the graphic To magnify an area, activate the zoom function. Then pull with the left mouse button pressed, a window from the top left to bottom right. If the window is drawn in the opposite direction, the magnification is reset.
- Page 67 Place a marker Using the "Marker“ button, two markers can be positioned in the graphic. Two markers can be set in the plot using the left mouse button. This selects the closest curve and the marker acquires its colour. Marker No. 1 with the left mouse button and Shift Marker No.
- Page 68 Representation of line styles Four types of representation are offered for lines. 1st. Connects every measured point together (default for all graphs) 2nd. Represents only the measurement points, the points are not connected by lines 3rd. This level representation is particularly suitable for medium values, such as 15 minutes per- formance data.
- Page 69 Other functions in the right mouse menu: Delete marker – If one marker is set, it is possible to delete the marker Flagging representation = measurement data that were obtained during a network fail- ure or interruption are marked (flagged). Here the marking can be toggled on and off. Left axis scaling = the left measurement axis can be scaled manually Right axis scaling = the right measurement axis can be scaled manually Logarithmic axis scaling...
- Page 70 Limit Line Setting In the "Limit line setting" menu option it is possible to define multiple limit lines. The colour, value, and the corresponding y-axis of the limit line can be set. Example: Limit line for the voltage; 207 V (-10% Unenn) Show limit marker harmonics The software automatically suggests the thresholds for harmonics, voltage, unbalance or flicker.
- Page 71 Insert and edit comment With the "Insert comment" function, any number of texts can be placed in the graphic. To delete or move this term in the graph, click it with the mouse so that it turns red. Now, using the Windows "remove" function the text can be deleted or moved using the mouse. With double mouse click it is possible to edit the comment.
-
Page 72: Oscilloscope Recordings
11.5.6 Oscilloscope recordings With the "Oscilloscope" tab, all manually recorded and using oscilloscope trigger settings images are listed. These can be sorted by time, or trigger condition. By double-clicking on the line, or by pressing the button, you will get the relevant oscillo- scope image. - Page 73 Calculation of the FFT spectrum is possible by activating the "FFT" field of each triggered oscilloscope image. PQ-Box 150 = DC to 10.000Hz The markers fields in the FFT analysis show the selected frequency and amplitude in the spectrum.
-
Page 74: Periode Rms Rms Recorder
11.5.7 ½ periode rms RMS Recorder With the "10ms RMS" tab, all RMS recordings manually recorded and using trigger settings are listed. These can be sorted by time, or trigger condition. Double-clicking the line or pressing the button retrieves the corresponding 10 ms RMS recorder value. Listing all 10 msec. -
Page 75: Ripple Control Signal Recorder
11.5.8 Ripple Control Signal Recorder With the option “R1-Ripple signal recorder” it is possible to trigger to the signal voltage and start a rec- ord especially for this frequency. The maximum length of the recorder is 210 seconds. There are record- ed the voltages and currents In this example the frequency of 180 Hz was recorded over 1 minute and 40 seconds. -
Page 76: Pq Events
11.5.9 PQ Events With the "PQ Events" tab, all violations of the specified limits are displayed. With the button, the detailed list of the PQ events with time point and extreme values is displayed. With the button it is possible to display all the voltage events as an ITIC representation. All deviations from the nominal voltage in duration and amplitude are displayed graphically. - Page 77 Using WinPQ mobile / Settings / General, these statistics from Evaluation to NRS 048 (South Africa PQ standard).
-
Page 78: Data Export - Interval Data
11.5.10 Data export – Interval data Using "Settings / Export“, it is possible to set basic parameters for the measurement data export. The decimal point separator in a German Windows is a comma; in the English-language Windows it is a full stop. - Page 79 In the following menu, all measurement values can be selected and exported with the "Export" button to a file. Using "Save", various selection for data export can be saved (e.g. file export of all harmonics). With load already stored files can be opened. Any name can be specified for the export file.
- Page 80 Example of an export file in MS Excel: The order of the selected data in data export is automatically the order of columns in the export file. In CSV export you will have the minimum - and maximum - RMS output with the exact time stamps. The time format for CSV Export can be changed in general settings for export data Also, the Short Time Flicker (PST) and the Long time Flicker (PLT) have it’s own time stamps regardless of...
-
Page 81: Additional Functions
With the feature “Fill gaps” measurement interruptions will be filled with zero values. 11.5.11 Additional functions Using the "Window / Split" menu item it is possible to display all previously selected evaluations togeth- er in an overview. - Page 82 The "information" and "Measurement data overview" fields can be closed to give more space for the evaluation graphics. These can be re-displayed with the "View" field. "Measurement data over- view" close field...
- Page 83 Comparing two separate measurement files. During an evaluation, it is possible to open another measurement, start level-time charts and standard evaluations, display them next to one another in an image and compare them. Figure: Two separate measurements displayed next to one another (2 x EN50160 report;...
-
Page 84: Pq-Box Limits And Settings
PQ-Box Limits and Settings With the Setup“ ïcon you can change the device parameters, trigger conditions and limits. Loads the current settings from the network analyser to PC screen Sends currently displayed settings to the PQ-Box Opens a template file of settings, which has previously been stored on the PC Saves a setup file to the PC Resets displayed settings to default values. -
Page 85: Setup - Basic Settings
12.1 Setup - Basic Settings In the Basic Settings menu, settings such as the network configuration, nominal volt- age and transmission ratio of current and voltage transformers are set. Voltage configuration: • 1 wire system (single phase L1) • 3 wire system (insolated network) •... - Page 86 It is possible to describe the measurement/setup with user defined text (up to 32 characters). After the measurement is done, this text can be found in “Comment 2”. The PQ-Box bases all trigger thresholds and PQ events on the set “Nominal voltage”. The contractually agreed voltage should be specified as the nominal voltage in all network configura- tions, e.g.
- Page 87 Data recording of PQ-Box The resulting data size can be strongly influenced at this point. Only voltage In this setting, no currents and power values are recorded. The amount of data reduced to about 40%. Only Basic data In “Basic data” no harmonics, interharmonics or phase angle of harmonics will be recorded.
- Page 88 Measurement values in basic data: Status, Events, Flagging Frequency values (mean, extreme) Voltage values (mean, extreme) Flicker Current values (mean, extreme) Power values (mean, extreme) Ripple signal voltage THC, K-Factor, Phaseangle, symmetrical components Distortion power, Power factor Spannungsabweichung, Symmetrie, PWHD PWHD, PHC current cosPhi, sinPhi, tanPhi, power values fundamental Reactive power fundamental...
- Page 89 Transducer factor voltage and current In the converter settings the transmission ratio of current and voltage transformers to which the net- work analyzer is connected is entered. Example: Voltage: primary = 20,000 V; secondary = 100 V; Conversion factor UL1 = 200 Current: 100 A / 5 A = Conversion factor 20 Setting of Power measurement...
-
Page 90: Setup - En50160 / Iec61000-2-2 / Iec61000-2-4 Limits
12.2 Setup – EN50160 / IEC61000-2-2 / IEC61000-2-4 Limits In this menu item, all the limits from the EN50160 and IEC61000-2-2 standard are present. The compatibility levels can be changed by the user. Using the button, all the limits are reset to the standard values. 2nd to 25th Harmonic 26th to 50th Harmonic EN50160... - Page 91 button enables different configurations stored on the PC to be opened. The IEC61000-2-4 limit files for industrial networks are also stored in the templates. With the icon any number of settings templates can be stored for the PQ-Box 200. THD calculation The THD calculation of voltage and current can be changed in the settings: 2 –...
-
Page 92: Oscilloscope Trigger Settings
12.3 Oscilloscope trigger settings In the "Oscilloscope" menu item, trigger criteria can be set for the oscilloscope. In the de- fault setting an RMS value threshold of +10% and -10% of the nominal voltage is set. If a field is greyed out and not checked, this trigger criterion is not active. - Page 93 Explanation of the trigger conditions If the trigger thresholds are indicated in "%", this value refers to the nominal voltage set in the setup, e.g. 20,300 V or 400 V. Starts a trigger recording on exceeding the set trigger threshold. Trigger bases are the 10 ms RMS value.
-
Page 94: Period Rms Recorder
12.4 ½ period rms Recorder In the "rms (1/2 period)" menu item, trigger criteria can be set for the rms recorder. In the default setting an rms value threshold of +10% and -10% of the nominal voltage is set. Only the threshold values with a tick are active, trigger conditions without ticks are not switched on. Explanation of the trigger conditions additional to oscilloscope trigger 12.3: The ½... -
Page 95: Automatic Trigger
12.5 Automatic Trigger The automatic trigger function for the oscilloscope recorder and half period recorder can be separated enabled or disabled. If enabled, the PQ-Box changes independently for all enabled trigger thresholds, in case of a too sensi- tive threshold. This prevents the recording of unnecessarily large amounts of data. The "automatic trigger"... -
Page 96: Ripple Control Signal Analysis
It is possible to enable or disable this recorder PQ-Box with licensed/active optional “Ripple Signal Recorder” can be identified by the LCD display (6 Screen) showing “+S” after the PQ-Box 150 type. The ripple control recorder can generate large amounts of data and should be turned on... -
Page 97: Scheduled Operation
12.7 Scheduled Operation Programming the PQ-Box through a time command It is possible to start and stop the PQ-Box using a predefined time command. Example: The PQ-Box should switch on at the 27 Dec. 2017 at 15:00 o´clock and strop at 1 Jan. -
Page 98: Pq-Box 150 Firmware Update
In the "Update" menu the firmware of the network analyzer can be updated or the PQ- Box can be assigned with a license code with more functions. Sequence for a PQ-Box 150 update: 1) Connect the power to the PQ-Box (power supply) -
Page 99: Pq-Box License Update
12.9 PQ-Box License Update Using the button, with the measurement device connected, the serial number of the PQ- Box is displayed. Enter the license code in the "License Code" field by specifying the directory or using the keyboard. If the license code matches the serial number of the device, the field "Update License" is activated. -
Page 100: Merging Partial Measurements Into A Combined Measurement
13.2 Merging partial measurements into a combined measurement Using the Data Converter-program, individual partial measurements can be merged into one combined measurement. 1) Open the measurement file to be changed with "Load“ 2) Mark two or more data files 3) With "Combine" these measurement files will be merged and saved in a new measurement file. -
Page 101: Online Analysis: Pq-Box & Pc
Online Analysis: PQ-Box & PC Using the "Online analysis" function, RMS values, oscilloscope images, harmonics, interharmonics, and current flow direction of the harmonics can be displayed online on the screen of a PC or laptop. The data displayed will be refreshed in the second intervals. The online measurement is possible during a current measurement, before a started measurement and after a completed measurement, All real time data screens can be started and stopped with the icons:... -
Page 102: Online - Fft - 20,000 Hz
With the "Spectrum" measurement function, all of the harmonics and interharmonics for voltages and currents are displayed online. PQ-Box 150 - DC to 10.000 Hz There is the possibility to choose between two FFT calculation methods in the online software: 0 - 3.000 Hz: calculation procedure according to IEC 61000-4-30 class A (Grid synchro-... - Page 103 Maximum values logging FFT Using this function it is possible to hold the maximum value of the spectral lines of online FFT. (Dashed line). With this function it is possible to determine direct in online view which maximum values of harmonics or interharmonics exists direct during one measurement period.
-
Page 104: Online - Harmonics
14.3 Online - Harmonics From the "Harmonics" tab page, all of the current and voltage harmonics (2nd to 50th) can be displayed online. The measurement data is calculated by the measuring device in accordance with IEC61000-4-30 Class A and transferred to the PC. Tab page –... -
Page 105: Online - Interharmonics
14.4 Online - Interharmonics From the "Interharmonics" tab page, all of the current and voltage interharmonics up to 2,500 Hz can be displayed online. The measurement data is calculated by the measuring device in accordance with IEC61000-4-30 Class A following the grouping process and transferred to the PC. Tab page - Interharmonics Explanation of the grouping process in accordance with the IEC: To evaluate the interharmonics in the network, subgroups are created. -
Page 106: Online - Frequency Bands 2 Khz To 9 Khz (Option)
14.5 Online – Frequency Bands 2 kHz to 9 kHz (Option) From the "2 to 9 kHz" tab page, all of the current and voltage harmonics shown in 200 Hz-groups. The centre frequency is always indicated. Example: All frequencies from 8,805 Hz to 9,000 Hz are located in the 8.9 kHz band. -
Page 107: Online - Direction Of The Harmonics
14.6 Online – Direction of the Harmonics From the "Harmonics Direction" tape page, the current flow direction of the harmonics at the measuring point is displayed. A positive value (+) represents a direction of current flow from the network to the consumer (in this example, the 5th harmonic). - Page 108 Example: At one connections point with several consumers should be analyzed, whether the 5 harmonic will be added or subtracted. In our example customer A has 92A and customer B has 123A 5 harmonic current. Together with the phase angle of the current harmonic, it is possible to calcu- late complex the result with 55,5A.
-
Page 109: Harmonic Power And Phase Angle
14.7 Harmonic power and phase angle Phase angle and power values of harmonics 2nd to 40th order number listed on the screen below Phase angle of the voltage harmonic relative to fundamental of the voltage Phase angle of the current harmonic relative to fundamental of the voltage Real power harmonics (W) Reactive power harmonics (Var) Apparent power harmonics (VA) -
Page 110: Online Level-Time Diagram
14.8 Online Level-Time Diagram In the "Online level-time diagram", the voltages, currents and performance can be monitored over an adjustable period (1, 3, 5 or 10 minutes). Using the right mouse menu, the scales can be adjusted or the image copied to the clipboard. With the "Clear Display"... -
Page 111: Online - Measurement Value Details
14.9 Online - Measurement Value Details From the "Details" tab page, the active, reactive and apparent power of the single-phase and three- phase values are also displayed online, as well as the power factor and phase angle of the fundamental oscillation of the network. -
Page 112: Online - Phasor Diagram
14.10 Online - Phasor Diagram Using the Phasor Diagram function, the voltages and currents are plotted graphically with their magni- tude and phase angle. -
Page 113: Power Triangle
14.11 Power Triangle On the "Power Triangle" tab page, all performance values are shown in a three-dimensional graphic. It in each case a power triangle is displayed for each phase and for the overall network performance. The graphic displays the individual power values once for the total RMS value as well as for the funda- mental oscillation values. -
Page 114: Online Status Pq-Box
14.12 Online Status PQ-Box In “Online status PQ-Box” the state of the power quality analyzer can be queried via a remote connec- tion. Duration of the current measurement Number of fault records in the current measurement Used memory of the device Free memory of the PQ-Box Local date and time of the device... -
Page 115: Measurement Data - Pq-Box 150
Measurement Data – PQ-Box 150 PQ-Box 150 Cyclic Measurement Values Note: The interval corresponds to the freely selectable measurement interval (1 sec up to 30 min) For each cyclic measurement interval there are 5604 bytes of recording data. If the memory space is reserved for cyclic data f. - Page 116 Flicker levels Pst / Plt The Short term flicker levels P (10 min) and Long tern flicker levels P (2 h) are calculated for the star and delta voltages. P and P are defined in EN 61000-4-15: 2010. The measuring interval of the Pst is set to 10 minutes fix and is independently from the free intervall.
- Page 117 PWHD - Partial Weighted Harmonic Distortion The partial weighted THD calculates the 14th to 40th harmonics. ∑ ⋅ PWHD PHC - Partial Odd Harmonic Current The PHC is calculated from the odd current harmonics n = 21..39. ∑ K Factor The values of the K-factors for phase currents are calculated from the corresponding RMS values C the harmonics n = 1..40.
- Page 118 Harmonics / Interharmonics The determination of the harmonics and interharmonics interval values displayed using the methods of the IEC61000-4-30 Class A standard based on 10/12 period values. The PQ-Box 200 recognizes for all voltage and current channels, respectively, the harmonics up to the 50th ordinal.
- Page 119 Reactive power / Reactive energy In the setup of the PQ Box 200 two variants of the power calculation are adjustable a) Simplified power calculation Reactive power without unbalanced reactive power calculation: = Q L1+ Q L2 + Q L3 ∑...
- Page 120 Power Factor PF In electrical engineering the power factor or active power factor is calculated as the ratio of real power P to the apparent power S. The power factor can be between 0 and 1. The ration is expressed in the following equation: Power Factor PF: λ...
- Page 121 Apparent Power - S In the setup of the PQ Box 200 two variants of the power calculation are adjustable Simplified power calculation power calculation according DIN40110 part 2 Conductor apparent power 4-wire system: ⋅ LNrms Lrms Conductor apparent power 3-wire system: ⋅...
- Page 122 Active Power - P The sign of the active power corresponds with the flow direction of the fundamental oscillation active energy (+: supply, - : consumer). The values of the conductor - active power are calculated from the samples of a synchronisation cycle. 2048 ∑...
- Page 123 Symmetric Components The complex symmetrical components are calculated from the corresponding complex spectral compo- nents of the fundamental oscillations of the phase voltages and phase currents. Phase voltage in a 4-wire system = Phase-to-Neutral voltage Phase voltage in a 3-wire system = Phase-to-Ground voltage Positive sequence: ⋅...
-
Page 124: Maintenance/Cleaning
Frankenstraße 160 D-90461 Nuremberg Calibration We recommend a calibration interval of three years for the network analyzer PQ-Box 150 & 200 to maintain the accuracy of GEFOR-made-IEC61000-4-30 Class A instruments. Disposal To dispose of the device and its accessories, send all components to A-Eberle. -
Page 125: Product Warranty
For accessories like current clamps and the battery the period is one year. This warranty does not cover damage caused by accident, misuse or abnormal operat- ing conditions. To obtain service during the warranty period, please contact A-Eberle GmbH & Co KG in Nuremberg. - Page 126 A. Eberle GmbH & Co. KG Frankenstraße 160 D-90461 Nuremberg Tel.: +49-(0)911-62 81 08-0 Fax: +49 (0) 911 / 62 81 08-99 E-Mail: info@a-eberle.de http://www.a-eberle.de No. 584.0841 Vers. PQ Box 150 – 21/03/2018...
Need help?
Do you have a question about the PQ-Box 150 and is the answer not in the manual?
Questions and answers