
Summary of Contents for Luzchem SPR-02
- Page 1 Spectroradiometers Instruction manual SPR-01 and SPR-02 Version 2.3 August 2004 © Copyright Luzchem Research, Inc.
-
Page 2: Table Of Contents
Table of Contents 1. Initial set-up ......................3 1.1. Model SPR-01..................... 3 1.2. Model SPR-02..................... 3 2. Understand your hardware................... 4 2.1. Detector head ....................4 2.2. Spectrometer ....................5 2.3. Fiber optic cable..................5 2.4. Attenuator ....................6 2.5. Verification lamp (model SPR-01 only) ............. 6 3. -
Page 3: Initial Set-Up
• The control module that with its built-in detection head (light integrating module) • A USB cable SPR-02 is sold fully assembled. Only the USB cable needs to be installed and connected to the computer. Software installation is explained in Section 3 of this manual. -
Page 4: Understand Your Hardware
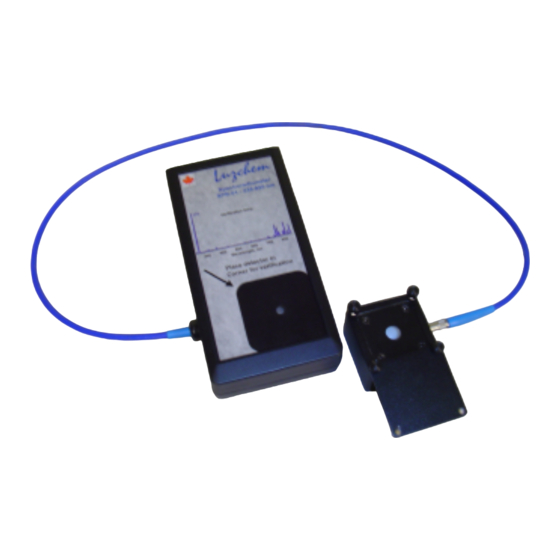
Figure 1.2: Spectroradiometer models SPR-01 (left) and SPR-02 2. Understand your hardware 2.1. Detector head Figure 2.1 shows the assembly of the detector head or light integrator. The detector is constructed of PTFE encased in light scattering aluminum and has been designed for maximum efficiency in a low-profile integrator. -
Page 5: Spectrometer
2.3. Fiber optic cable The fiber optic cable, connecting the spectrometer to the detector head is an integral part of your instrument (it is fully enclosed in the spectroradiometer model SPR-02), and instrument calibration is dependent on the fiber used. -
Page 6: Attenuator
A generic transmission curve is supplied with all attenuators. Luzchem can perform a custom NIST traceable calibration for the attenuator supplied with the system. For many applications the attenuator is not essential; however, for some solar and sunbed applications, the attenuator may be useful to increase the dynamic range of the instrument. - Page 7 If the problem is not resolved by this, it could be an indication of a ruptured fiber; in this case, contact Luzchem for advice. Lamp usage for verification purposes normally does not exceed a few minutes, and batteries last about 12 hours of actual usage.
-
Page 8: Software Instruction Manual
Verification lamp discharge monitored at 254 nm 10000 20000 30000 40000 Time, seconds Figure 2.5. Verification lamp discharge curve monitored at 254 nm. 3. Software Instruction manual 3.1 General The purpose of this Section is to provide training on the acquisition and viewing of spectra. -
Page 9: Starting The Software
3.2.2.1 Navigate to the Start>Settings>Control Panel>Add New Hardware 3.2.2.2 Follow the instructions on the screen 3.2.2.3 Insert the Luzchem CD, and the operating system will find and install the appropriate driver 3.2.2.4 To install the application follow the directions in part a. -
Page 10: Power/Intensity Spectra
“Browse” button or type in the path to the calibration file: Figure 3.2: Selection of a calibration file other than the Luzchem file built into the control software. 3.5.8 The calibration file must be a per-millisecond text file with the following format: •... - Page 11 • Line 13…: Wavelength w2 (tab) Calibration at w2 • A one nm wavelength interval is required. Also, a calibration wavelength should exist for each wavelength in the acquisition. If a desired wavelength does not exist in the calibration file, the resulting waveform will produce a zero at that wavelength.
-
Page 12: Data Reliability Evaluation
The data are shown in grey when they do not meet the significance criterion set in the optimize tab. If should be noted that Luzchem sets a very high standard as a default; users should set values that meet their own requirements. This is done in the “Optimize”... -
Page 13: Timed Acquisition
the number of averages, and ensure that the dark measurement totally prevents light from reaching the detector. In the UVC region it is possible that some light sources or materials eliminate all light at the short wavelength range, such as wavelengths below 250 nm. - Page 14 • Set hibernation to “Never” – Please be aware that some operating system will not have a hibernation option. • Click “Apply” and/or “OK” to save the settings and exit the power management window. To perform a timed acquisition: 3.7.1 If desired, optimize the integration time by following the steps outlined in the Optimize Integration Time section.
-
Page 15: File Formats
3.7.14 The entire timed acquisition can be converted to a power file. This can be done by choosing an appropriate calibration file. (Either Luzchem’s supplied calibration, or a user calibration file.) Next, press the “Convert to Power” button to calibrate all of the data. - Page 16 Line 5 Serial number of spectrometer Line 6-9 Line 10 “Wavelength” (tab) “Intensity” (tab) “Power” Line 11 Wavelength w1 (tab) Intensity data at w1 (tab) Power data at w1 (if applicable) Line 12… Wavelength w2 (tab) Intensity data at w2 (tab) Power data at w2 (if applicable) In an intensity file the column for ‘power data’...
- Page 17 Line 10 “Spectrum at time:” time at which spectrum was extracted Line 11 “Wavelength” (tab) “Intensity” (tab) “Power” Line 12 Wavelength w1 (tab) Intensity at w1 (tab) Power at w1 (if applicable) Line 13… Wavelength w2 (tab) Intensity at w2 (tab) Power at w2 (if applicable)
-
Page 18: Help
Help To access the in-program help, click on the “Help” button, or navigate to Help > Topic Help on the menu bar.
Need help?
Do you have a question about the SPR-02 and is the answer not in the manual?
Questions and answers