Table of Contents
Advertisement
Advertisement
Table of Contents

Subscribe to Our Youtube Channel
Summary of Contents for attension Theta
- Page 1 Theta User manual – OneAttension Optical Tensiometer Revision 1.0...
-
Page 2: Table Of Contents
Table of Contents INTRODUCTIONS ............... 1 1.1 Purpose of this manual ............1 1.2 Physical description ..............2 BRIEF INSTRUCTIONS .............. 4 2.1 Installation ................4 2.2 Calibration ................4 2.3 Sessile drop contact angle experiments ........4 2.4 Pendant drop experiments ............5 2.5 Curve fitting and data analysis .......... - Page 3 6.3 Theory of surface free energy ..........65 TECHNICAL SPECIFICATIONS ..........70 CONTACT INFORMATION ............71...
-
Page 4: Introductions
In addition to the basic measuring unit, Theta can be equipped with the following components, for a full list of the available accessories please see our website at www.attension.com. -
Page 5: Physical Description
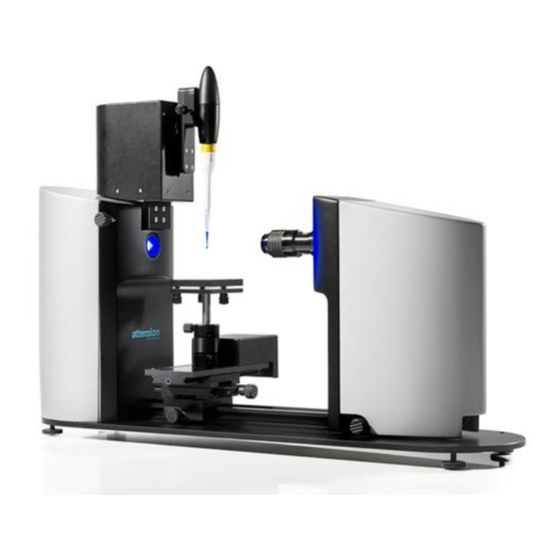
For information on the installation of Theta and OneAttension please see the separate Installation Manual. Physical description This section describes the physical construction of Theta. The figure below illustrates the hardware of Theta. Figure 1.1. Theta physical features. 1) Stage level adjustment... - Page 6 1550 fps. A FireWire cable runs from the body of the instrument to the camera and another attaches Theta to a computer. The FireWire card can be installed in any free slot on a computer. The resolution used is 640 x 488 pixels for 60 fps camera and 640 x 336 pixels for 1550 fps camera.
-
Page 7: Brief Instructions
Mechanical installation Place Theta on a vibration free table in an area where local air currents are at a minimum. Connect a camera (FireWire) and USB cable between the computer and the Theta unit and a power cord from the mains to the back of the unit. -
Page 8: Pendant Drop Experiments
(#13). Change the syringe needle to a hook needle and attach the filled syringe to the syringe clamp (#11). From the main Theta tab choose the Pendant drop experiment. Image recording Fill in the relevant data in the recipe sheet. -
Page 9: Surface Free Energy Experiments
3. General operation instructions Software overview The OneAttension software that runs Theta has an easy and user-friendly interface. When starting the OneAttension program (located by default on the desktop and in the Start menu under Programs>OneAttension) first time, you are able to choose User Manager option (Figures 3.1—3.5) and frame rate of the Basler camera (Figure 3.2). - Page 10 Figure 3.2. The first launch will give you an option to use User Manager. Figure 3.3. In case the User Manager option is chosen the administrator will be created. Figure 3.4. Create username and password for the administrator. Figure 3.5. Login with the created username and password in the OneAttension software. The OneAttension software is a windows based program whose format will be easily learned by most users familiar with windows based software.
- Page 11 Instrument home tab: This tab is named after the Attension hardware you have connected to your PC and therefore it does not show if no device is connected. Your Theta tensiometer is programmed to perform a series of experiments, which can be modified to suit your particular needs. The instrument home tab window shows all experiment icons and by clicking an icon, a new measurement can be started.
- Page 12 Analysis tab: After an experiment has been performed you can return to the data for further analysis. Select the experiment you would like to analyze from the analysis tab. After you have selected the experiment you desire, the data for that experiment will be displayed. You then have the option of viewing and editing the recipe.
- Page 13 Probe database: This is the section of the software in which the menu of choices for the Sigma force tensiometer probes filled into the recipe is created and edited. Not utilized with Theta optical tensiometers.
- Page 14 Figure 3.10. System diagnostic tool bar, from which the automatic single liquid dispenser can be calibrated. User settings in the Setup tab will allow to manage the user properties as follows: Change current user’s settings: Enable to select the path for each user, where the measurements will be saved.
-
Page 15: Calibration
(Figure 3.11). After this the latest calibration time is shown in this buttom. With the manual construction the calibration can be performed in the Theta home tab. If you need to adjust the automatic devices by the software, please choose preferred experiment type by clicking Sessile drop, Pendant drop, Meniscus or Pulsating drop icon from the Theta home tab (Figure 3.11), and then perform the... - Page 16 Figure 3.12. Choose the calibration method and accept the dimensions of the calibration tool. There should now be a green line around the image of the calibration ball showing the curve that was fitted on it and screen showing the calibration factor (Figure 3.13). Theta is now calibrated. Press OK to finish.
-
Page 17: Setting Up An Experiment
Setting up an experiment Preliminaries Theta instrument has four experiment types that can be run with it, those being Sessile drop, Pendant drop, Meniscus and Pulsating drop experiments. From the data obtained through Sessile drop experiments a further type of analysis, Surface free energy, is also available. - Page 18 Figure 3.14. Setup tab and global settings. Start the experiment Choose the preferred experiment type by clicking the experiment icon. After this automated devices will automatically initialize their locations. Sessile drop experiment Pendant drop experiment Meniscus experiment...
- Page 19 Pulsating drop experiment Make sure that all the equipment to be used with the experiment are cleaned, usually performed by rinsing with ethanol and distilled water. Attach the needle (or other equivalent object) to the syringe clamp (#11 on figure 1) and tighten the clamp. Bring the solid sample stage to the appropriate position so that for ...
- Page 20 Figure 3.15. Recipe sheet. Created recipes can be loaded or saved by clicking the Recipe Manager button as shown in the Figure. The Recipe parameters are as follows: Generic Experiment name: a name needs to be given for your experiment. This also makes the recognition of the experiment easier later on, when browsing experiments for further analysis.
- Page 21 Live analysis Do live analysis: Enables real-time result analysis. Results are shown in the Live analysis-screen in the lower part of the tab. Analysis mode: Drop-down menu enabling to choose preferred analysis (i.e. fitting) mode. Use Autobaseline: Enables to use automatic baseline in the live analysis. Flip Y: Needs to be chosen if a hooked needle is used.
- Page 22 After Materials the recipe sheet will include separate parameters for all the automated devices, which are connected in the system. These parameters as well as device control options for automated devices will be explained in the Chapter 4. When the recipe sheet has been filled, the experiment can be started from Controls. Start button starts the experiment according to all experimental parameters filled in the recipe sheet.
- Page 23 Figure 3.16. Monitor and console tabs. Note! Setup window is not available, after the experiment type has been chosen. Click the home button (up right corner of the experiment tab) to quit the current experiment to move to the setup window again.
- Page 24 Figure 3.17. Live contact angle results. Figure 3.18. Recording the images of contact angle measurement on the curved surface. Pendant drop experiments In pendant drop experiments adjust the drop size as large as possible and then record the image(s) as shown in Figure 3.19.
- Page 25 Theta instrument can be used to investigate cylindrical shapes such as rods or fibers as well as shapes that are not symmetrical about their axis such as plates. For the sake of convenience for the rest of this section of the manual the solid sample will be referred to as a rod, but keep in mind that plates, fibres, etc.
-
Page 26: Useful Tips
Lighting: The lighting system for Theta provides ideal illumination for sharp image capture. The brightness of the image may be adjusted with the Adjust camera parameters. Note that the image need not be a bright one to get good results, indeed in most bright lighting situations the highlights present on the drop may detract from the ability to model the curve profile accurately. - Page 27 These graphs are used to characterize the wetting behavior. Use of Theta on-screen trigger and fast recording mode are recommended in situations where the imbibing is rapid.
-
Page 28: Operation Of Additional Modules
A connection cable is supplied with each hardware module which must be connected to the AUX or Ext 1/0 inputs on the Theta interface unit shown in Figure 4.1. When only one additional hardware module is attached, it must be connected to the AUX1 port only. When two additional hardware modules are attached, they must be connected to AUX1 and AUX2 ports only. - Page 29 Connect the serial cable to the port of the motorized liquid dispenser holder (See Figure 4.3) and then to the AUX1 port of Theta interface unit with the cable supplied. Figure 4.3. The connection ports in the automatic dispenser movement/holder.
- Page 30 Figure 4.4. Device controls for the automated dispenser holder/movement. Stop: Stops all movement Up: Moves the dispenser holder upwards Down: Moves the dispenser holder downwards Stroke: The needle tip is moved down from the current position to just above the surface and back.
-
Page 31: B) Automatic X Sample Stage
Sequencer utility allows multiple drops on a sample to be measured automatically. Figure 4.5. Automatic X sample stage. Plug in the serial cable to be connected between the automatic X sample stage and the Theta. Connect the serial cable to the port of the automatic X sample stage and then to the AUX X port of Theta interface unit with the cable supplied. - Page 32 In the experiment tab the software will automatically provide the device controls (Figure 4.6). In the recipe sheet speed of the movement, step size and initialization (i.e. center) dimensions can be adjusted. Point mapping option will open a Single point mapper window to see the coordinates set measurement points in case the sequencer is used.
- Page 33 Moves the dispenser holder to the home position Initializes the equipment Add to list: Add the current location to the sequencer list Drive though: Drives through the locations set in the sequencer list by Add to list function Automatic sequencer: Open the Sequencer generator window, which enables to set N amount of measurements points with defined distance in X direction, when automatic dispense holder, dispenser and X sample stage are used.
-
Page 34: C) Automatic Xyz Sample Stage
X sample stage. The stage attaches to the optical rail. Figure 4.8. Automatic XYZ sample stage. Plug in the serial cable to be connected between the automatic XYZ sample stage and the Theta. Connect... -
Page 35: Automatic Dispensers
Figure 4.9. Automatic single liquid dispenser. Place the dispenser on the table next to the Theta. Place the plastic syringe piston inside the Hamilton 1ml syringe. Place the syringe in the groove and turn the plastic cover clockwise to the horizontal, 'closed,' position. - Page 36 Drop Out Size: Volume of drop dispensed when Drop Out is pressed. Drop In Size: Volume of drop retracted when Drop Out is pressed. Drop Rate: Rate of Drop Out or Drop In dispensing. Disp Rate: Rate of dispensing when Dispense is pressed. Fill Rate: Rate of filling when Fill is pressed.
- Page 37 Dispense: Dispenses liquid at the rate defined in the Disp rate field. Zero Disp.: Zeros the current volume reading. Calibrating the dispenser The automatic single liquid dispenser should be calibrated before use. Click Device calibration in the setup tab and the System Diagnostics window will appear (Figure 4.11). Select Dispenser0 and click Calibrate.
-
Page 38: B) Disposable Tip Dispenser
Ensure that the Theta is turned off for this procedure. After assembly re-tighten the thumb screw. In the experiment tab the software will automatically provide the device controls and recipe sheet parameters, which are the same as those for the automatic single liquid dispenser. -
Page 39: C) Multiliquid Dispenser
This is important, as the syringes will be emptied when Theta is turned on. Connect the pump module to the dispenser holder. Turn the dispenser on first, and then Theta. - Page 40 Figure 4.14. Global settings. The first time after the experiment tab is opened the motorized actuators (needle array, dispenser holder and sample stage) are initialized by moving to a limit switch. This is why it is important to have no measurement chambers/attachments in place since this might lead to a mechanical collision.
- Page 41 Figure 4.15. Device controls and recipe sheet parameters for multiliquid dispenser.
-
Page 42: D) Picoliter Dispenser
Place the additional light source by pressing it on the current LED light source (#12, Figure 1.1) and connect the cable to the Ext Light port of the Theta (Figure 4.1). Plug in also the power cable of the control unit. - Page 43 Figure 4.17. Connections of the control unit of the picoliter dispenser. Control unit Turn on the control unit. Wait until a Start buttons appears at the bottom right of the screen. Press Start. If the third button from the top says Cont. then press it once to change it to Burst. If the fourth button from the top says Intern then press it once to change it to Extern.
- Page 44 Figure 4.18. Calibration of the picoliter dispenser. After the calibration, adjust the dispenser head in the preferred position and fire a drop from the picoliter dispenser’s device controls (Figure 4.19). It might be necessary to adjust the focus by using test droplets.
-
Page 45: Electrically Heated Temperature Control Unit
Theta interface unit with the cable supplied. The chamber is connected on the back of the temperature control unit (see Figure 4.20). If temperature probe (TCP) is used, connect it on the back of the Theta to the Temp. port. - Page 46 An insulating ceramic base plate with the heating plate and a cable for connecting to the heater port. The bottom of the ceramic base plate is made so that it fits perfectly on the sample stage of Theta. Environmental chamber (made of aluminium) with glass windows and a lid with a hole for the needle.
- Page 47 Use of the TCU After connecting the cables, the TCU is ready to use with Theta. Turn on both Theta and the TCU. Place the ceramic base plate on Theta sample stage so that the thick red cable is located behind the instrument.
-
Page 48: Tilting Cradle
Figure 4.23. Automated tilting cradle. The automated tilting cradle consists of a frame that supports Theta on an axle turned by a motor on one end and a pivot on the other. The motor is driven by the OneAttension software to turn Theta at precise speeds to defined angles. - Page 49 Stop: Stops all movement Sets the home position, which is defined by the user Moves the tilting cradle to the home position Initialize the equipment Theta tilts clockwise from the point of view of the tilting motor. Theta tilts anti-clockwise.
-
Page 50: Pulsating Drop
Theta. Use a leveling tool to locate the position in which Theta is horizontal, this should occur at roughly eight degrees from the initialization position. When Theta is perfectly horizontal (adjust the legs of the frame as necessary), press Set home from the device controls. - Page 51 PD 200 and then to the AUX X port of Theta with the cable supplied. Then connect the pump to the control unit of the PD 200, after which PD 200 is ready to use.
- Page 52 Recipe sheet: Measurement points: Several frequencies can be measured automatically during one recording. From the Measurement points the Triple point mapper (Figure 4.28) will appear, where the wait time (s) before the first frequency and between the different frequencies, Frequences (Hz) for each measurement point and number of amplitude cycles can be adjusted.
- Page 53 Figure 4.29. Pulsating drop experiment tab during the measurement. Curve fitting and basic Data analysis is done in the same way as with a normal Pendant drop experiment (see Chapter 5), make sure that volume is calculated since this information is used in the analyses. The PD200 complements surface / interfacial data with visco-elastic characteristics of surface / interfacial layers.
- Page 54 Figure 4.30. Analysis tab of the PD 200 experiment. Figure 4.31. Calculated results...
- Page 55 Figure 4.32. Graph of the analyzed surface tension and drop area as a function of time. Figure 4.33. Graph Oscdrop results function to draw a graph of the oscillation results as a function of the frequencies.
- Page 56 Figure 4.34. Oscdrop result graph as a function of the used frequencies. Upgrading high-speed camera (1550 fps) If you have purchased high-speed (1550 fps) camera upgrade, please contact your local Attension support representative or submit a support enquiry on the Attension website for further installation...
-
Page 57: Analysis
5. Analysis Curve fitting and data analysis The curve fitting and data analysis is done in Analysis tab after the images have been recorded in the experiment tab. In curve fitting the profile of the drop is converted into a curve from which surface tension and/or contact angle can be calculated. - Page 58 The red line shown in the image is the baseline, which denotes the level of the solid or liquid surface for Contact angle and Meniscus experiments and the tip of the needle for Pendant drop experiments. Automatic baseline has been chosen to be the default setting; however some surfaces (e.g. very rough surfaces) may demand to set the base line manually, when the Use automatic baseline need to be disabled from the Data Analysis.
-
Page 59: Data Handling And Storage
Figure 5.3. Curve fitting and data analysis examples. In the image A, contact angle is calculated on the curved surface. In the image B, a drop is fitted by the pendant drop measured. A hooked needle was used and thus the Flip Y is enabled. In the image C, the baseline is set manually on the liquid surface in the meniscus analysis. - Page 60 Graph: To create a graph there are several graphing options. To select the values of the axis, right click the analyzed results and then select the axix from the Graph wizard window. You can either select to draw the graph from whole range of data points or just the selected range by selecting the option from the Graph wizard window.
-
Page 61: Surface Free Energy Calculations
Figure 5.4. By right clicking the image in the Analysis tab, the recorded images can be saved either as separate picture, which can be selected by the frame selector, or as video. Surface free energy calculations In surface free energy (SFE) calculations, data from Sessile Drop experiments is utilized to calculate the surface free energy of the solid. - Page 62 Figure 5.6. Send the chosen contact angle value to SFE analysis tab. After the SFE analysis tab includes all the preferred data points, press Calculate and the results will appear in the lower part of the tab (Figure 5.7). The available SFE models include: Zisman, OWRK / Extended Fowkes, Wu, Acid Base, Equation of State, Simple Fowkes, Schultz 1 and Schultz 2.
-
Page 63: Theory
6. Theory Theory of contact angle measurements Definition Contact angle, , is a quantitative measure of the wetting of a solid by a liquid. It is defined geometrically as the angle formed by a liquid at the three-phase boundary where a liquid, gas and solid intersect. - Page 64 Attension’s Theta removes this problem by using computer analysis of the drop profile to generate consistent contact angle data. The software can fit the Young-Laplace equation to the shape of the drop accurately by using all of the points on the drop profile. The tangent is assigned as the gradient of the Young-Laplace equation where it intersects the baseline.
- Page 65 Work of Cohesion: the work required to separate a liquid into two parts, it is a measure of the strength of molecular interactions within the liquid. It is given by: Work of Spreading: the negative free energy associated with spreading liquid over solid surface. Also referred to as the Spreading Coefficient it is given as: Wetting Tension: the wetting force normalized for length.
-
Page 66: Theory Of Surface Tension Measurements
Theory of surface tension measurements Definition Surface tension is a measurement of the cohesive energy present at an interface. All of the molecules of a liquid attract each other. These interactions of molecules in the bulk of a liquid are balanced so that equal forces attract them in all directions. - Page 67 Pendant drop shape analysis The shape of a drop hanging from a syringe tip is determined from the balance of forces that include the surface tension of that liquid. The surface or interfacial tension at the liquid interface can be related to the drop shape through this equation.
- Page 68 Further reading Adamson, A. W., Physical Chemistry of Surfaces, Wiley&Sons (1976) Wu, S., Polymer Interface & Adhesion, Marcel Dekker, N.Y. (1982) Couper, A., Investigations of Surfaces and Interfaces - Part A, B. Rossiter, R. C. Baetzold eds, Phys. Meth. Chem Ser vol XI A (1993) Hansen, F.
- Page 69 . The total free surface energy is then the sum of its two component forces. The method labeled Simple Fowkes in Theta SFE software calculates just the dispersive component of the surface free energy, based on one or more measurements with non-polar liquids: ...
- Page 70 where refers to surface tension (surface free energy), the subscripts l and s refer to liquid and solid, and the superscripts d, + and - refers to dispersive, acid and base components respectively. There are then three equations with three unknowns which can solve for sd, s+ and s-. The total surface free energy of the solid is then given by: s = sd + sAB , where sAB = 2(s+ s-)1/2...
- Page 71 However, numerical least-squares fitting can be used to obtain . These methods (linear regression and least-squares fitting) are used in Theta SFE calculation method Schultz 1. Schultz 2 is a method similar Schultz 1 with the difference that the contact angle liquid is non-polar and...
- Page 72 References W.A.Zisman, ACS Adv. Chem. Ser. 43, 1 (1964). J. Schultz, K. Tsutsumi and J.-B. Donnet, J.Colloid Interface Sci 59, 272 and 277 (1977). D. Li and A. W. Neumann, J.Colloid Interface Sci 148, 1, pp.190200 (1991).
-
Page 73: Technical Specifications
7. Technical specifications Maximum sample Unlimited x 150 x 45 mm (l x w x h). size 0.65 ms…1000 s, the number of fast images depends on the camera used, Frame interval standard camera has 60 fps but optional camera has up to 1550 fps. Camera FireWire camera with telecentric optics and 55 mm focus length. -
Page 74: Contact Information
8. Contact information If any problems arise please feel free to contact a local distributor or Attension directly. Attension can be contacted from this address: Attension Tietäjäntie 2 FI-02130 Espoo Finland Tel. +358-(0)9-5497 3300 Fax +358-(0)9-5497 3333 E-mail info@attension.com for sales requests support@attension.com for service or technical support and maintenance...
Need help?
Do you have a question about the Theta and is the answer not in the manual?
Questions and answers