
Summary of Contents for ZH instruments SM-30
- Page 1 Magnetic susceptibility meter SM-30 USER’S MANUAL Publication Date: June 2010...
- Page 2 ADDRESS Zdeněk Hůlka ZHinstruments Kárníkova 22 621 00 Brno Czech Republic Tel. + Fax: +420 - 541634297 GSM.: +420 - 603795973 E-mail: zhinstruments@email.cz Web: www.zhinstruments.cz...
-
Page 3: Table Of Contents
1.GENERAL INFORMATION ............4 1.1 Application................4 1.2 Specification ................ 5 2. DESCRIPTION OF INSTRUMENT .......... 6 2.1 General description ............... 6 2.2 Operating principles .............. 7 2.2.1 Basic modes A and B ..............8 2.2.2 Extrapolation mode ................ 9 2.2.3 Interpolation mode .............. - Page 4 3.3 Measuring susceptibility of rock ..........15 3.3.1 Basic modes A, B ................15 3.3.2 Extrapolation mode ..............16 3.3.3 Interpolation mode ..............17 3.3.4 Scanning mode ................19 3.3.5 Averaging mode ................21 3.4 Memory registers ..............22 3.5 Battery replacement ............24 3.6 Communication with computer ..........25 3.6.1 General information ..............
- Page 5 4.6 Figure 6 ................35 4.7 Figure 7 ................36 5.APPENDICES ..............37 5.1 SM30 software ..............37 5.2 SM30 programme for Windows 95/98/NT/2000 .......37 5.2.1 Running the program ..............37 5.2.2 Reading memory registers ............38 5.2.3 Communicating with the computer on-line ........38 5.2.4 Handling the charts ..............
-
Page 6: General Information
1.GENERAL INFORMATION 1.1 Application The SM-30 meter is intended for measuring the magnetic susceptibility of rock. Owing to its high sensitivity, it is capable of measuring rock with a very low susceptibility. It can also measure diamagnetic substances. The meter reaches its peak sensitivity within a very few seconds after switch-on. -
Page 7: Specification
1.2 Specification SENSITIVITY…………………………………………………………………………………….1x10-7 SI Units MAX MEASURED VALUE…………………………………………………………………………………..….1SI DIMENSIONS……………………………………………………………….……………..100 x 65 x 25 mm WEIGHT………………………………………………………………………………………….……………0.150 kg OPERATING FREQUENCY………………………………………………………………………………..…8kHz MEASUREMENT TIME …………………………………………………………………………………….basic mode approx. 5s …………………………………………………………………..drift correction modes approx. 8s DIGITAL DISPLAY………………………………………………………………….LCD 4digit,10mm high CONTROLS…………………………………………………………………………………………3 push buttons DATA MEMORY………………………………………………………………….up to 250 measurements PICK-UP COIL SIZE 50 mm in diameter OPERATING TEMPERATURE……………………………………………………………..-20 C to +50... -
Page 8: Description Of Instrument
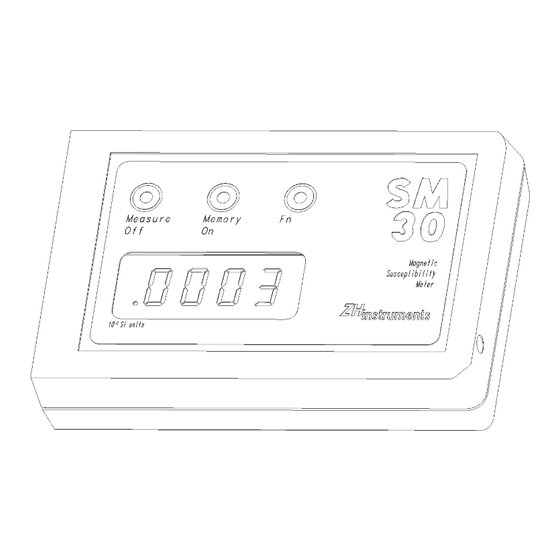
2. DESCRIPTION OF INSTRUMENT 2.1 General description The susceptibility meter is enclosed in a box, which has a front panel with push buttons and a four-digit 10mm character display. In order to get the right value in SI, the user must multiply the reading by a constant 10 Behind the front panel there is a buzzer, which monitors by way of acoustics the operation of the meter. -
Page 9: Operating Principles
Two steps are performed without rock and one is performed with rock. The SM-30 meter offers two ways of correcting the drift. The first mode is called extrapolation mode or mode 2. -
Page 10: Basic Modes A And B
The second mode is called interpolation mode or mode 3. When measuring places that are situated very close to one another, it is best to use scanning mode. This mode corrects the thermal drift as well and the measurement is very quick, although the drift correction is not so precise as in the extrapolation or interpolation mode. -
Page 11: Extrapolation Mode
The SM-30 has two basic modes A and B. The only difference between modes A and B is in the length of the pick-up and compensation steps. The basic mode B has these steps 4 times faster than mode A. Mode B is suitable for measuring medium and high susceptibility. -
Page 12: Interpolation Mode
The correction of drift is performed automatically according to the last equation. After the first compensation step is finished, the display shows first the uncorrected value. After the second compensation step is finished, the value is corrected and the display shows the value 2.2.3 Interpolation mode This method requires that the user put the meter near rock during the second step. -
Page 13: Averaging Mode
after each pickup step the susceptibility value, calculated similar to the Basic mode. This calculation takes into consideration the value measured during the first compensation step fc1. The susceptibility is stored in the operation memory of the processor together with the time elapsed since the first compensation step (see Figure 5). - Page 14 The advantages of the interpolation method can be seen in the equations in 2.2.2 and 2.2.3. A comparison of both calculations shows that the Interpolation mode requires the result to be divided by -2. This means that the value is twice as precise as with the extrapolation method.
- Page 15 object object object measurement measurement measurement resolution & & & [SI Units] init. init. init. - - - - - rock free air basic modes A & B - - - - - press left button press left button extrapolation rock free air free air...
-
Page 16: Operation
3. OPERATION 3.1 Switching instrument ON and OFF The meter is switched on by pressing the middle button. The meter displays within 0.2 seconds of switchon the mode number used before the meter was switched off. After the button is released, the last susceptibility value is displayed and the buzzer gives a short beep. -
Page 17: Setting And Indication Of Mode
The meter switches itself off after no button has been pressed for three minutes. The meter gives a beep to indicate switchoff. 3.2 Setting and indication of mode By pressing the right button first and then pressing the left button without releasing the right one the user can display the number of mode according to the table in the previous chapter. -
Page 18: Extrapolation Mode
approximately 2 seconds. After the pickup step is finished, the buzzer goes silent and the number of the memory register prepared to store the value is displayed. Now the operator removes the meter from the rock and presses the left button. The buzzer is emitting a high-pitched beep. -
Page 19: Interpolation Mode
Now the operator removes the meter from the rock and presses the left button. The buzzer is emitting a high-pitched beep. After the button is released, the meter is performing the first compensating step, which means frequency measurement away from the rock. During the frequency measurement the buzzer is giving a low-pitched beep and the three middle horizontal segments are displayed. - Page 20 meter is performing the first compensating step, which means frequency measurement away from the rock. During the frequency measurement the buzzer is giving a low-pitched beep and the three middle horizontal segments are displayed. The first compensating step is approximately 2 seconds long. The buzzer goes silent when this step is finished and the number of the memory register prepared to store value is displayed.
-
Page 21: Scanning Mode
3.3.4 Scanning mode If necessary, switch the instrument into the Scanning mode, indicated by -4-- The operator removes the meter from the rock and presses the left button. The buzzer is emitting a high-pitched beep. After the button is released, the meter is performing the first compensating step, which means frequency measurement away from the rock. - Page 22 The number indicates that the measurement is the second in the block. Analogically, it is possible to measure more places. The maximum number of measurements is 20. Finally, the operator removes the meter away from the rock and by pressing the middle button initiates the second compensating step. After the second compensating step is finished, the display shows the difference between the first and second compensating steps, or the drift during the measurement.
-
Page 23: Averaging Mode
3.3.5 Averaging mode If necessary, switch the instrument into the Averaging mode, indicated by -5-- The operator removes the meter from the rock and presses the left button. The buzzer is emitting a high-pitched beep. After the button is released, the meter is performing the first compensating step, which means frequency measurement away from the rock. -
Page 24: Memory Registers
(fig. 7a,d dotted line). 3.4 Memory registers The SM-30 meter has 250 memory registers to store the measured data. In addition, the meter always stores the value measured before switchoff and it automatically displays this value after switchon. - Page 25 The memory registers are named R1, R2,..., R250. The memory register is chosen using Register pointer RP. The contents of the RP are available for use. The memory registers can be used as follows: 1. Saving. The displayed value obtained during the last measurement is saved by pressing the middle button.
-
Page 26: Battery Replacement
3. In order to delete the registers the user must press the right button and then press the remaining two buttons without releasing the right one. The RP is set to 1 and the contents of all registers are deleted. Four dots are displayed when a deleted register is read. -
Page 27: Communication With Computer
3.6 Communication with computer 3.6.1 General information The instrument can be connected to a computer by a special cable, which is delivered as part of the package. The computer end of the cable has a 9-pin Canon connector. The communication is 9600 Bd. The computer software must set the output (positive) and the output (negative). -
Page 28: Transfer Of Data To Computer
"v" asks for the software version. 3.6.3 Transfer of data to computer The meter automatically sends the currently displayed data to the serial channel. For further use in the text let us define the term <data> as a string of ASCII characters having the form -xxx.xxxxx in the case of a negative figure (10 byte) and xxx.xxxxx... - Page 29 b) Reading obtained in the Drift correction mode M<data1><space> ..M<data2><LF> The dots stand for the elapsed time. M000.006<space> M-000.002<LF> c) Saving data in a memory register W<reg>I<data><LF> W03I-023.123<LF> If there is memory overflow, the character "O" is sent instead of the data. d) Reading a memory register R<reg>I<data><LF>...
-
Page 30: Error Messages
G<reg>I<data><LF> - measured data GE<LF> - signifies end of the data block of the scanning mode eg. GB<LF> G100I000.452<LF> G101I000.401<LF> G102I000.392<LF> GE<LF> It is impossible to switch on the meter using a computer or to read the last measured value, displayed right after switchon. 3.7 Error messages ... - Page 31 OL - The instrument is overloaded - the measured susceptibility exceeds the limits of the meter (i.e. measured value > 1 SI). - 29 -...
-
Page 32: Figures
4 Figures 4.1 Figure 1 - 30 -... -
Page 33: Figure 2
4.2 Figure 2 - 31 -... -
Page 34: Figure 3
4.3 Figure 3 - 32 -... -
Page 35: Figure 4
4.4 Figure 4 - 33 -... -
Page 36: Figure 5
4.5 Figure 5 - 34 -... -
Page 37: Figure 6
4.6 Figure 6 - 35 -... -
Page 38: Figure 7
4.7 Figure 7 - 36 -... -
Page 39: Appendices
5. APPENDICES 5.1 SM30 software programme supplied with SM30 instrument that supports communication with a personal computer. The programme can import data from the SM30 memory registers and both of them can also control SM30. The up-to-date version SM30W can visualize the collected data in a chart and can be used for testing noise and temperature stability of the instrument. -
Page 40: Reading Memory Registers
The smaller window on the right-hand side will start to display the data that are being transferred from SM-30. When all 250 registers have been read, the register pointer is set to 1. At the same time, the collected data are visualized in a chart. -
Page 41: Handling The Charts
charts are shown: one of them displays the data collected in mode 1 and the other displays the data collected in mode 2 or 3. The numerical values are shown in the right-hand side window. During on-line tests, data are fed to the computer with the resolution of 10 5.2.4 Handling the charts The length of a chart can be 100 or 250 points. -
Page 42: Saving The Data
The Properties option allows the user to choose a chart colour. It also allows the user to hide the selected charts. The View menu allows the user to hide the table with numbers on the right-hand side of the panel. 5.2.5 Saving the data Collected data may be saved on the hard drive for later use. -
Page 43: Finite Thickness Layer Correction
5.3 Finite thickness layer correction Thickness [mm] Percentage of reading [%] 12.46 23.02 32.02 39.71 46.39 52.18 57.19 61.60 65.41 68.81 74.42 78.83 82.35 85.15 87.42 89.27 90.82 92.07 93.14 93.98 95.65 96.72 - 41 -... -
Page 44: Conductivity Effect
The table also helps to find out the effect of thickness of the additional air gap. Example: Suppose the rock with thickness 20mm and air gap between SM-30 and the rock layer 2mm. The reduction of the reading is: 89.27% - 23.02% = 66.25%... - Page 45 Conductivity [S/m] Apparent susceptibility [SI units] 0.000 0.001 0.010 0.100 1.000 10.00 -0.0029x10 100.0 -0.0917x10 - 43 -...
-
Page 46: The Demagnetisation Factor Correction
5.5 The demagnetisation factor correction 1,05 0,95 0,85 0,75 0,65 0,55 0,45 0,35 0,25 0,15 0,05 0,05 0,15 0,25 0,35 0,45 0,55 0,65 Measured value [SI unit] - 44 -... -
Page 47: Drill Core Correction Factor
The function is piecewise linear with 14 stages. 5.6 Drill Core correction factor The SM-30 instrument can be used for measuring susceptibility of drill cores. The measured value must be multiplied by the correction factor, CF. The correction factor depends on: ... - Page 48 The rows 1..3 (0.001, 0.01, 0.1 [SI]) show that the dependency of the correction factor on the demagnetization effect is not significant. It means that the choice of the correct row is not critical. Core Diameter 30 mm Core Length [mm] Kappa [SI] 0,001...
- Page 49 Core Diameter 40 mm Kappa Core Length [mm] [SI] 0,001 2,06436 2,06443 2,06494 2,08481 2,12394 2,26061 0,01 2,06606 2,06613 2,06393 2,08636 2,12530 2,26165 2,08257 2,08264 2,06562 2,10133 2,13838 2,27174 2,21304 2,21306 2,21193 2,21547 2,23602 2,34731 Core Diameter 45 mm Kappa Core Length [mm] [SI] 0,001...
- Page 50 Core Diameter 50 mm Kappa Core Length [mm] [SI] 0,001 1,80740 1,80748 1,80806 1,82814 1,86462 1,98599 0,01 1,80870 1,80878 1,80676 1,82930 1,86563 1,98678 1,82136 1,82144 1,82196 1,84048 1,85396 1,99442 1,91899 1,91898 1,91880 1,92341 1,94646 2,05230 Core Diameter 55 mm Core Length [mm] Kappa [SI] 0,001...
- Page 51 Core Diameter 60 mm Kappa Core Length [mm] [SI] 0,001 1,64998 1,65008 1,65074 1,67108 1,74057 1,81743 0,01 1,65103 1,65113 1,65178 1,67199 1,70651 1,81805 1,66135 1,66131 1,66190 1,68080 1,71415 1,82416 1,73836 1,73832 1,73806 1,74500 1,76963 1,87142 Core Diameter 65 mm Kappa Core Length [mm] [SI] 0,001...
- Page 52 Core Diameter 70 mm Kappa Core Length [mm] [SI] 0,001 1,54423 1,54434 1,54508 1,56561 1,59887 1,70381 0,01 1,54511 1,54522 1,54596 1,56637 1,59952 1,70433 1,55360 1,55369 1,55435 1,57359 1,60578 1,70939 1,61697 1,61691 1,61663 1,62566 1,65123 1,74962 Core Diameter 75 mm Kappa Core Length [mm] [SI] 0,001...
- Page 53 Core Diameter 80 mm Core Length [mm] Kappa [SI] 0,001 1,46830 1,46843 1,46926 1,48991 1,52207 1,62186 0,01 1,46755 1,46768 1,46852 1,48928 1,52152 1,62143 1,46035 1,46049 1,46142 1,48322 1,51626 1,61715 1,40930 1,40962 1,41144 1,44122 1,47905 1,58299 Core Diameter 85 mm Core Length [mm] Kappa [SI] 0,001 1,43787...
- Page 54 Core Diameter 90 mm Core Length [mm] Kappa [SI] 0,001 1,41141 1,41156 1,41246 1,43318 1,46441 1,56038 0,01 1,41076 1,41091 1,41182 1,43263 1,46394 1,56000 1,40449 1,40466 1,40566 1,42741 1,45942 1,55632 1,36032 1,36067 1,36259 1,39122 1,42709 1,52591 Core Diameter 95 mm Core Length [mm] Kappa [SI] 0,001 1,38774...
- Page 55 Core Diameter 100 mm Core Length [mm] Kappa [SI] 0,001 1,36691 1,36707 1,36804 1,38878 1,41928 1,51194 0,01 1,36634 1,36650 1,36748 1,38830 1,41887 1,51162 1,36081 1,36099 1,36207 1,38373 1,41493 1,50841 1,32202 1,32242 1,32439 1,35202 1,38642 1,48106 - 53 -...
- Page 56 Position of the drill core when measured by SM-30 instrument. DRILL CORE - 54 -...