
Summary of Contents for Terraplus KT-10 v2
- Page 1 KT-10 v2 Magnetic Susceptibility, Conductivity and Combined Magnetic Susceptibility / Conductivity Meter with User’s Guide Ver. 2.1 Phone: (905) 764-5505 Fax: (905) 764-8093 Web: http://www.terraplus.ca...
- Page 2 KT-10 v2, KT-10 v2 Plus, KT-10 v2 C, KT-10 v2 Cx, KT- 10 v2 S/C, KT-10 v2 Plus S/C, or KT-10 v2 Plus S/Cx. All of these models are available with either a circular or rectangular coil. The basic KT-10 v2 can also be upgraded to include extended magnetic susceptibility, conductivity and/or extended conductivity measurements.
-
Page 3: Table Of Contents
Features Page 10 Layout Page 13 Controls Page 14 Menus Page 15 Icons Page 16 Chapter 3: Operating the KT-10 v2 Battery Installation Page 17 Power Page 18 3.2.1 Power On Page 18 3.2.2 Power Off Page 18 Setup Menu... - Page 4 Scanner Page 32 3.5.1 Take a reading Page 32 3.5.2 Store a Reading Page 34 3.5.3 Measurement Sub Menu Page 35 3.5.4 Scanner Flow Chart Page 37 3.5.5 Scanner Sequence Page 38 Borehole Measure mode Page 39 3.6.1 Borehole Configuration Page 39 3.6.2 Scanner setup Wizard Page 41...
- Page 5 Note about switching off Page 103 Meter turns off during measurement Page 103 “Error” on screen Page 104 Maintenance Page 105 Contact Technical Support Page 105 Appendix A: KT-10 v2 Plus feature Page 106 Appendix B: Advice & Recommandations Page 114...
- Page 6 This page is intentionally left blank.
-
Page 7: Chapter 1: Introduction
The KT-10 v2 is best utilized for obtaining accurate and precise measurements from outcrops, drill cores and rock samples. The KT-10 v2 is capable of measuring uneven rock surfaces and is well suited for automated drill-core logging with a digitally recorded scanning mode. -
Page 8: Operating Principles
Our method is based on the analysis of this change. 1.2.2 Operating principle The KT-10 v2 utilizes a 10 kHz LC oscillator with an inductive coil to measure the magnetic susceptibility and conductivity. Magnetic susceptibility is calculated from the frequency difference between the sample and free air measurements, while conductivity is calculated from the difference in amplitude between the two. -
Page 9: Specifications
Chapter 2 The KT-10 v2 S/C 2.1 Specifications Susceptibility Sensitivity: 1x10 SI Units Conductivity Sensitivity (optional): 1 S/m Susceptibility Range: 0.001 x 10 to 1999.99 x 10 Conductivity Range (optional): 1 - 100,000 S/m Units Auto-Ranging Operating frequency: 10 kHz... -
Page 10: Chapter 2: The Kt-10 V2
2.2 Features The KT-10 v2 has many features that make it stand out in the crowd of available hand held magnetic susceptibility & conductivity meters, and they are as follows: Multiple Configuration Capability (optional)* The KT-10 v2 can be upgraded to include conductivity measurements. With this upgrade it can be configured as a simultaneous magnetic susceptibility/conductivity meter, a magnetic susceptibility meter, or a conductivity meter. - Page 11 Variable Audio When used in the Scanner Mode, the KT-10 v2 meter’s loudspeaker allows the operator to monitor the variation in the Magnetic Susceptibility and Conductivity measurements with a variable audio tone, which reflects the relative intensity of the reading. In the combined mode, Susceptibility &...
- Page 12 10 v2’s memory along with the readings. Bluetooth can also be used to download readings from the unit along with the voice streams to a computer. Alternately, one can also pair the KT-10 v2 to an Android running smart phone to obtain Real Time Scanner Profile.
-
Page 13: Layout
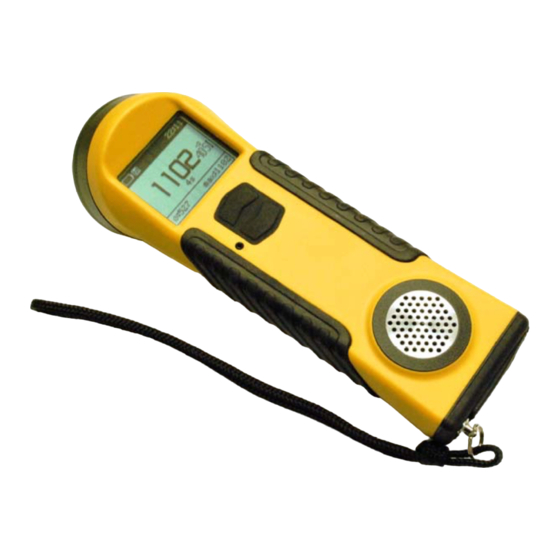
2.3 KT-10 v2 Layout LCD Graphic Display Microphone Loud Speaker Oscillator Coil Associated Button Up/Down Battery Port & USB Communication Figure 1: KT-10 v2 Layout (KT-10 S/C shown) -
Page 14: Controls
2.4 Controls To control the KT-10 v2, there is one button with associated UP/DOWN functions. There are five different options to use this button and they are as follows: UP Button ▲ DOWN Button ▼ Figure 2: Control Button Short Button Press UP –... -
Page 15: Menus
Figure 4). Figure 4: Main Menu Measure and Scanner are the two modes of operation for the KT-10 v2. Selecting one of these options will activate the measurement routine for that mode. Setup is used to configure mode, date & time, core size selection, connection of Bluetooth GPS unit, and battery type selection along with calibration information. -
Page 16: Icons
2.6 Notification Icons There are several icons used on the KT-10 v2, which are displayed in the top bar of the instrument, known as the notification area. The time and battery indicator are displayed in this location and are displayed permanently during operation of the instrument. Below you will find a list of the other icons you will see used on the meter and the meaning for each of them. -
Page 17: Chapter 3: Operating The Kt-10 V2
5. Attach the rubber protective cover back in position. Note: If you are going to store your KT-10 v2 for long a period of time, please remove the batteries from the unit to prevent damage from electrolyte leakage. It is also recommended that you visually inspect the batteries after any long storage interval. -
Page 18: Power
3.2 Power 3.2.1 Power ON To power the unit ON, use SBP▲. An introductory screen (seen below in Figure 6) accompanied by a melody will be presented. Figure 6: Power On 3.2.2 Power OFF To power the unit off, use LBP▲... -
Page 19: Setup Menu
3.3 Setup Menu The Setup menu contains several different parameters to configure the KT-10 v2’s operation. The selections in this menu are: Mode, Core Diameter, Measure Units, Date/Time, Accessories, Advanced, and Main Menu. To navigate to the desired parameter use the SBP▼... - Page 20 Sucs: Enables the meter for susceptibility measurements. Along with susceptibility results, user can obtain data average and standard deviation values in the measure mode and data average and maximum values in the scanner mode (Seen in Figure 10). # of readings Average Std. Deviation Average Scanner Max Figure 10 : (a) Measure Mode...
- Page 21 Susc+Cond This mode will enable the meter to read both susceptibility and conductivity simultaneously. In this mode, measurement of magnetic susceptibility is considered primary reading and the results of the primary readings are displayed in large text. User can obtain data average and standard deviation values in the measure mode and data average and maximum values in the scanner mode.
- Page 22 The KT-10 v2 is equipped with a PIN for rough surface measurements. To enable the meter in the PIN mode, PIN must be selected. Figure 14: PIN mode Core Diameter Contains a list of the different core diameter sizes that can be selected; both standard North American and non-standard diameters are available.
- Page 23 Date/Time: To set date and time on the KT-10 v2, in a 24 hour format. Figure 17: Date/Time Accessories Allows for configuration of the GPS and Battery type. Figure 18: Accessories Select GPS: Entering this option will start a search for Bluetooth capable GPS units. A search screen will be presented and when all the Bluetooth enabled devices have been detected, a list of all named Bluetooth devices will be displayed.
-
Page 24: Main Menu
Advanced Provides access to the meter Calibration and QA parameters. Figure 19: Advanced Show raw data: A debug tool that monitors the frequency & amplitude of the measuring coil; this feature is primarily used at the factory. Borehole mode The Borehole mode allows user to integrate depth information to the data being collected in both the Measure and the Scanner mode. -
Page 25: Measure
3.4 Measure Selecting Measure from the main menu will initialize the KT-10 v2 for a single measurement. In this mode, measurements can be obtained with (measurement of a core) or without geometric corrections to the readings. Measurements without geometric corrections to the readings are best utilized for quick recognisance of rock samples or outcrops with no specific geometry. - Page 26 Step 3: Then immediately position the KT-10 v2 in free air once again for the final free air measurements. Wait for the final sound, which will be the same as the first tone heard in Step 1.
-
Page 27: Storing A Reading
With PIN PIN Installation: Remove the thread protection screw from head of the KT-10 v2. Install the PIN in the place of the thread protection screw. Ensure that the PIN is threaded all the way into the housing. Remember to enable the PIN mode in the Setup menu. - Page 28 Figure 22: Voice Record Once the recording has ended, it will be replayed if the KT-10 v2 has been enabled to do so; this will allow its contents to be confirmed. User can then store or discard the voice note.
-
Page 29: Measurement Sub Menu
3.4.3 Measurement Sub Menu The measurement menu can be accessed with SBP▼ only when the results are displayed on the screen (shown in Figure 25). This menu allows for storing of the reading, storing of the reading with a voice record, returning to the measure routine, disabling the GPS positions when GPS is enabled, clearing of the average buffer or returning to the main menu. -
Page 30: Measure Flow Chart
3.4.4 Measure Flow Chart MAIN MENU Measure Sequence Start Measurement LBP▲ (Figure 27) Setup SBP▲ Measure _ _ _ _ _ _ Scanner Return to Main LBP▼ Shutdown SBP▼ Start Measure Menu Measure Core Back to Measurement Start Measurement without Storing Readings Sequence (Figure 20) Screen SBP▲... -
Page 31: Measure Sequence
■■■■▫▫▫▫▫▫ ■■■■■■■▫▫ AIR MEASUREMENT IN PROGRESS AIR MEASUREMENT HAS BEEN FINISHED SAMPLE MEASUREMENT HAS BEEN POSITION THE KT-10 v2 TO YOUR SAMPLE COMPLETED. MOVE METER FROM SBP ▲ AND TRIGGER WITH SAMPLE INTO FREE AIR AND WAIT UNTIL THE MEASUREMENTS ARE DISPLAYED. -
Page 32: Scanner
Figure 28: Start Scanner This icon in the notification area indicates that a core diameter has been selected for susceptibility measurements. Conductivity measurements are not corrected for core size. The KT-10 v2 is now ready to start the measurement process in Scanner mode. - Page 33 120 seconds unless stopped with the use of SBP▼. To start the measurement process follow the steps listed below. Ensure your KT-10 v2 is on the screen presented in Figure 28 and is positioned in free space void of all metallic objects first.
-
Page 34: Store A Reading
To store the reading with an optional voice record use LBP▼. This will invoke the voice recorder and the screen shown in Figure 29 will be displayed. Position the KT-10 v2 about 10 cm from your mouth and speak at a normal volume. You can end the voice record by using either SBP▼... -
Page 35: Measurement Sub Menu
When a reading is stored, by either method, a confirmation will be displayed. It will show the record number, date and time along with any GPS positions available (if the optional Bluetooth GPS is enabled). Figure 31: Saved Record 3.5.3 Measurement Sub Menu The measurement menu can be accessed only when the results are displayed on the screen;... - Page 36 To store the reading, navigate to the Store option with the use of SBP▼ SBP▲ select it by using LBP▼ LBP▲ once it is highlighted. To store the reading with a voice record, navigate to the Store with note option with the use of SBP▼...
-
Page 37: Scanner Flow Chart
3.5.4 Scanner Flow Chart Scanner Sequence MAIN MENU SBP▲ Start Measurement (Figure 34) _ _ _ _ Measure ▲ ▼ SBP▼ Return to Main menu Scanner Start Scanner Back to Measurement Screen Setup Shutdown Scanner Sequence Back to Measurement (Figure 27) Start Scanner without Current Values Screen LBP▲... -
Page 38: Scanner Sequence
3.5.5 Scanner Sequence BEEP 1 BEEP 2 BEEP 2 BEEP 2 SAMPLE SBP▲ SBP▼ SBP▲ SBP▲ ADDS A ADDS A ADDS A STOP AIR MEASUREMENT IN PROGRESS MARKER IN MARKER IN MARKER IN SCANNER APPROXIMATELY 0.5 SECONDS DATA DATA DATA STREAM STREAM STREAM... -
Page 39: Borehole Measure Mode
3.6 Borehole mode The Borehole mode option will initialize the KT-10 v2 for measurements on drill cores along with borehole parameter such as the Borehole ID, Start depth, End depth, Core length, # of Cores per box, and Depth interval. Geometric corrections applied to the magnetic susceptibility and conductivity readings to display true measurement values. - Page 40 Borehole type 3) Borehole type New borehole: - used to create a new borehole options Last borehole: - uses last borehole options; this option is only active when a previously created borehole is not fully completed. For any event the new borehole is not finished, the last borehole is used to resume measurements.
-
Page 41: Scanner Setup Wizard
3.6.2 Scanner mode setup wizard Use the LBP▲ to select the Scanner mode. The Scanner setup wizard will be activated as shown below. 1) BoreHole ID Use the alpha-numeric to enter identification for the borehole BoreHole ID 2) Start Depth Enter the starting depth of the core Start Depth 3) End Depth... - Page 42 4) Core Length Enter the length of core Core Length 5) Cores per Box Enter the number of cores that are in a core box # of Cores in a Box 6) Depth Interval Enter depth interval for the core Depth Interval The Borehole setup wizard is now completed;...
-
Page 43: Scanner Measurement
120 seconds unless stopped with the use of SBP▼. To start the measurement process follow the steps listed below. Ensure your KT-10 v2 is positioned in free air space void of all metallic objects before proceeding with measurement. - Page 44 Step 3: Begin to move the KT-10 v2 along the surface you wish to measure. The meter’s loud speaker will indicate the relative intensity of the reading by the loudness of the audio. To insert a depth interval in the data set, use SBP▲.
- Page 45 Borehole Status The borehole status window provides the current status of the borehole measurement. As entered in the Borehole setup wizard, the Borehole ID is TP-00, Start Depth is 0m, End Depth is 10m, Core Length is 2m, # of cores in Box is 5 and Depth interval of 0.25.
-
Page 46: Discrete Mode Setup Wizard
Borehole completed – cannot save new record 3.6.4 Discrete mode setup wizard This mode is useful to those how only wishes to obtain single measurement at fixed depth on borehole cores. The sequence for the discrete mode remains the same as described in the section 3.4.1 for the Measure mode. -
Page 47: Discrete Mode Measurement
2) Start Depth Enter the start depth of the core Start measure 3) Depth Interval Enter the depth interval as desired Depth Interval 3.6.5 Taking a measurement in Discrete mode Start Measure – Discrete mode After completion of the borehole setup wizard, the screen above will be displayed indicating that the meter is ready to start the measurement process. - Page 48 Step 3: Immediately position the KT-10 v2 in free air once again for the final free air measurements. Wait for the final sound that will be the same as the first tone heard in Step 1. This sound will indicate the final free air measurements are complete and the reading(s) will be displayed on screen.
-
Page 49: Voice Recorder
(Figure 25 on page 29). Select Store with note and the voice recorder will begin immediately. For best recording, the KT-10 v2 should be positioned approximately 10 centimetres from the operator’s mouth, and a normal speaking volume should be used. -
Page 50: Pin Installation
There will be a single PIN located in the carrying case at the time of purchase, located near the back left as seen below (Figure 35). PIN Storage Figure 35: KT-10 v2 Pouch PIN Storage Note: A spare PIN can be purchased and carried in the KT-10 v2 Pouch as shown in Figure 35. - Page 51 PIN Rubber protector Figure 36: PIN Remove the thread protector screw from the head of the KT-10 v2. Coil Cap PIN Thread Protector Screw Figure 37: Coil Cap & Thread Protector...
- Page 52 When the thread protector have been removed, insert the KT-10 v2 PIN into the center hole where the thread protector came from, seen in the image on the left. Coil Cap and PIN installed...
-
Page 53: Chapter 4: Software
GeoView is an easy to use Windows ™ based GUI (Graphical User Interface) which allows for data on a KT-10 v2 to be downloaded, stored and viewed on a Windows PC. It also supports data export functionality which allows the KT-10 v2 data to be converted into an ASCII file format that can then be easily imported into database or spreadsheet software. -
Page 54: Usb Driver Installation
The setup file contains installation packages for the GeoView Software, the firebird database, and the USB drivers for the KT-10 v2. If this is the first time connecting your KT-10 v2 to your PC it is recommended to install the drivers first, and then install GeoView software. - Page 55 Figure 42. Figure 42: Complete Driver Installation At this time, plug the KT-10 v2’s USB cable into the computer to have windows recognize the drivers and copy the files to the appropriate location. Windows will respond by showing you that a new USB device has been recognized. The new hardware wizard will start.
- Page 56 Figure 44: Install Automatically Select Install software automatically and then press Next> button. The drivers will start to be copied to the windows/system32/drivers folder but you may be warned that the drivers have not passed Windows Verification. Figure 45: Start File Copy Select Continue Anyways...
- Page 57 Figure 46: Continue Anyways The files will then be copied to your PC and you will be able to establish communication between your PC and the KT-10 v2. Figure 47: Driver Files Copied GeoView Installation When selecting Install Georadis GeoView, you will be presented with the screen as seen...
- Page 58 Figure 48: Begin GeoView Installation You will then be prompted for the location of the installation directory. You may either leave this as default (C:\Program Files\Geoview) or use the browse button to find a new directory to install the GeoView software too. Select Next> when the correct path has been chosen.
- Page 59 Figure 50: Folder and Installation Confirmation An installation progress window, seen in Figure 51, will then be presented which is followed by a confirmation dialogue, seen in Figure 52. Selecting Finish completes the installation process. Figure 51: Install progress window Figure 52: GeoView Installation Complete...
-
Page 60: Geoview Calendar Interface
53. When GeoView is first opened, a calendar is presented to the user, seen in Figure 54. This allows for the KT-10 v2 data to be organized by the date it was collected on, which allows for the quick retrieval of data from previous recordings. - Page 61 Figure 55: Create Local Database Open local database: - This will open an already created local database which contains data from one or many KT-10 v2 units. Select the database file that you wish to work with and then select open.
- Page 62 Open remote database: - This will open an already created remote database which contains data from one or many KT-10 v2 units. Fill in the server name, path to the database file and then press the open button to connect to the database.
- Page 63 Device settings. Each of the functions is listed below. Connect device: - Connect your Personal Computer to a KT-10 v2 with a USB cable or via Bluetooth connection. There is also an icon for quick access to this function and it can...
- Page 64 Options: - This selection allows for additional fields to be added to the database. These new fields will be stored along with your KT-10 v2 readings. More details on this option are further explained starting on page 71. There is an icon on the main window for quick access to this function and it can be seen below.
- Page 65 To start adding data to the Geoview software, a database must be created for the storage of the KT-10 v2 data. This is accomplished by navigating to the file menu seen in Figure 62 and then selecting either Create local database or Create remote database. (Most...
-
Page 66: Geoview Data Interface
4.1.3 GeoView Data Interface Switching to data view changes the bottom three quarters of the screen only, with all icons and menus still available while in the data view or calendar view. To switch back to the calendar view, select the calendar tab directly above the displayed date. Below this you will see the data view window and we will now get familiar with this part of the interface. -
Page 67: Data Download
Once you have the database created and connected, you can then download data from your KT-10 v2 and store it on your PC. To accomplish this, connect your KT-10 v2 to your PC via the USB cable provided or by performing a Bluetooth pairing between your PC and KT-10 v2 unit. - Page 68 Figure 68 will be presented. Figure 68: Synchronising with Device GeoView will synchronize with the KT-10 v2 to determine how much data is on the device that is also not currently in the GeoView database. At this point the data will be downloaded and the dialogue box display will show the details of the operation.
-
Page 69: Data Export
When data is loaded into the GeoView database, the day in which data is stored on will change its color to indicate that data is present for that day. When the cursor is over that day an icon will be shown for the instrument and the serial number will also be present. - Page 70 Figure 71: Data Export A list of units in the database will be presented with a check box beside each unit serial number, populate the box for each unit the data is to be exported from. Then select a date range, if desired, and choose the folder location for the data to be exported too.
- Page 71 Custom fields can be added to the database which will be appended to the end of each reading this information will also be exported along with the stored KT-10 v2 data. There are three types of data that can be added to the database and these are: Integer numbers, Real numbers and String data.
- Page 72 Figure 75: Field type Selection Select the field type from the pull down list and select next. The next dialogue window will allow for you to enter the particulars for the field depending on the type selection. The different windows can be seen in Figures 76, 77, and 78. Figure 76: Integer field setup Figure 77: Real number field setup Figure 78: String Setup...
- Page 73 Figure 79: Custom Fields added to GeoView Databae Once you have added the fields into the Program options window, press the close button at the bottom and the database will be updated with the new fields. The new fields will be appended to the end of the default columns.
- Page 74 Figure 81: Scanner Data Plotted & Charted To control the scanner graph use the icons to the right of the graph window, seen in Figure 81 and 82. There are four zoom function buttons, and three scale buttons. The first of the zoom buttons, which is located at the top of the graph control pane, is used to zoom on a selected section.
-
Page 75: Borehole Mode Data Display
The borehole ID and the data filed are editable. Clicking on the data field will unlock the field for editing. Please note that changes made into the GeoView database are not updated in the KT-10 v2. -
Page 76: Device Settings
Entering the Device options, allows for settings on your KT-10 v2 to be changed or saved. The KT-10 v2 will have to be connected to the PC for this menu to be accessible. Settings that can be changed with this menu are as follows: Sound, PC Authorization, GPS Pin, GPS, Shutoff timer, Automatic voice note replay, Battery selection and Time synchronization. - Page 77 Select the read records button to have GeoView list all readings currently stored on your KT-10 v2. Highlighting a record and pressing the delete record, will remove it from the meters’s memory. Delete all records will format the complete memory on the KT-10 v2 and all data will be lost.
-
Page 78: Firmware Upgrade
Figure 86: Maintenance 4.1.8 Firmware Upgrade Firmware upgrade utility permits the user to install new firmware on their KT-10 v2 Firmware update allows the end user to enjoy new software features and/or correct any bug in the current firmware. - Page 79 You may select Download from the Internet, and then press Next >. The wizard will automatically query the Georaids’ web site. If it finds a firmware that is newer than what is currently on your KT-10 v2, it will be downloaded. Figure 88: New Firmware Downloaded Press Next>...
- Page 80 You should see FW UPGRADE displayed on the KT-10 v2’s display as seen in the Figure 90. It is very IMPORTANT not to disturb the unit during the upgrade process. Figure 90: FW Upgrade screen Upon successful upgrade, the KT-10 v2 will re-start.
-
Page 81: Console
KT-10 v2. Some of the advanced parameter setting includes set or enable KT-10 v2 for re-calibration, read current calibration parameters, download measurement logs in text format, as well as it is used in advanced troubleshooting of the KT-10 v2. Caution: Making changes without complete understanding or guidance from Terraplus Technical Support may result in incorrect operation of the KT-10 v2. - Page 82 Figure 94: Licence Agreement Select, I Agree to continue… Figure 95: Destination folder Select different destination folder if desired or click Next > to continue… Figure 96: Start Manu folder Select Start Menu Folder and then select “Install”… To launch the Geomon, double click on the Geomon short-cut icon placed on the desktop or run it from the programs menu.
- Page 83 Figure 97: Geomon The buttons in the menu bar are as follow: Figure 98: Connect device Figure 99: Disconnect device Figure 100: About Figure 101: Quit application...
- Page 84 To connect KT-10 v2 to Geomon; Connect KT-10 v2 via the USB cable. Ensure that the GeoView software is not presently running. Click on the Connect Device button as seen in figure 98. Select device window will open up as seen in the figure below.
- Page 85 Once the meter is connected, then the user can select between Commands or Data tab, as shown in figure below. Figure 104: Geomon tab tab offers the following: Device Summary: lists information such as serial number, firmware version and model type of the meter that is connected.
- Page 86 Stop measure: stops measurement sequence Upload firmware: permits user to upload firmware on the KT-10 v2 as described in the section 4.1.8 on page 78. Upload file: to upload .tar files on the internal memory of the KT-10 v2...
-
Page 87: Pc Connections
KT-10 v2 – Bluetooth Connections 5.l PC Connections The KT-10 v2 also has the ability to connect to the PC via Bluetooth, if your PC is Bluetooth capable. If you have the Bluetooth icon in the system tray of your PC you will have Bluetooth connectivity. - Page 88 Check the box My device is set up and ready to be found, and then select Next Figure 107: Search for Device Allow the Bluetooth search to finish, seen above. When it has completed the following screen will be presented. Select the KT-10 v2 with the correct serial number and choose Next> Figure 108: Select Device...
- Page 89 No passkey is needed for the KT-10 v2 communications. Bluetooth Passkey The KT-10 v2 will then be connected to your PC. Installing Bluetooth Device...
- Page 90 Finally, if you right click on the Bluetooth icon in the system tray and select show devices, the KT-10 v2 will now be listed. Figure 110: Confirm Bluetooth Device Further details on connecting the KT-10 v2 via Bluetooth to the GeoView software for Data Download is found in section 4.1.4 on Page 67.
-
Page 91: Geovision Installation
5.2 GeoVision – Real Time Profile for Android Smartphone (Standard with KT-10 S/C) The GeoVision app can be paired with the KT-10 v2 to display real time scanner profiles on Android operated smart phones and tablets. Real time animated graphical outputs are displayed on the smart phone’s screen when scanning. - Page 92 Figure 111: GeoView Install file 3) Tap on the geovision.apk to being installation. 4) You will be then asked to confirm if you wish to install the application, confirm it by selecting the “Install” button. Figure 112: Confirm Installation 5) After the successful installation of the application, you may either select Open or Done.
-
Page 93: Geovision Menu
Figure 113: GeoVision installed 5.2.2 GeoVision – main menu Figure 114: GeoVision menu... - Page 94 The main menu lists 3 selections and they are: Initiates real time scanner profile measurement on the KT-10 v2 if the meter is paired with GeoVision. Allows an operator to review data stored in the KT-10 v2’s memory. Operator can then view any records or attach text note using the keypad of the mobile phone.
- Page 95 Figure 116: Device selection Find and select your KT-10 v2 from the list by taping on the device’s name. When the GeoView is successfully connected to your KT-10 v2, the following screen can be seen momentarily – indicating that the device is connected.
- Page 96 To browse previously stored data on the KT-10 v2, tap on the button. It takes a few seconds for the GeoVision to read all of the data from the KT-10 v2. When the reading of data is completed, a device log will be populated as seen in the figure below.
- Page 97 In the figure 119, the serial number of the paired KT-10 v2 as well the number of stored records for Measure and Scanner is displayed. To browse stored data, tap on the serial number of the KT-10 v2. A new screen, as seen in Figure 120, will be displayed listing records under Scanner and Measure tab.
- Page 98 As seen in Figure 121, the scanner record is consist of Average and Max value of Susceptibility & Conductivity, Duration in # samples recorded, and the time when the measurement was saved on the meter. Figure 121: Scanner record explained Note: In the scanner mode 20 samples per seconds are collected.
- Page 99 Tap on the scanner graph preview area to see the record in full size. Figure 123: Scanner record full size (Portrait view) Figure 124: Scanner record full size (Landscape view)
-
Page 100: Graph / Scale
5.2.3 Graph Scale To set/change graph scale, tap on the menu button of your mobile phone. A new menu with scale options will be open up as seen in the figure 125 seen below. Figure 125: Adjust scale – pull menu Swap Layers: Changes the way the graph is displayed. - Page 101 Max value 100: Sets the maximum scale value of the Y axis to 100. Scanner record with readings over 100 will be clipped. Tapping on the More button will show more options to set the Y axis scale. Max value 10: Sets the maximum scale value of the Y axis to 10.
-
Page 102: Zoom / Pan
5.2.4 Zoom / Pan To Zoom into the graph, simply place your two fingers on the area you would like to zoom into and then separate the two fingers away on the screen. This pinching out of the two fingers for zoom can be done on both the Y and X axis. To Pan into the graph, simply place your two fingers on the area you would like to Pan into and then bring the two fingers closer on the screen. -
Page 103: Note About Switching Off
Troubleshooting 6.1 Notes about Switching OFF. Like other instruments that are based on a microcomputer core, the KT-10 v2 meter may be sensitive, in some specific circumstances, on external distortion (strong electromagnetic field, discharge) and may show improper operational behaviour. The most common symptom is no reaction on any of the button presses. - Page 104 6.3 “Error” on the Display An “Error” message is displayed on the KT-10 v2’s screen when it fails to compute a result as seen in the figure 128. Figure 128: Measurement Error The main reason for this error message may be that a measurement sequence is not being followed properly.
-
Page 105: Maintenance
Spare rubber cover for the switch can be purchased through Terraplus Inc. and replaced in the field. Coil Cap: The black coil cap on the head of the KT-10 v2 can wear and tear with regular usage. Spare Coil caps can be purchased through Terraplus Inc. -
Page 106: Appendix A: Kt-10 V2 Plus Feature
Appendix A: KT-10 v2 Plus Feature This document is in addition to the KT-10 v2 manual. It is intended to provide information specific to the operation of the Plus feature for the KT-10 v2. The procedures outlined in this section are also applicable for conductivity measurements and calibration. - Page 107 When the option Conc. tables has been selected, the user will be presented with an option to select a list of calibration tables for susceptibility or conductivity (Figure 130). Figure 130: Conc. Tables Sub menu Select the appropriate measurement mode (Figure 130) to reveal the installed calibration tables for that mode.
- Page 108 The process to load a calibration curve is outlined on page 109. To begin using the preloaded calibration table, select it from the list and return to the main menu. The KT-10 v2 will remember the last table selection made upon restart. Figure 132: Table type notified On the measurement screen (Figure 132), a number in the upper left hand corner of the display is used to indicate which calibration table is currently being used.
- Page 109 The data stored on the KT-10 v2 will be in a percentage with average and standard deviation values for each group of readings. GeoView Software Interface GeoView is used to access the data stored on the KT-10 meters. It also provides access to the settings and calibration tables used in the meter.
- Page 110 The name of the table can be edited so that it is easier to distinguish from other tables. The table’s name cannot be longer than 11 characters. You can also edit the percentage and SI reading columns in the table. In the example below, Point 1 is for 1 percent and has the assigned value of 26.0 X 10 SI units.
- Page 111 Figure 136: Short Calibration table In Figure 136, the range from 5 % to 70 % has been included in only three data points. Please note that any values above and below this table will produce questionable a output. After the data has been collected and transferred into Geoview, you will see the additional information showing when the calibration curves have been used.
- Page 112 Recommendations for KT-10 Plus Calibrations The calibration curves are based on the relation between the measured susceptibility and the real concentration of a specific type of mineral. The calibration consists of creating a numerical table or function that will cover all of the different concentrations found in an ideal sample.
- Page 113 Concentration Sample Concentration <5% Below average Local average Local Maximum Figure 138: Calibration Selection table Calibration Table To create the calibration table, the user will require calibration samples with known concentrations; the concentrations should be determined by another method, such as chemical assay, XRF, etc.
- Page 114 Appendix B: Advice and Recommendations Measurements of bulk susceptibility or conductivity using a new handheld meter can be used in a wide range of applications in various geological fields, making the instrument useful for both geologists and geophysicists. But there are some considerations that must be followed in order to obtain good results and protect the instrument against damage.
- Page 115 Warranty: All KT-10 v2 models come with a one-year warranty from Terraplus Inc from the date of shipment. Warranty for the KT-10 v2 models covers defective components and workmanship for the repair at Terraplus’ office in Richmond Hill, Ontario, Canada.
Need help?
Do you have a question about the KT-10 v2 and is the answer not in the manual?
Questions and answers
i encountered the following case; i take so many readings with the machine, the i connected the device to PC to download, after synchronization end, i checked the records and found that some hundreds last data are missing (not available), i then checked the memory status, it was 4000/4000 means memory full, now i need help recover the missing records, what is the solution