
Related Manuals for VWR International 634-6002


Summary of Contents for VWR International 634-6002
- Page 1 UV-3100PC Spectrophotometer INSTRUCTION MANUAL European Catalogue Number(s): 634-6002 Version: 1.0.0 Issued: 07 , April 2010 VWR Collection Manual ver 1, rel 15.05.2007...
- Page 3 Legal Address of Manufacturer Europe VWR International Europe bvba Researchpark Haasrode 2020 Geldenaaksebaan 464 B 3001 Leuven Tel.:+ 32 16 385 011 http://www.be.vwr.com Made in China...
-
Page 5: Table Of Contents
Table of Contents Part 1: Spectrophotometer Safety Information Package Contents Unpacking Installation Intended Use Symbols and Conventions Specifications Overview Description of Buttons and Switches Operational Keys Getting Started Important Guidelines General Operating Instructions Operation Basic Mode Quantitative Mode Wavelength Scan Kinetics DNA/Protein Mode Multi Wavelength Mode... - Page 6 Warranty Equipment Disposal Part 2: Software Functions Main Functions Spectrum Processing Function System Check and Calibration Function Installation Introduction Operation Single Wavelength Photometric Measurement Fixed Point Measurement Wavelength Scanning Time Scanning (Kinetic Analysis) DNA/Protein Measurement Appendix 1 Appendix 2...
-
Page 7: Part 1: Spectrophotometer
Part 1: Spectrophotometer... -
Page 9: Safety Information
Safety Information Please follow the guidelines below, and read this manual in its entirety to ensure safe operation of the unit. VWR recommends against the use of UV-3100PC Spectrophotometer. Do not open the device. Disconnect the device from the mains supply before carrying out maintenance work or changing the fuses. -
Page 10: Unpacking
Power Cord ( SW Plug ) USB Cable CD-ROM Manual Unpacking Open the package, according to carefully check the packaging packing list items, if found inside the packaging are missing or damaged items please your local VWR office and authorized contractual partners. Installation Placement Place the instrument on the stable table carefully. -
Page 11: Symbols And Conventions
Symbols and Conventions The following chart is an illustrated glossary of the symbols that are used in this manual. CAUTION This symbol indicates a potential risk and alerts you to proceed with caution CAUTION This symbol indicates the presence of high voltage and warns the user to proceed with caution CAUTION This symbol indicates risks associated with hot surfaces Specifications... -
Page 12: Overview
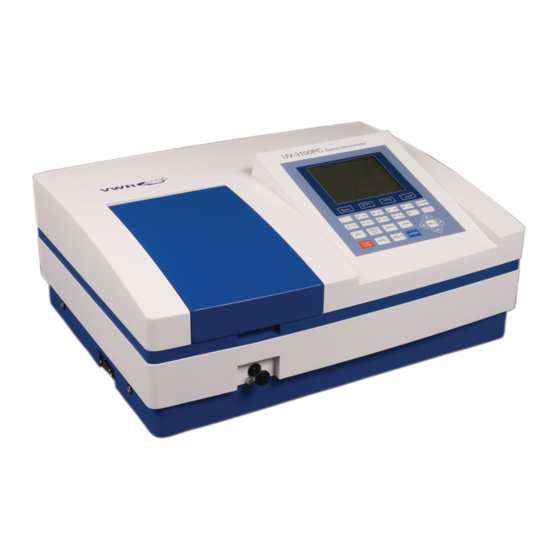
Low Voltage Directive 2006/95/EC Electromagnetic compatibility 2004/108/EC Restriction on use of Hazardous Substances RoHS 2002/95/EC and theirs amandements. Overview UV-3100PC Spectrophotometer has the characters of wide range of wavelength, high sensitivity, powerful function, easy to use, simple structure and pretty figure. Besides these, the large LCD, High Precise A/D and easy to store RAM makes the instrument much more superior than other originals. - Page 13 Rear View...
-
Page 14: Operational Keys
Operational Keys Functions... - Page 15 Function Keys: Functions on-screen prompts … Numeric Keys: Enter numbers and letters CLEAR Key: Delete the input value or stored data ESC Key: Return to previous Interface 100%T/0Abs Key: Blank OPEN Key: Open files stored in internal memory SAVE Key: Save files to internal memory START/STOP Key: Start/Stop testing GOTO ʎ...
-
Page 16: Getting Started
Switch on the power. Then the instrument begins to self-check and 15 minutes’ warm up. Self-check includes the following steps: WL: 500.0nm 10:00:00 Wait until EasyRTOS booted: VWR International bvba Turn on lamps →RAM Check→ Start RTOS kernel→ Initialize Comm. Port → Initialize Printer → Initialize AD → System position → Warm up. -
Page 17: Important Guidelines
WL: 500.0nm 10:00:00 Wait until EasyRTOS booted: Warm up 15 minutes…………? Press to skip… After warm up, the instrument will ask the user to re-calibrate the system. Users can decide if they need to re-calibrate the system or not. After this step, the instrument can work normally. -
Page 18: General Operating Instructions
Dispose of measuring solutions and cleaning and disinfectant materials in accordance with the relevant local laboratory regulations. General Operating Instructions Select Application Main menu, press numeric keys or use the key to choose corresponding menu, then press to enter into. Set Wavelength Press to set wavelength, use numeric keys to input the values, press... -
Page 19: Operation
Put the Reference in the light path, press to do blank. Measure Samples Put the samples in the light path, press to measure. Print the Test Results Press to print the test results. Store the Test Results Press to store the test results, input the file name by numeric keys and press to save. -
Page 20: Basic Mode
Check the cuvettes The cuvettes must be clear and there’s no remains of the samples on the surface of it. Only Silicon (Quartz) cuvettes are permitted to be used in the range of UV area. Basic Mode 1. Enter into Basic Mode Main menu, press numeric key to choose “Basic Mode”, then press to go into. - Page 21 Press to set F. Input the value of F by numeric keypad, press confirm. Then the F value would display on the screen. Method 2: : : : Standards Mark Put the reference sample in the light path and calibrate 100%T/0Abs; Put the standard sample in the light path,press to start the mark.
-
Page 22: Quantitative Mode
Result: 0.000 Abs Date & Time: mm-dd-yyyy, hh:mm:ss Model: UV-3100PC UEFXXXXXXX Version: A1.176 VWR International bvba. Quantitative Mode 1. Enter into Quantitative Mode Main menu, press or press to choose “Quantitative Mode” followed with pressed to confirm. 2. Set Unit... - Page 23 Set up Standard Curve: Method 1: Input Regression Equation 1) Set Fit Curve Method. Press to set Fit method,use choose the method and press to confirm. 2) Set Wavelength. Press to set wavelength. Use to choose measure method, then press to confirm.
- Page 24 2) Set Wavelength. Press to go into wavelength setting interface, press to select measure method and press to confirm. Input the value of the wavelength and press to confirm. 3) Blank. Put the Reference Sample in the light path and press to do blank.
- Page 25 Load the Stored Curves In the “Calibration Table” interface, press to go into files select interface. Use to select the curve you need and press to load. Users can press to view the curve, press to cancel. 4. Return the sample measurement interface In the “Calibration Table”...
- Page 26 Test Results. Quantitative Test Report File Name: Date & Time: mm-dd-yyyy, hh:mm:ss No. 500.0nm Abs(eff) C(mg/L) 0.212 0.212 0.212 0.210 0.210 0.210 0.209 0.209 0.209 Fitting Params: C=1.000* A^1 r=1.000 Model: UV-3100PC UEFXXXXXXX Version: A1.176 VWR International bvba.
-
Page 27: Wavelength Scan
Wavelength Scan 1. Enter into Wavelength Scan Main menu, press numeric key to choose “Wavelength Scan” and press to enter. 2. Parameters Setup Press to set parameters, set “Scan From” , “scan to”, “scan step” and “scan speed”, press to confirm. 3. - Page 28 6. Search Peaks After scanned, press to go into peak search mode. Press to set peak height, input the peak height and press to confirm. Press to display the value of every wavelength point. Press to display the value of every peak. 7.
-
Page 29: Kinetics
Scan From: 230.0nm Scan Step: 1.0nm Peak Height: 0.030Abs Model: UV-3100PC UEFXXXXXXX Version: A1.176 VWR International bvba. 1.200 Peak list No. Wavelength(nm) 536.0 0.918 12.1 Kinetics 1. Enter into Kinetics Main menu, press to select “Kinetics Mode” and press confirm. - Page 30 2. Setup Parameters Press to set parameters, input the corresponding values of “Total Time”, “Delay Time” and “Time Intervals” according the screen indicates. Press to confirm. 3. Set Photometric Mode Press to set photometric mode, choose “T%” or “Abs.” and press confirm.
- Page 31 7. Calculate Response Rate After time scanned, if users want to calculate the response rate of some period, you can press to go into “Process” interface. Input the values of “Begin Time”, “End Time” and “Factor” separately and press to confirm. Then the value of “I.U.” would display on the screen.
-
Page 32: Dna/Protein Mode
Date & Time: mm-dd-yyyy, hh:mm:ss Wavelength: 500.0nm Total Time: 180s Time Interval: 1.0s Factor: 1.000 Model: UV-3100PC UEFXXXXXXX Version: A1.176 VWR International bvba. -0.005 0.005 DNA/Protein Mode 1. Enter into DNA/Protein Mode Main menu, press to choose “DNA/Protein Mode” and press to confirm. - Page 33 2. Setup Parameters Press to set coefficients, input all the values of f1 to f4 by numeric keypad according the indication and press to confirm. 3. Choose Measure Method Press to set method. Press to choose “Absorbance Difference 1” or “Absorbance Difference 2”...
-
Page 34: Multi Wavelength Mode
260.0nm 0.251Abs 280.0nm 0.243Abs 320.0nm 0.095Abs C-DNA 4.524ug/mL C-Pro 110.8ug/mL Ratio 1.059 Unit: ug/mL Model: UV-3100PC UEFXXXXXXX Version: A1.176 VWR International bvba. Multi Wavelength Mode 1. Enter into Multi Wavelength Measurement Main Menu, press to choose “Multi Wavelength Measurement” and... - Page 35 then press to go into multi wavelength measurement interface. 2. Setup Wavelength Press to go into wavelength setting interface, input all the wavelength value one by one by the numeric keypad. Press to confirm, press to return. 3. Set Photometric Mode Press to set the photometric mode,...
-
Page 36: System Utility
Test Results. Multi-Wavelength Test Report File Name: Date & Time: mm-dd-yyyy, hh:mm:ss Sample---1 500.0nm 0.251Abs 510.0nm 0.243Abs Unit: Model: UV-3100PC UEFXXXXXXX Version: A1.176 VWR International bvba. System Utility Main menu, press or use to select “System Utility” and press confirm. - Page 37 Wavelength Reset Press or use to choose “Wavelength Reset” then press to begin the calibration. During the course, opening the lid of the compartment is prohibited. Printer Setup Press to select “Printer Setup” then press to confirm. Reset Printer Press or use to choose “Reset Printer”...
- Page 38 Select Printer Press or use to choose “Select printer” and press confirm. Use to select the printer’s model and then press confirm. Change Print Mode Press or use to choose “Change print mode” and press to confirm. Two modes are under your choice, one is “Print Data Sheet”, the other is “print the display interface”.
- Page 39 press . Then users can find the D2 lamp’s usage time and the system will ask if you are sure to reset the usage time. Press to choose “Yes” and then press to confirm. The system will record the usage time from zero.
- Page 40 Set Time Press to choose “Set Time” and press to confirm. Input the time (Hour, Minute, Second) by numeric keypad, press confirm and return automatically. Set Date Press or use to choose “Set Date” and press confirm. Input the Date(Year, Month, Day) by numeric keypad, press to confirm and return automatically.
- Page 41 Press or use to choose “Refresh Dark Current” and press confirm. Then the system begins to refresh Dark Current. Note: During the course, open the lid of the compartment is prohibited. Connect to PC Press or use to choose “Connect to PC”, and press to go into waiting interface.
-
Page 42: Troubleshooting
Press or use to choose “Refresh System Baseline” and press confirm. Then the system will scan the baseline. During this course, opening the lid of the compartment is prohibited. Deleted Entire Saved Files to choose “Deleted Entire Saved Files” and press to confirm. -
Page 43: Repair And Maintenance
Lamp damage or lamp life Replace lamp maturity Dark Current Error The lid of the compartment is Close the lid, restart when self-check open during self-check System Calibrate Something block the Light Remove it, calibrate again Failed path Power on, back light is nothing Display Contrast problem Adjust the contrast potentiometer... -
Page 44: Spare Parts Replacement
remains on the surface would cause measuring error. Spare Parts Replacement Replace the fuse Danger! Be sure to switch off the power and unplug the socket before replacement! 1. Tools preparation Prepare a 3×75 Flat Blade screwdriver. 2. Switch Off the power supply Switch off the power supply, and unplug the socket. - Page 45 5. Reset the fuse seat Replace the fuse seat in the power socket. 6. Switch on the power Plug the socket and switch on the power. Replace lamps Hot! ! ! ! Wait 20 minutes before open the lamp chamber after power off to avoid scald! 1.
- Page 46 5. Replace the D2 lamp Unscrew the 2 screws on the D2 Flange (No.1), unplug the connector in the power board(No. 2)and remove the D2 lamp. Draw on the cotton glove and replace a new lamp. Fix the 2 screws and plug the connector again. 6.
- Page 47 7. Adjust the position of the W lamp Switch on the power,(the Switch Mirror should be placed to the position as indicates). Observe the entrance facular, and it should in the center of the entrance hole. If the facular deviate to Left or Right, then loosen the No.1 screws in Fig. 5-8 and move the lamp seat to Left or Right until it focus on the center of the slot.
- Page 48 8. Finish Reset the cover of the light chamber and fix the screws. Reset the cover of the instrument and fix the screws. Recover the Pole in the compartment, then the course finished. Replace the Battery Be sure to switch off the power supply and unplug the socket before open the Bottom Cover!...
-
Page 49: Accessories And Spares Parts
4. Replace the Battery Pick out the old battery and replace a new one. 5. Finish Recover the bottom plate and fix all the screws, then the course finishes. Accessories and Spare Parts Description Quantity Cat. No. CELL HOLDER, 4-CELL, 10MM 634-6003 CELL HOLDER, 4-CELL,10 TO 50MM 634-6004... - Page 50 CELL HOLDER FOR MICRO CELLS 634-6008 CELL HOLDER FOR TEST TUBES 634-6009 CELL HOLDER,8-POSITION AUTO CELL CHANGER 634-6010 CELL HOLDER, SOLID SAMPLE, 10MM 634-6011 CELL HOLDER, WATER-JACKED, 4 CELL, 10MM 634-6012 CUVETTE, SQUARE.GLASS,10MM 4PCS 634-6013 CUVETTE, SQUARE.GLASS,20MM 2PCS 634-6014 CUVETTE, SQUARE.GLASS,30MM 2PCS 634-6015 CUVETTE, SQUARE.GLASS,50MM...
-
Page 51: Technical Service
For information or technical assistance contact your local VWR representative or visit. www.vwr.com. Warranty VWR International warrants that this product will be free from defects in material and workmanship for a period of two (2) years from date of purchase. If a defect is present, VWR will, at its option, repair, replace, or refund the purchase price of this product at no charge to you, provided it is returned during the warranty period. -
Page 52: Equipment Disposal
Equipment Disposal This equipment is marked with the crossed out wheeled bin symbol to indicate that this equipment must not be disposed of with unsorted waste. Instead it's your responsibility to correctly dispose of your equipment at lifecycle -end by handling it over to an authorized facility for separate collection and recycling. -
Page 53: Part 2: Software
Part 2: : : : Software... -
Page 55: Functions
Functions This section introduces the functions of the UV-Vis Analyst. Main Functions Single wavelength photometric measurement Go to a desired wavelength quickly and conveniently. Photometric value display mode can be changed (%Transmittance or Absorbance). Fixed Points Measurement Multi-wavelength Photometric Measurement Up to 20 wavelength points can be set up. -
Page 56: Spectrum Processing Function
Wavelength points and ratios can be set up. Results will be grouped into a table format automatically. Spectrum Processing Function Trace a Spectrum The cursor can be moved to a desired point in the spectrum displayed on the screen and the photometric data at this point is displayed. -
Page 57: Installation
Installation This section introduces how to setup the UV-Vis Analyst to PC. PC System Requirements Pentium or above PC; CD-ROM; USB Ports. 32MB Memory(256MB or Above is strongly recommended); 50MB or above hard disc Space; Microsoft Windows 2000/XP/Vista/7. Install UV-Vis Analyst Put UV-Vis Analyst disc in the CD-ROM;... - Page 58 Choose install path, then click Next; Select setup type, then click Next; Select program fold. Click Next to copy files to PC;...
- Page 59 Click Finish to finish the installation. Uninstall UV-Vis Analyst Start→Control Panel→Add or Remove Programs→Select UV-Vis Analyst→ Change/Remove. Run UV-Vis Analyst There are two ways to start the UV-Vis Analyst: Double-click shortcut icon on the desktop. Start→All Program→UV-Vis Analyst→UV-Vis Analyst. Set up Communication Port Start the UV-Vis Analyst, on the UV-Photometer menu, click Comm.
-
Page 60: Introduction
Introduction We will introduce the UV-Vis Analyst in this chapter. Main Interface This is the main interface after start. Menus Bar and Tools Bar Menu bar and Toolbar are both provided in the software offering you two ways to select a desired function. - Page 61 Main Menu Sub Menu Tool Function New a Fixed Points Measurement New a Wavelength Scan New a Time Scan Measurement New a DNA/Protein Measurement New a Instrument Validity Open… Open a spectrum/data file Close Close current measurement File Save Save current measurement Save As…...
- Page 62 Status of Display status of Status font Setup font of status bar Customize Define the information of display Peaks Mark peak value Valleys Mark valley value Magnify Magnify the area selected Restore Restore the default parameters Search Search peak/valley one by one Link Connect to the Instrument Reset...
- Page 63 Slit Bandwidth * Set slit bandwidth (0.5, 1.0, 2.0, Set Unit Set unit Turn on/off W lamp Turn on/off W lamp Turn on/off D2 lamp Turn on/off D2 lamp D2/W Switch Point Set switch point of D2/W Comm. Port Setup Setup comm.
- Page 64 Subtract one spectrum from Multiply Multiply two spectrum Divide Divide one spectrum from another Moving Window Smooth a spectrum with the Savitzky-Golay Smooth a spectrum with the Derivate Derivative of a spectrum Resample Resample a spectrum New Window New a measurement window as Cascade Multi windows display in a cascade Window...
-
Page 65: Operation
Set and Goto one wavelength Display Instrument CPU Delete current Spectrum Display result as mode %T Display result as mode Abs Undo Scale Operation This chapter introduces how to use UV-Vis Analyst. Single Wavelength Photometric Measurement The UV-Vis Analyst provides a convenient method to measure photometric value at a fixed wavelength. - Page 66 analyze unknown compounds against calibration standards. Multi-wavelength Photometric Measurement 1. Click on the toolbar, appears follow form. 2. Click the Method tab. 3. Type the number of wavelength points in the Number of WL Points box, or click the up/down arrows next to the box set the wavelength points. Leave the two boxes Calculate Concentration and Use Standard Samples.
- Page 67 7. Place a sample in the sample compartment. Click Start or to run a new measurement. The display will change to the following. Key in the sample name in the Name box. 8. Click OK. The photometric data for sample will be listed in the Sample table. 9.
- Page 68 Concentration Measurement Set Up Linear Regression Curve There are two methods available to set up the linear regression curve. You can use standards to set up the regression curve or just key in the parameters manually. Use the following steps to select the method you wish to use. 1.
- Page 69 (9) Click down arrow in Curve Fit box to select curve fit method. Method 2: Input the factor of the linear regression curve. (1) Leave the Use Standard Samples check box. (2) Click down arrow in Curve Fit box to select curve fit method. (3) Input the factor of the linear regression curve.
- Page 70 Measure Concentration by Using The Linear Regression Curve The following procedure shows how to measure concentration of samples. 1. Set up linear regression curve or click to open a file of linear regression curve (*.QUA). 2. Place reference into the sample holder. Click to do blank.
-
Page 71: Wavelength Scanning
Wavelength Scanning This chapter describes how to collect a spectrum while using Wavelength Scan function. Scan Sample Click on the toolbar to new a sample scan measurement, appears the following form. Click on the toolbar, appears the following form. Input start wavelength in... - Page 72 From box (range: 190-1100nm), end wavelength in To box (range: 190-1100nm), select scan interval (0.1, 0.2, 0.5, 1.0, 2.0 or 5.0nm) and Filter times (1, 3, 5, 10 or 30), click OK. Click on the toolbar to select %Transmittance mode or click to select Absorbance mode.
- Page 73 Auto List Peaks and Valleys Click on the toolbar to set the peak/Valley threshold (range: 0 to 1.000, step: 0.001), Input the threshold value, click OK. Click to list peaks and click to list valleys. Rescale...
- Page 74 Click on the toolbar to set the new parameters for display. Original Scales Click on the toolbar to restore the default display settings. Zoom Selected Area Click on the toolbar to activate zoom function. Position the cursor in the upper-left corner of the area you want to select.
- Page 75 Trace a Spectrum Click on the toolbar, A crosshair cursor appears, move the cursor on the spectrum. Move the crosshair cursor left or right on the spectrum. The data in the cursor window indicate the X-axis and Y-axis values for the current cursor location. Double click the left mouse button to release the crosshair cursor.
- Page 76 name will be listed in the Name Box and it will be referred to as Current Spectrum. Derivative Click on the toolbar. The following dialogue box appears. Key in the class of derivative (1-10, depending on whether 1st, 2nd, … 10th derivative is required) and type a name for the result spectrum, then click OK.
- Page 77 Savitzky-Golay Smoothing Filter On the Computer menu, click Savitzky-Golay Smoothing Filter. Appears following form. Click up/down arrow to select the parameters, key a file name in the Name of Result box, click OK. The result spectrum will be displayed overlaid with the original one.
- Page 78 Resample Click on the toolbar. The following dialogue box will be displayed. Click Up/Down arrow to select Sample times. Click OK. The new spectrum displays. Spectrum Addition Spectrum addition can assist in the development of artificial spectrum in multi-component mixtures. Click on the toolbar.
- Page 79 Spectrum Subtraction Subtracting one spectrum from another has been a classical technique to offset spectrum interference from the spectrum of interest. Click on the toolbar. The following dialogue box will be displayed. Click the down arrow next to File 1 to select a spectrum and define it as source 1. Select a spectrum for File 2 in the same way.
- Page 80 Spectrum Multiplication Multiplying spectrum can assist in the development of artificial structure of spectrum in multi-component mixtures. Click on the toolbar. The following dialogue box will be displayed. Click the down arrow next to File 1 to select a spectrum and define it as source 1. Select a spectrum for File 2 in the same way.
- Page 81 Spectrum Division Dividing one spectrum from another has been a classical technique to offset spectrum interference from the spectrum of interest. Click on the toolbar. The following dialogue box will be displayed. Click the down arrow next to File 1 to select a spectrum and define it as source 1. Select a spectrum for File 2 in the same way.
- Page 82 Unload a Spectrum Select the spectrum you want to unload as the Current Spectrum, Click on the toolbar to remove the spectrum from the display. Define Display Information Click on the toolbar, appears the Settings to display and print the spectra form, click the Legend tab, type the information for display.
-
Page 83: Time Scanning (Kinetic Analysis)
Time Scanning (Kinetic Analysis) This chapter tells you how to obtain the absorbance or transmittance value for a sample as a function of time at a given wavelength. Scan Sample 1. Click on the toolbar, the following dialog box will appear. 2. - Page 84 4. Place a reference in the sample holder. Click on the toolbar. 5. Take out the blank in the sample holder, place a sample in it and close the cover. 6. Place a sample in the sample holder. Click on the toolbar. The instrument will start scanning automatically.
-
Page 85: Dna/Protein Measurement
Define Display Information Click on the toolbar, appears the Settings to display and print the spectra form, click the Legend tab, type the information for display. Edit Print Information Click on the toolbar, appears the Settings to display and print the spectra form, click the Legend tab, type the information for display. - Page 86 Click the down arrows of the method to select the test method. Key in the wavelength position in the Wavelength box. Key in the value of DNA/Protein Conc. Place a reference in the sample holder. Click on the toolbar to do blank. Click the Sample tab.
- Page 87 The UV-Vis Analyst will read the photometric value of sample 1 at the fixed wavelength automatically. Key in the sample name in the Name box. Click OK after the measurement is complete. The photometric data for sample 1 will be listed in the sample table.
-
Page 88: Appendix 1
Appendix 1 Methods of Quantitative Analysis Single Wavelength Method: Abs.=A1 Double Wavelengths Method: Abs.=|m*A1-n*A2| Three Wavelengths Method: Abs.=A1-(W1-W2)*(A2-A3)/(W2-W3)-A3 Appendix 2 Methods of DNA/Protein Analysis Method 1: CDNA=(A1-Aref)*f1-(A2-Aref)*f2 CProtein= (A2-Aref)*f3-(A1-Aref)*f4 Ratio=(A1-Aref)/ (A2-Aref) A1=A260nm,A2=A280nm,Aref=A320nm (Optional) f1=62.9,f2=36.0,f3=1552,f4=757.3 Method 2: CDNA=(A1-Aref)*f1-(A2-Aref)*f2 CProtein= (A2-Aref)*f3-(A1-Aref)*f4 Ratio=(A1-Aref)/ (A2-Aref) A1=A260nm,A2=A230nm,Aref=A320nm (Optional) f1=49.1,f2=3.48,f3=183,f4=75.8... - Page 90 Local VWR offices in Europe and Asia Pacific Austria Hungary Portugal VWR International GmbH Spektrum-3D Ltd. VWR International - Material de Graumanngasse 7 A VWR International Company Laboratório, Lda 1150 Wien Simon László u. 4. Edifício Neopark Tel.: 01 97 002 0 4034 Debrecen Av.
Need help?
Do you have a question about the 634-6002 and is the answer not in the manual?
Questions and answers