Table of Contents
Advertisement
Advertisement
Chapters
Table of Contents

Summary of Contents for Marsh-McBirney Flo-Mate 2000
- Page 1 F L O- MA T E V 2 . 0 , J a n u a r y 1 9 9 4 R u e J . H . Co o l 1 9 a | B - 4 8 4 0 We l k e n r a e d t | T e l . : + 3 2 ( 0 ) 8 7 8 9 9 7 9 9 | F a x : + 3 2 ( 0 ) 8 7 8 9 9 7 9 0 | E - ma i l : i n f o @f l o w- t r o n i c . c o m | www. f l o w- t r o n i c . c o m...
-
Page 2: Table Of Contents
CONTENTS General Description ........................1 Theory of Operation ........................2 Design Features ..........................3 Operation ............................4 Real-Time Operating Mode ...................... 4 Display ON Sequence ....................... 4 Units of Measurement/Beeper ....................5 Fixed Point Average/Time Constant Filtering................5 FPA ............................5 rC .............................. - Page 3 Sensors ............................15 Open-Channel-Velocity Sensor ....................15 Full-Pipe-Velocity Sensor ...................... 16 Sensor Mounting Configurations ....................16 Universal-Sensor Mount ......................16 Standard Wading Rod ......................17 Double-End Hanger ........................ 17 Top-Setting-Wading Rod ....................... 18 Suspension Cable ........................20...
-
Page 4: Specifications
SPECIFICATIONS Outputs Velocity Measurement Display Method ¦ Digit Electromagnetic Signal Output Connector (Optional) Zero Stability Analog 0.1 V = 1 ft/sec or 1 m/sec ± 0.05 ft/sec 2 V = Full Scale Accuracy ± 2% of reading + zero stability Materials Range Sensor... -
Page 5: General Description
GENERAL DESCRIPTION The Marsh-McBirney Model 2000 Flo-Mate is a portable flowmeter designed for use in both the field and the laboratory. The unit uses an electromagnetic sensor to measure the velocity in a conductive liquid such as water. The velocity is in one direction and displayed on a digital display as feet per second (ft/s) or meters per second (m/s). -
Page 6: Theory Of Operation
THEORY OF OPERATION The Flo-Mate measures flow using the Faraday law of electromagnetic induction. This law states that as a conductor moves through a magnetic field, a voltage is produced. The magnitude of this voltage is directly proportional to the velocity at which the conductor moves through the magnetic field. When the flow approaches the sensor from directly in front, then the direction of the flow, the mag- netic field, and the sensed voltage are mutually perpendicular to each other. -
Page 7: Design Features
DESIGN FEATURES The Model 2000 design features are as follows: • Lightweight (3 lb 9 oz with sensor and 20 ft of cable), water resistant, and rugged. The case is made of a high impact molded material which protects the electronics from wet environments and accidental submersions. -
Page 8: Operation
OPERATION The Model 2000 has two operating modes: Real-Time and Recall. In the Real-Time operating mode, Real-Time velocities from the sensor are displayed. In the Recall operating mode, velocities from memory are displayed. Comment In the Recall mode, the time bar will be stationary. Real-Time Operating Mode The unit will always power up in the real-time operating mode. -
Page 9: Units Of Measurement/Beeper
Units of Measurement/Beeper The Model 2000 can output velocity in ft/s or m/s. When the beeper symbol is shown, the beeper is active. Press down on the ON/C and OFF keys simultaneously to cycle between: • FT/S no beeper • M/S no beeper •... -
Page 10: Fpa/Rc Time
The display will show the letters rC when you first switch to the time constant mode. The display will start with unfiltered full scale velocities. These readings are accurate but may bounce around slightly. As the filtering takes effect, the readings will settle out. It takes five time constants to get to maximum filtering. -
Page 11: Clearing The Display
Clearing the Display The clear function will clear the display and restart the filtering. To clear the display, press the ON/C key. The display will blank out for a second and then restart to output velocity readings. Storing Velocity Readings There are 19 memory locations in which velocity readings can be stored. -
Page 12: Recall Operating Mode
Recall Operating Mode The recall operating mode outputs the velocity readings that have been stored in memory. The recall mode is indicated by a blinking memory location number and always starts at location one. To switch to the recall mode, press the RCL key. The memory location and the velocity stored in that location is shown on the display. - Page 13 • Position the sensor as described in the zero check procedure. • To initiate the zero start sequence, press the STO and RCL keys at the same time. You will see the number 3 on the display. • Decrement to zero with the key.
-
Page 14: Errors
ERRORS The purpose of displaying errors is to alert the user of possible problems with either the unit or applica- tion. Errors can be displayed as messages or numerical codes. There are three error messages and five numerical codes. Comment: With the exception of Err 2, error codes freeze the display. -
Page 15: Error Codes
Error Codes Error #1 Problem with sensor drive circuit. Check sensor disconnect. Error #2 Memory full error. Memory must be cleared before another reading can be stored. Error #3 Incorrect zero-adjust-start sequence. Reinitiate zero-adjust-start sequence. Error #4 Zero offset is greater than the zero adjust range. Repeat the zero-adjust procedure. If the error is still displayed, the unit needs servicing. -
Page 16: Maintenance
MAINTENANCE Routine maintenance of the unit is confined to cleaning the sensor and changing the batteries. Cleaning the Sensor Nonconductive coatings (oil and grease) can cause noisy readings or conductivity lost errors. Clean the sensor with soap and water. If a problem still persists, clean the electrodes with a very fine grit (600) sandpaper. -
Page 17: Battery Life
BATTERY LIFE The battery life will vary from unit to unit because of different battery types, different ambient tempera- tures and different applications. The battery change guide below will help you to determine when to change the batteries until you gain experience in using your flowmeter in your application. Battery Change Guide The hours shown in the battery life table are estimates based upon a continuous ON at an ambient temperature of 72°... -
Page 18: Options
OPTIONS Sensor Disconnect The sensor cable can be disconnected from the flowmeter with the sensor disconnect option. To disconnect the sensor, pull the latch release (Figure 4) toward the sensor cable. To connect the cable, align the latch alignment marks and push the connector together. -
Page 19: Carrying Case
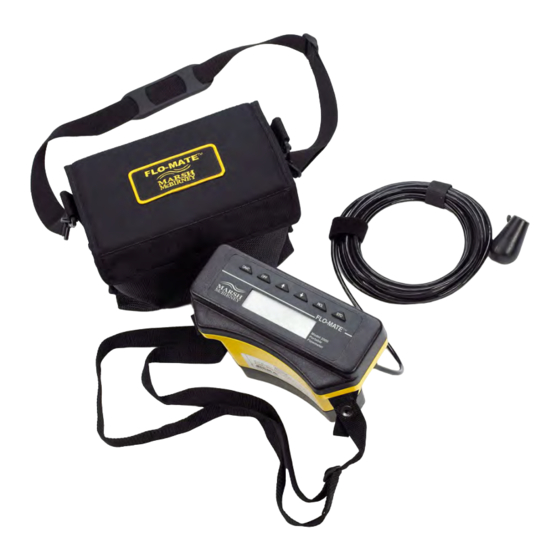
Carrying Case The carrying case for the Model 2000 (Figure 6) is a padded nylon case with two compartments and a shoulder strap. The back compartment is for the meter, and the front compartment is for the sensor and cable. The sensor compartment is made of nylon mesh which lets air circulate through the sensor compartment. -
Page 20: Full-Pipe-Velocity Sensor
Full-Pipe-Velocity Sensor The Model 2000 can be configured with either a one-inch full-pipe-velocity sensor or a two-inch full-pipe-velocity sensor (Figure 8). The installation instructions for the full-pipe sensors Ground Button are contained in the manuals titled “One-Inch Full-Pipe Sensor Installation” and “Two-Inch Full-Pipe Sensor Installation. The sensor disconnect is required when the unit is configured with a full-pipe sensor. -
Page 21: Standard Wading Rod
Standard Wading Rod Both the metric and English standard wading rods have a base, a bottom section, a double end hanger, and three intermediate sections (Figure 10). Each intermediate section is two feet in length (English), or one half meter in length (metric). -
Page 22: Top-Setting-Wading Rod
Top-Setting-Wading Rod Two accepted methods for determining mean velocities of flows are as follows: 1. Measure the velocity at 60% of the depth (from the top) and use this as the mean. 2. Measure the velocity at 20% and 80% of the depth (from the top). Use the average of these velocities as the mean. - Page 23 Figure 12. Top-Setting-Wading Rod...
-
Page 24: Suspension Cable
Suspension Cable The suspension cable (Figure 13) makes it possible for the sensor to be lowered into the water from boats or bridges. To attach the sensor to the suspension cable, insert the mounting shaft on the sensor mount into the hole at the back of the sensor. The thumbscrew needs to be seated in the groove on the shaft, so make sure the shaft is completely inserted into the hole. - Page 26 OPEN CHANNEL PROFILING SCOPE This handbook contains the instructions on how to measure the velocity profile and calculate the flow of open channels. The velocity profile is measured using a handheld velocity meter. Flow is calculated with the continuity equation (Q = x A) where Q is flow, is mean velocity and A is cross-sectional area.
- Page 27 CONTENTS SECTION I PROFILING Mean Velocity ( ) Definition ......................1-1 Cross-Sectional Area ......................... 1-1 Site Selection ............................. 1-2 Choosing the Method ........................1-2 Profiling Checks ..........................1-3 Calculating ............................. 1-3 0.9 x Vmax Method ........................1-3 .2 .4 .8 of Depth Method ......................1-3 .4 Method .............................
-
Page 28: Section I Profiling
SECTION I PROFILING MEAN VELOCITY ( ) DEFINITION A particle of water near the conduit wall will not move as fast as a particle toward the center. To understand this, we need to look at the molecules of moving liquids. The first layer of molecules stick to the wall of the conduit. -
Page 29: Site Selection
SITE SELECTION A site that produces the typical profile shape will give the most accurate results. In a majority of the cases, problem sites can be identified by a visual inspection. Site inspection guidelines are as fol- lows: • The channel should have as much straight run as possible. Where the length of straight run is limited, the length upstream from the profile should be twice the downstream length. -
Page 30: Profiling Checks
Vertical drop (outfalls) - The 2-D method is recommended for outfalls. Remember to measure the level on the same plane as the velocity profile. Outfalls should be avoided wherever possible. Nontypical profile shape - If you suspect a profile shape may not be typical, use the 2-D method. PROFILING CHECKS For best possible results, you should: •... -
Page 31: Method
.4 Method A simplified version of the .2, .4, .8 method is to measure the velocity at the .4 position and use this as . This method is probably the least accurate because it uses only one data point and assumes that a logarithmic profile exists. -
Page 32: Vpt Method
VPT Method The Velocity Profiling Technique (VPT) was first described by N. T. Debevoise and R. B. Fernandez in the November 1984 issue of the WPCF Journal. With this method, a series of point velocity measurements are taken at different depths along the centerline of the flow. These measure- ments along with level are input into a VPT computer program which calculates the flow. -
Page 33: Section Ii Calculating Flow Circular Conduits
SECTION II CALCULATING FLOW CIRCULAR CONDUITS To calculate flow in circular conduits you need: • The mean velocity from Section I. • The depth of flow at the time of profile. • The inside diameter of the conduit. Outline Calculating flow is outlined as follows: •... -
Page 34: Calculate The Flow
Convert the Diameter to Feet and Square = (Diameter in inches ÷ 12) Where: is in feet diameter squared. The diameter needs to be converted to feet because the velocity is in feet per second. Calculate the Flow K x D x = flow Example: What is the flow in millions of gallons per day (MGD) of a 10-inch diameter conduit with a 6-inch... - Page 35 Table I Flow Unit Multiplier K (Flow Unit Mulitiplier) .0009 .5966 .0013 .0023 3.2522 2.2585 .0024 1.6824 .0037 .0063 9.1709 6.3687 .0044 3.0814 .0069 .0117 16.7986 11.6644 .0068 4.7296 .0105 .0179 25.7811 17.9036 .0095 6.5894 .0147 .0249 35.9190 24.9438 .0124 8.6351 .0192 .0327...
- Page 36 Table I Continued K (Flow Unit Mulitiplier) .2603 180.7433 .4027 .6842 985.2306 684.1879 .2667 185.2295 .4127 .7012 1009.6850 701.1701 .2732 189.7121 .4227 .7181 1043.1200 718.1385 .2796 194.1894 .4327 .7351 1058.5250 735.0869 .2861 198.6594 .4426 .7520 1082.8910 752.0076 .2925 203.1204 .4526 .7689 1107.1080 768.8945...
-
Page 37: Rectangular Channels
RECTANGULAR CHANNELS Flow in rectangular channels is calculated by the following: • Determine with the .2, .4, .8 method as described on Page 1-3. For channel widths of six feet or larger, use the .2, .6, .8 method as described on Page 2-6 for rivers and streams. Velocity units must be in ft/sec. -
Page 38: Rivers And Streams
RIVERS AND STREAMS You will need to divide the width of the channel into equal segments (Figure 2–1). Then do a velocity profile and calculate the flow for each segment. Sum the segment flows for the total flow. The procedure for calculating flows in rivers and streams is as follows: Figure 2-1. -
Page 39: Flow Unit Conversion
RECTANGLE TRAPEZOID d x h = A Figure 2-4. Segment Area [(a + b) ÷ 2] x d = A Flow Unit Conversion To convert flow units, locate the appropriate flow unit conversion factor in Table III. Then multiply the existing unit's conversion factor to get the new unit's. Table III Flow Unit Conversion Factors NEW UNITS 0.64632... -
Page 40: Section Iii A Profiling Example Using The Mmi Model 2000
SECTION III A PROFILING EXAMPLE USING THE MMI MODEL 2000 This section illustrates how to collect and analyze data from circular conduits and achieve the best possible accuracy. The data shown in this section is actual field data that was collected with a MMI Model 2000 in a normal flow. -
Page 41: Field Data
FIELD DATA CONDUIT DIAMETER = 24.25 INCHES POSITION AS MEASURED CENTERLINE RIGHT VVL LEFT VVL FROM THE INVERT FT/SEC FT/SEC FT/SEC 0.75 LEVEL DURING PROFILE LEFT CORNER VEL INCHES RIGHT CORNER VEL AVERAGE LEVEL ¦ INCHES 4.8 FT/SEC 4.0 FT/SEC 7 INCHES ¦... -
Page 42: The .2, .4, .8 Method
The .2, .4, .8 Method POSITION VELOCITY .2 x 7" = 1.4" 5.4 ft/sec .4 x 7" = 2.8" 5.5 ft/sec .8 x 7" = 5.35" 5.35 ft/sec (5.4 + 5.35) ÷ 2 = 5.37 ft/sec = (5.37 +5.5) ÷ 2 = 5.44 ft/sec The .4 Method The velocity at the .4 position = 5.5 ft/sec. -
Page 43: Of Deviation
% OF DEVIATION We calculate the % of deviation between the average and high , and the average and low . We discard any that has a deviation greater than 10% from the average . % of Deviation Between High (5.5 ft/sec) and Average (5.5 - 5.2) % deviation =... - Page 44 R u e J . H . Co o l 1 9 a | B - 4 8 4 0 We l k e n r a e d t | T e l . : + 3 2 ( 0 ) 8 7 8 9 9 7 9 9 | F a x : + 3 2 ( 0 ) 8 7 8 9 9 7 9 0 | E - ma i l : i n f o @f l o w- t r o n i c . c o m | www. f l o w- t r o n i c . c o m...
Need help?
Do you have a question about the Flo-Mate 2000 and is the answer not in the manual?
Questions and answers