Table of Contents
Advertisement
Advertisement
Table of Contents

Related Manuals for Secure Pipit 500


Summary of Contents for Secure Pipit 500
- Page 1 Pipit 500 Consumer manual BGX501-869-R01...
-
Page 2: Table Of Contents
Contents Your Pipit 500 In-home display kit ........................4 Care instructions ............................4 About Pipit 500 .............................. 5 Main display ..............................6 Your electricity usage ............................ 7 Your electricity generation ..........................8 Displays associated with the ‘View selection’ button ..................9 General information ............................ - Page 3 Carbon avoidance factor ..........................32 Using your In-home display on battery ......................33 Inserting battery into your Pipit ........................34 Connecting the power cable with the display unit...................35 Pairing your display unit with Smart Meter....................36 Wall mounting your display unit ........................39 Troubleshooting ............................
-
Page 4: Your Pipit 500 In-Home Display Kit
Your Pipit 500 In-home display kit Care instructions ● To avoid damage, do not use sharp objects on the display. ● Do not immerse the unit in water or any other liquid. Keep it away from heat-generating sources or areas with high moisture. -
Page 5: About Pipit 500
The Pipit 500 connects (pairs) wirelessly to your Smart Meter using a Home Area Network which is built into both the Smart Meter and the Pipit 500. Importantly, only the data from your Smart Meter will be visible on your Pipit 500. -
Page 6: Main Display
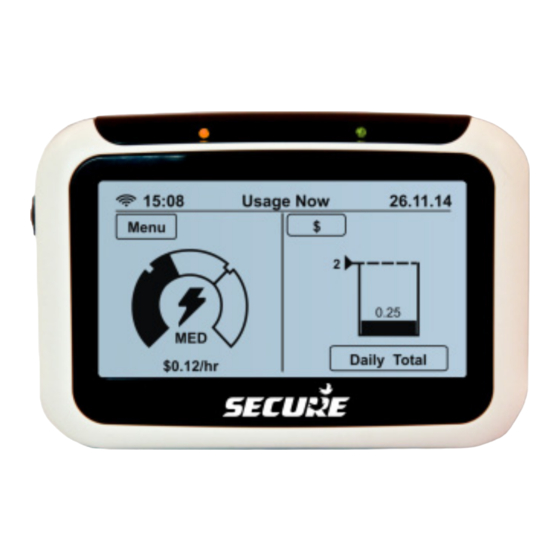
Main display Your display unit empowers you to make informed decisions about your Tap the display area to activate it and access its various functions. energy use. It informs you about your electricity usage and cost in real-time View your electricity and can communicate urgent usage information messages from your retailer. -
Page 7: Your Electricity Usage
Your electricity usage Unit selection button - press this button to see kW per hour, press again to see the resulting CO2 per hour on this screen. This is what you have set as The shaded area inside the dial your daily target/budget. -
Page 8: Your Electricity Generation
Your electricity generation If you have a source of generating electricity such as solar panels or other micro-generation systems installed in your house and a Smart Meter configured for co-gen tariff then depending upon how much electricity you are generating you will be able to see this display on the main screen. This is what you have set as your This symbol shows when electricity generation capacity. -
Page 9: Displays Associated With The 'View Selection' Button
Displays associated with the ‘View selection’ button Identify your power hungry Daily total usage display Compare day display appliances! Pipit can help you identify how much energy each electrical appliance is consuming in terms of watts/kW and what are its cost implications. -
Page 10: General Information
Device information Touch Info button on the Menu screen to see your device information. Info For further information such as signal strength or the display unit’s serial number, touch the ‘i’ button on the below screen. What is Signal Strength? Signal strength is important for your Display to communicate with your electricity meter. -
Page 11: Message Notification
Message notification To see your messages, press the Message button on the Menu screen. Messages It will show you the below screen, listing your read and unread messages. Unread messages appear in bold with a dot in front. Here it shows you have 3 read messages and 2 unread Important notifications sent to your inbox will pop up messages. -
Page 12: Your Electricity Usage History
Your electricity usage history By touching the History button on the Menu screen History allows you to display and compare your net electricity usage over the last hour, day, week, month or year. Press to see your electricity Press to see your electricity usage graph. - Page 13 Electricity usage history By touching the Graphs button on the History Graphs screen will display a range of graphs that will show What is a kWh? how much net electricity you have used over the Electricity usage is last 24 hours, 45 days, 8 weeks or 13 months. measured in kilowatt-hours (kWh) unit.
- Page 14 Your net daily electricity usage graph for the last 45 days including the current day See your daily usage pattern at a glance! The graph indicates your highest and lowest consumption periods. Tap on a bar to see hourly Your daily electricity usage breakup of your net electricity budget as configured in the usage in 24 hours.
- Page 15 Your net weekly electricity usage graph for current and preceding 7 calendar weeks Tap on a bar to see daily breakup of your net electricity usage of the selected week. This net weekly electricity usage graph tells that in the last eight weeks your highest electricity usage is 1.15 kWh, your total electricity usage is 2.82 kWh and your weekly average electricity usage is 564 Wh.
- Page 16 Your net monthly electricity usage graph for current and preceding 12 calendar months See your monthly usage pattern at a glance! Take a note of the months you have spent most and less on electricity. Tap on a bar to see weekly breakup of your net electricity usage of the selected month.
- Page 17 Electricity usage history By touching the Compare button on the History Compare screen will help compare your net electricity usage over the last day, week, month or year. Press this Day button to display your net electricity usage this This is how much net electricity week and last week, press you have used today.
- Page 18 Electricity usage data table By touching the Table button on the History screen Table will display your net electricity usage over the last 24 hours, 45 days, 7 weeks or 12 months. Press this Hour button to display your net electricity usage over the last 45 days, This is how much net electricity press again to see net usage...
- Page 19 Your net daily electricity usage data table See your daily usage data! Take a note of how much you spent on electricity and when. Press to scroll through preceding 7 weeks, a week at a time will be This is how much net electricity displayed here.
- Page 20 Your net weekly electricity usage data table This is how much net electricity you have used in the current and preceding 7 weeks. Start day of the week beginning Net electricity you have used in October 2014. the week of 27 October 2014.
- Page 21 Your net monthly electricity usage data table This is how much net electricity you have used in the current and preceding 12 months. Save energy and cost! Switch off at the mains everything which is on Net electricity you have used in standby, like your TV, PC the month of April 2014.
-
Page 22: Erasing Usage Data
Erasing usage data Erase Data The Erase Data button from the Advance Settings menu allows erasing all historical data from your Pipit (refer to the ‘Advanced Settings’ page). You will require the PIN code to use this feature. On entering the correct PIN the above confirmation will appear. -
Page 23: Changing Configuration
Changing configuration The Settings button on the Menu screen will enable Settings you to make simple changes to your Display’s configuration and includes budgeting features. Target - press to setup your electricity usage budget. This together with electricity usage readings received from your meter Backlight - press to select decides the scaling on your display whether you wish the display... -
Page 24: Daylight Savings Time
Daylight Savings Time What is DST ? Daylight Savings Time (DST) is the practice of advancing the standard time by one hour or more at the onset of summer each year and setting it Daylight Saving - press to back by the same hour at switch the DST (Daylight the end of summer to Savings Time) on/off. -
Page 25: Advanced Settings
HAN is the home area network built into your Smart Meter and Pipit 500. Important: You will require the PIN code to change advanced settings. -
Page 26: Pin Code For Advanced Settings
PIN code for advanced settings The PIN code entry keypad shown here will pop-up on your display when you attempt to change any of the advanced settings. The correct PIN code ‘1793’ will allow the change request. PIN Code entry page Warning for wrong PIN entry Enter the PIN code using this keypad and then press OK. -
Page 27: Budgeting
Budgeting Target This Target button on the Settings screen allows you to budget for your electricity usage. The budget you set here together with usage readings received from your meter decides the scaling on your display usage dial. In the above screen simply press the number to access the keypad, enter the limit you would normally use in a day, and then press OK. -
Page 28: Your Electricity Generation Capacity
Your electricity generation capacity This Gen Capacity button on the Advanced Settings Capacity screen allows you to define your solar electricity generation capacity. Pipit uses this value to decide the scaling on your electricity generation dial. This is how much electricity generating capacity defined in your Pipit. -
Page 29: Your Tariff
Your tariff This Tariff button on the Advanced Settings screen allows you to set up Tariff indicative tariff rate. This feature ensures your electricity usage approximates Flat tariff correctly with your actual usage. You can set up either flat or flexible tariff. Your display unit is setup with flat price by default. - Page 30 Flexible tariff A ‘flexible’ tariff is one where the rate (c/kWh) varies at different times of the day, Tariff or for different days of the week. In a ‘flexible’ tariff you can set up weekdays and weekends separately. Each has up to four configurable time periods that can have different rates.
-
Page 31: Your Export Tariff
Your export tariff This Gen Tariff button on the Advanced Settings screen Gen Tariff allows you to set up indicative export tariff rate for generating electricity. Pipit uses this value to calculate the amount of electricity you are generating now. This is how much you are paid back for generating each kWh of electricity. -
Page 32: Carbon Avoidance Factor
Carbon avoidance factor CO2 Factor This CO2 Factor button on the Advanced Settings screen allows you to define the CO2 avoidance factor. Pipit uses this value to decide the scaling on your CO2 kg/hour dial. This is how much CO2 kg per kWh defined in your Pipit. -
Page 33: Using Your In-Home Display On Battery
Using your In-home display on battery You might wish to move your In-home display away from the wall power socket, for example, to know how much power your washing machine or the electric kettle is using. In order to do that make sure the unit has two AAA- size batteries* inserted in its battery compartment at the back. -
Page 34: Inserting Battery Into Your Pipit
Inserting battery into your Pipit You will find the battery compartment at the back of your display unit. Open the battery compartment as shown in step 1 and then insert the two AAA batteries the correct way round. Put the battery cover back by sliding the cover grooves on to the two lugs of the bracket as shown in step 3. Step 1 Step 2 Step 3... -
Page 35: Connecting The Power Cable With The Display Unit
To connect the cable to the display unit hold the small end of the cable vertically with symbol ‘B’ facing towards you and then push it into the socket at the back of the display. Secure the power connector by pushing the cable into the groove of the cable grip. -
Page 36: Pairing Your Display Unit With Smart Meter
Pairing your display unit with Smart Meter The pairing process is a self-running process, similar to connecting two devices over Bluetooth. Access the pairing wizard ‘pair with Smart Meter’ tab from our website www.freedomtosave.com.au which can guide you through the pairing process. It can take up to 10 minutes for your Pipit to pair with Smart Meter. Important: For the unit to pair automatically, make sure pairing window of the Smart Meter is open so that the meter can accept connection requests from your Pipit. - Page 37 IHD paired successfully IHD pairing unsuccessful icon in the top left-hand corner of the display indicates icon in the top left-hand corner of the display indicates that your Pipit is not paired with smart meter. This can that your Pipit is now paired with smart meter. Press OK. You happen due to communication failure.
- Page 38 You can un-pair (or pair) your Pipit manually by using the Network button on the Advance settings (refer to the ‘Advanced Settings’ page). You will require the PIN code to do this. You will see the following confirmation display on entering the correct PIN. Press OK to proceed un-pairing.
-
Page 39: Wall Mounting Your Display Unit
Wall mounting your display unit Select a suitable position on the wall where you wish to mount your Pipit. Hold the Pipit’s mounting bracket upright against the wall, leaving at least 50 mm space above, 20 mm space below and 40 mm space on either side so that the unit can be fitted on to the bracket as shown here. - Page 40 Step 1 Step 2 Step 3 Dimensions Pipit 500 Pipit’s wall mounting bracket...
-
Page 41: Troubleshooting
Troubleshooting Why is the main display showing ‘_’ instead of a value? Most likely there is a ‘No Comms’ issue, meaning your display unit is not receiving information from the electricity meter. The reason could be poor signal strength, it will update the display automatically once the signal strength gets better. - Page 42 What will happen if I unplug my Display unit? The display will turn off when not powered and will turn on when powered back again. If required, you can also operate your Display unit on battery. See page 18 and 19 for further details on how to operate your Display unit on battery.
- Page 43 Can I use my Pipit 500 at our new address? If you are changing house then you should re-pair your Pipit 500 with the Smart Meter connected at your new address. Can I delete messages from my display unit? Some messages from the retailer are deleted automatically.
- Page 44 258 Darebin Rd Fairfield VIC 3078 www.securetogether.com www.freedomtosave.com.au Copyright © 2013, SIHPL. All rights reserved. E&OE. Pipit 500® is a registered trade name of Secure Meters Ltd. Other product names are trademarks or registered trade names of their respective owners.
Need help?
Do you have a question about the Pipit 500 and is the answer not in the manual?
Questions and answers