Table of Contents
Advertisement
Quick Links
Advertisement
Table of Contents

Related Manuals for Omron EQ100-E

Summary of Contents for Omron EQ100-E
- Page 1 Sensor Network Server Model EQ100-E User's Manual Catalog No. N196-E1-01H...
- Page 2 (3) Best efforts have been applied to make sure that the details in this manual are correct; however, if there are any points which are incorrect or seem to be incorrect, please contact a branch office of Omron or one of its sales offices given at the end of this manual.
- Page 3 Introduction Thank you for purchasing the Sensor Network Server EQ100 (hereinafter called EQ100). The EQ100 provides you with a method of visualizing energy amounts by collecting and accumulating measured data on a regular basis using devices such as power monitor, particle sensor, temperature controller and PLC.
- Page 4 (a) Exclusive Warranty. Omron’s exclusive warranty is that the Products will be free from defects in materials and workmanship for a period of twelve months from the date of sale by Omron (or such other period expressed in writing by Omron).
-
Page 5: Meanings Of Signal Words
Meanings of Signal Words To ensure the safe use of the EQ100,we use several safety icons to alert the reader to certain safety issues in this manual. The warning messages listed here indicate extremely important safety issues. Be sure to follow these guidelines. The icons and their meanings are as follows: The following signal words are used in this manual. - Page 6 WARNING A lithium battery is used for memory backup. Do not disassemble, apply pressure to deformation, overheat to more than 100°C, and/or burn it. Otherwise serious injury may occasionally occur due to fire and/or explosion. Injury and damage to objects may occur due to electrocution, fire and faults. Do not place pieces of metal and wire debris into the product.
-
Page 7: Precautions For Safe Use
Precautions for Safe Use Observe the following precautions to ensure safe operation. 1) Do not store and manage, install, or use the product in any of the following ways. In a place with large vibrations or which is greatly influenced by shocks ・... -
Page 8: Precautions For Correct Use
Precautions for Correct Use 1) Be sure to mount screws and terminal screws to the main unit with the specified torque. 2) When connecting to a power source, make the power reach the rated voltage within 2 seconds. Not doing so may result in this product not functioning correctly. 3) The battery has a finite life. -
Page 9: Definition Of Terms
Definition of Terms Shown below are terms related to EQ100. Term Description A measured value itself. One that is not handled as data by a Measured Value collecting device or a computer yet. A measured value that is integrated, such as electric energy and Integrated Value gas flow rate. - Page 10 Differential Processing measured value. It is a process for integrated values such as electric energy and integrated flow rate. OMRON's dedicated serial communications protocol supported by CompoWay/F OMRON's component devices. A function to view data incorporated into EQ100. It allows a user to...
- Page 11 Term Description is used. A computer that collects data from EQ100 using EQ-ServerService. EQ Server It acts as a server under a server-client configuration. EQ-Watcher Paid software to view realtime measured data such as energy usage.
-
Page 12: Manual Revision History
Manual Revision History A manual revision symbol is added to the end of the catalog number on the front and back covers. Catalog No. N196-E1-01H Revision code Revision Date Revised contents code June 2013 First edition June 2013 - Revised due to EQ-Viewer version upgrade. - Corrected incorrect description. -
Page 13: Related Manual
Related Manual Catalog No. Manual Title Details N198-E1-01H EQ-Viewer User's Describes functions and usage of the graph Manual display tool EQ-Viewer. -
Page 14: Table Of Contents
Table of Contents Introduction ............................1 Meanings of Signal Words ........................3 Meanings of Alert Symbols ......................... 3 Precautions for Safe Use ........................5 Precautions for Correct Use ........................ 6 Definition of Terms ..........................7 Manual Revision History ........................10 Related Manual .......................... - Page 15 6.1.1. Preparation ........................6-2 6.1.2. Measurement Device Setup ..................6-3 6.2. Connection between EQ100 and Measurement Device ........... 6-7 6.2.1. Wiring for LAN-Connected Measurement Device ............6-8 6.2.2. Wiring of RS-485-Connected Measurement Device ..........6-10 6.2.3. Connection to Pulse Output Measurement Device ........... 6-11 EQ100 Settings .........................7-1 7.1.
- Page 16 9.1. Overview of Web UI Function.................... 9-1 9.1.1. Operating Environment ....................9-2 9.2. Connecting from Web Browser ..................9-4 9.3. Top Screen ........................9-7 9.4. Monitoring Screen ......................9-8 9.5. Simple Graph View > Current Value Monitor ..............9-10 9.6. Simple Graph View > Graph View ...................9-13 9.7.
-
Page 17: Overview Of Eq100
1. Overview of EQ100 Overview of EQ100 1.1. Overview EQ100 is energy data collecting equipment that periodically collects measured data from measurement devices connected to RS-485 communications port and LAN port and stores the data in its internal memory. EQ100 can connect a variety of measurement devices to collect a large amount of measured data. -
Page 18: Overview Of Graph Display Tool
1. Overview of EQ100 1.3. Overview of Graph Display Tool EQ-Viewer, included in the attached CD-ROM, is an integrated software package to materialize configuration for EQ100 to collect measurement device data, graph display and analysis of the collected data, and information sharing in an organization. It contributes to materialization of "visualization at the site level"... - Page 19 1. Overview of EQ100 EQ-Viewer contains the following software components: Name Description EQ-Manager EQ-Manager is software to configure settings and manage operation of EQ100 itself as well as the EQ server. Major functions include: - Setup: EQ100 setting, measured data collecting setting, monitoring setting - Operation/display: EQ100 operation, status display EQ-GraphViewer...
- Page 20 1. Overview of EQ100 ■Project to be Created by EQ-Manager To run EQ100 and EQ server, a project must be created by EQ-Manager and written to EQ100 and EQ server respectively. There are following two types of projects: Project Name Description EQ Project A project that describes operation settings of EQ100.
-
Page 21: Functional Overview Of Eq100
1. Overview of EQ100 1.4. Functional Overview of EQ100 EQ100 provides various functions including energy data collecting that collects and stores measured data from measurement devices, communications with an upper level system, external interface such as Web UI, maintenance function such as saving and loading of settings and updating of the firmware. -
Page 22: Energy Data Collecting Function
1. Overview of EQ100 1.4.1. Energy Data Collecting Function The energy data collecting function of EQ100 stores measured data from measurement devices connected to a network connection port and/or RS-485 communications ports as well as measured pulse data from the general-purpose input terminal of the EQ100 into the internal memory. - Page 23 1. Overview of EQ100 1.4.1.3. Pulse Measurement Function This function allows measurement of pulse count from a pulse-output measurement device connected to the general-purpose input terminal of EQ100. Pulse Measurement Device EQ100 Reference - EQ100 has a conversion function from pulse count to actual measured value, which allows converted measured value to save instead of the pulse count.
- Page 24 1. Overview of EQ100 1.4.1.5. Monitoring Function The monitoring function operates external output terminals and/or sends email notification when collected measured data meets the configured condition. Pulse EQ100 General-Purpose Output External Measurement Device Device Email Notification Collecting Output Judgment SMTP Server An alarm is judged by specified measured data getting over or under the configured control values.
-
Page 25: External Interface Function
1. Overview of EQ100 1.4.2. External Interface Function The external interface function includes the upper level system interface for communications with an upper level system such as the EQ server, Web UI function for simple graph view and maintenance, and measured data output to an SD card. 1.4.2.1. -
Page 26: Maintenance Function
1. Overview of EQ100 1.4.2.3. SD Card Output Function This function outputs collected data to an SD card. The collected data is outputted to an SD card once a day. In addition, operating on the Web UI screen or pressing the SD card save button outputs stored data at the time of the operation without waiting for periodical output. -
Page 27: System Configuration Example
1. Overview of EQ100 1.5. System Configuration Example Shown below are typical system configurations of EQ100. 1.5.1. Standalone Configuration EQ100 is operated without connecting to an upper level system, and collected data are taken out when necessary. A user can view EQ100 status and collected data graph and perform maintenance through a Web browser on a computer directly connected to EQ100. -
Page 28: Network Configuration
1. Overview of EQ100 1.5.2. Network Configuration One EQ server can manage multiple EQ100s that are connected via LAN. The EQ server performs logging of collected data file stored in EQ100s in a specified period and saves into the summary DB. EQ-GraphViewer allows graph view and analysis of summary data in the EQ server to share information in an organization. -
Page 29: Configuration With Ftp
1. Overview of EQ100 1.5.3. Configuration with FTP Collected data saved in EQ100 is transferred using the FTP protocol based on a request from an upper level system. Collected data can be taken out in a specified period. Analysis by customer's application or Excel - Setting by EQ-Manager - Web UI Function... -
Page 30: Eq100 Input/Output And Internal Configuration
1. Overview of EQ100 1.6. EQ100 Input/Output and Internal Configuration There are two types of data collecting for EQ100: communications with measurement devices and pulse input from the general-purpose input terminal. - Measured data can be collected from measurement devices connected through an RS-485 communications port and LAN connection port. - Page 31 1. Overview of EQ100 ■EQ100 Internal Input/Output Diagram PC Tool Web UI Function Aggregating Manually taking out collected data Displaying collected data file Collected measured value (d) save in SD card Data File Measurement Interval: 1 min, 5 min, 10 min, 30 min, 60min Pulse conversion Converted...
-
Page 32: Specifications
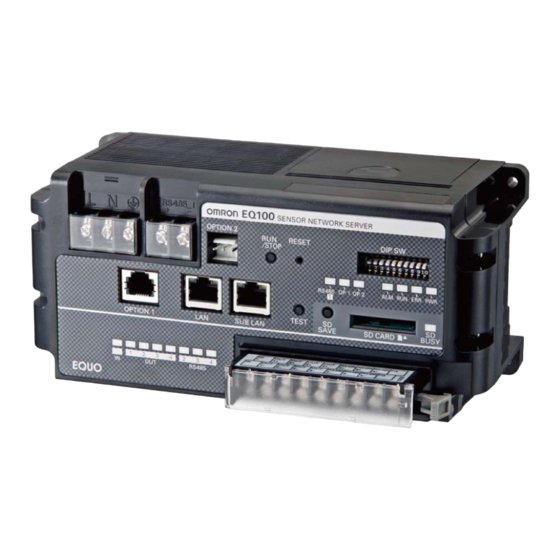
2. Specifications Specifications 2.1. Part Name 2.1.1. EQ100 Front End Indication Name Function Supply Terminal (M3.5 To connect to 100 to 240 VAC power screw) source. Grounding Terminal (M3.5 To connect to ground wire. screw) RS-485 Communications To connect to RS-485-connected Port #1 Terminal RS485_1 measurement device. - Page 33 2. Specifications Indication Name Function To connect a LAN cable for a Sub-LAN Connection Port SUB LAN LAN-connected measurement device or a (RJ-45) Web UI computer.(*1)(*2) Turns on when the general-purpose input is Input Status Indicator The indicators turn on when the OUT□...
-
Page 34: Eq100 Top View
2. Specifications 2.1.2. EQ100 Top View Name Function Inside this cover the memory backup battery is placed. Battery Compartment Cover The cover can be removed by sliding it backward while pressing its center. On the label the MAC addresses of LAN connection port (MAC1) and sub-LAN MAC Address Label connection port (MAC2) are printed (12-digit... -
Page 35: Button
2. Specifications 2.1.3. Button Response Execution Indication Application Condition Accept Result Others - Under setup status Press to proceed to the collecting status. Pressing the RUN/ button - Under collecting status STOP Press to proceed to the setup (1 second or status. -
Page 36: Indicator
2. Specifications 2.1.4. Indicator Indication Name Color Status Meaning Operating under normal mode Flashing Processing activation Operation Status Green Special Indicator Operating under safe mode flashing No power supply Instrument Failure: An error occurred and the device cannot be activated. An error occurred upon Flashing installation/setup/connection and the... - Page 37 2. Specifications Indication Name Color Status Meaning General-Purpose Input Status The general-purpose input is Orange Indicator General-Purpose Output 1 The general-purpose output 1 OUT□ Green Status Indicator is on. General-Purpose Output 2 The general-purpose output 2 OUT□ Green Status Indicator is on.
-
Page 38: Connector/Terminal Name
2. Specifications 2.1.5. Connector/Terminal Name ●Power Supply Terminal Terminal Block Screw Size: M3.5 Ground Terminal Power Supply Terminal Name Indication Details Power Supply Supplies 100 to 240VAC. Terminal For higher noise resistance and electric shock prevention, apply class D grounding (class 3 grounding). Ground Terminal Connect the shield wire for RS-485 communications cable connected to RS-485 communications port #1 to this... - Page 39 2. Specifications ●General-purpose input, general purpose outputs #1 to 4, RS-485 communications ports #2 to 4, FG terminals (terminal block) Name Indication Details Terminal for general-purpose input. To connect General-Purpose Input to pulse output of a measurement device. Terminal OUT1+ Terminal for general-purpose output 1.
- Page 40 2. Specifications ●LAN Connection Port A port to connect a LAN cable for the upper level system (EQ server, EQ-Manager, SMTP server, SNTP server, FTP client) or a Web UI computer. A measurement device can be connected as well. A commercial LAN cable for 10BASE-T/100BASE-T can be used (shielded cable of category 5 or higher is recommended).
-
Page 41: Dip Switch
2. Specifications 2.1.6. DIP Switch No. Item Setting Priority Remarks (Not used) Set to Always OFF. (Not used) (Not used) (Not used) (Not used) (Not used) Write an EQ ON(*) After the startup of EQ100, an Set before turning project EQ project is automatically on the power or written. -
Page 42: Sd Card Slot
2. Specifications 2.1.7. SD Card Slot The SD card access indicator turns on when a writable SD card is attached to the SD card slot while EQ100 is operating. If the SD card access indicator does not turn on when the SD card is attached, the card may be write-protected or not supported by EQ100. -
Page 43: Memory Backup Battery
2. Specifications 2.1.8. Memory Backup Battery This product has a battery for memory backup to keep collected data and built-in clock upon blackout. The battery is attached inside the top cover, while the battery connector is not attached upon factory shipment. Before using the product, attach the battery connector and place the cable as shown in the figure (see "5.2. - Page 44 2. Specifications Precautions for Correct Use - The memory backup battery is a consumable item. When the battery's remaining capacity becomes low, the device alarm indicator on the product's front end turns on and the battery must be replaced to new one. - Turn off the power before replacing the battery.
-
Page 45: Ratings And Performance
2. Specifications 2.2. Ratings and Performance 2.2.1. Hardware Specifications Item Details Supply Voltage 100 to 240 VAC 50/60 Hz 85 to 264 VAC 50/60 Hz Allowable Power Supply Voltage Range Power Consumption 15VA or less LAN and Ports 2 ports sub-LAN Interface 10BASE-T/100BASE-TX... - Page 46 2. Specifications Item Details Between power terminals and general-purpose input, general purpose outputs #1 to 4, RS-485 communications ports #1 to 4, LAN, sub-LAN, OPTION1, OPTION2: 1500 VAC for 1 minute Between ground, FG terminal and OPTION1, OPTION2: 500 VAC for 1 minute Vibration Resistance (*) 10 to 150Hz: Half amplitude of 0.1mm, acceleration of 15 m/s for each of 3 axes of 8 minutes x10 sweeps...
-
Page 47: Software Specifications
2. Specifications 2.2.2. Software Specifications Item Details Operation Normal Mode There are following three modes when operated normally: Mode Setup A status to configure the EQ100, register a Status measurement device, and perform communication test. Collecting A status to collect and monitor energy data. Status Under the collecting status, the setup cannot be changed. - Page 48 2. Specifications Item Details SNTP Server Internal Event Function A normal event occurrence other than monitoring alarm and device alarm is collected into the internal memory. Log to Internal An occurred event is saved into the internal memory. The Memory event log can be checked on the Web UI screen and outputted as an event log file.
- Page 49 2. Specifications Item Details Contact Function An alarm can be outputted to a general-purpose output Output terminal when a monitoring condition is met. Email Function - Monitoring alarm notification email: Sent upon a Notification monitoring alarm occurrence. - Device alarm notification email: Sent upon an occurrence of an instrument failure, setup/status, device, communications, and/or monitoring process of EQ100.
- Page 50 2. Specifications ■EQ100 Output File The following data are saved in the internal memory as EQ100 output files. Some files are created by collecting and EQ project files are created by EQ-Manager. ●Files created by EQ100 Yes: Available, N/A: Not available How to Take Out File Details...
- Page 51 2. Specifications ■Available SD Card Memory Capacity Available memory capacity of an SD card depends on a collecting interval, measurement channels, and storage duration. e.g.) In case of a collecting interval of 1 minute and 500 measurement channels, based on storage durations the memory capacities to save on an SD card are shown below.
-
Page 52: Supported Devices
EQ100 may not be the same. *3: E5CC and E5EC with RS-485 communications function are supported. *4: OMRON's CPU unit with CJ series EtherNet/IP port and EtherNet/IP unit are supported. *5: No connection interface with EQ100 as EQ100 collects data via WZ-MLAN01. - Page 53 2. Specifications Reference - A measurement device that can log measured data by itself, e.g. KM100 and ZN-KMX21, logs measured data with its internal clock. EQ100 collects measurement data using its internal clock from measurement devices. Collecting of measured data by a measurement device itself and EQ100 are separately performed.
-
Page 54: Network
2. Specifications 2.4. Network ■Network Specifications Shown below are EQ100 network specifications: Item Specifications Interface Ethernet Ports Connector RJ-45 Type CSMA/CD Modulation Baseband Standards 10BASE-T/100BASE-TX 10BASE-T 100BASE-TX Transmission Rate 10Mbps 100Mbps Transmission Media Twisted-pair cable (unshielded: Twisted-pair cable (unshielded: UTP): UTP): Category 5 or 5e Category 3, 4, 5, or 5e Twisted-pair cable (shielded:... -
Page 55: Dimensions
2. Specifications 2.5. Dimensions ■Top View ■Front View (Unit: mm) 2-24... -
Page 56: Operation Mode And Status
3. Operation Mode and Status Operation Mode and Status 3.1. Operation Mode EQ100 has normal mode and safe mode as its operation mode. The normal mode is a status under which the system is properly running as a sensor network server. -
Page 57: Setup Status And Collecting Status
3. Operation Mode and Status 3.2. Setup Status and Collecting Status Under the normal mode, there are a "setup status" to configure settings and a "collecting status" to collect and save measured data. Statuses transition as shown below: Startup in Normal Mode Setting Status before Collecting status before Power ON/Reset... - Page 58 3. Operation Mode and Status ■Status Change after Power On or Reset Power ON or Reset Initialization DIP Switch SW10 DIP Switch SW8 Firmware Update from SD card DIP Switch SW7 EQ Project Loading from SD card Collecting Status before Power ON/Reset Collecting or Setup Status before Power ON/Reset...
-
Page 59: Specifications Of Operation Mode And Status
3. Operation Mode and Status 3.3. Specifications of Operation Mode and Status Operation Mode/Status Definition Transition to Other Status Startup Process The system is under startup When an instrument failure occurs, processing in normal mode or the status transitions to "system safe mode after turning on the error status". -
Page 60: Basic Operation Steps
4. Basic Operation Steps Basic Operation Steps This chapter describes basic operation steps of EQ100. For detail setup and operations, see reference for each step. 4.1. [STEP 1] Standalone Configuration Described below are basic operation steps for a standalone configuration operated by the Web UI function only. - Page 61 4. Basic Operation Steps [Step 3] EQ100 Time Setting by Web UI Operation Configure the time for the built-in clock of EQ100 by Web UI operation. 1) Configure the computer's IP address as "192.168.200.***"(*** is a value different from EQ100's IP address) and the subnet mask as "255.255.255.0". 2) Connect a LAN cable between the computer and the LAN connection port of EQ100.
- Page 62 4. Basic Operation Steps [Step 8] Writing EQ Project ●Writing through SD Card ●Writing through LAN from EQ-Manager 1) Save an EQ project on an SD card 1) Connect a computer for setup to EQ100 2) Insert the SD card to EQ100 via LAN 3) Configure the setup DIP switch SW7 of 2) Connect online from EQ-Manager to...
-
Page 63: Step 2] Network Configuration With Eq Server
4. Basic Operation Steps 4.2. [STEP 2] Network Configuration with EQ Server In case of a network configuration using an EQ server, the following steps are required in addition to the [STEP 1]. Connecting directly to PC Setting Graph View/Analysis for logging EQ Server EQ Server... - Page 64 4. Basic Operation Steps [Step 2] Writing EQ Server Project 1) If EQ-Manager and EQ-ServerService are not on the same computer, connect a computer for setup and the EQ server (a computer with EQ-ServerService installed) via LAN. 2) Connect online from EQ-Manager to the EQ server: In the [Logger] menu, select [Online] 3) Write the EQ server project from EQ-Manager to EQ server: In the [Logger] menu, select [Write Settings]...
-
Page 65: Reference] Taking Out Collected Data Using Sd Card
4. Basic Operation Steps 4.3. [Reference] Taking Out Collected Data Using SD Card Data files collected by EQ100 can be taken out using an SD card. Described below are basic steps to take out and handle collected data using an SD card. ●Viewing/Analyzing Graph with Commercial Software such as Excel Graph View/Analysis by commercial software e.g. - Page 66 4. Basic Operation Steps 【Step1】 Perform [Step 1] adding to the setting to be performed in the standalone configuration. [Step 1] Configuring Conditions to Save on SD Card To automatically output collected data files from the EQ100 internal memory to an SD card, follow the steps below: - Use EQ-Manager to select [Advanced Setting] - [SD Card Output Setting] “8.
-
Page 67: Installation And Wiring
5. Installation and Wiring Installation and Wiring 5.1. Precautions on Installation Installation must take into the following items into account for higher authenticity and performance of EQ100. ■Installation Location For installation, avoid the locations: ・ subject to large vibration or shock impact ・... -
Page 68: Battery Connection
5. Installation and Wiring 5.2. Battery Connection This product has a battery for memory backup to keep collected data upon blackout. Precautions for Correct Use - The memory backup battery is a consumable item. When the battery's remaining capacity becomes low, the device alarm indicator on the product's front end turns on and the battery must be replaced to new one. - Page 69 5. Installation and Wiring 4) Remove the caution label for the memory backup battery attached on the top of the EQ100. Caution Label of Battery Connection Cover Precautions for Correct Use - Before using the product, always remove the caution label for the memory backup battery attached on the top of the EQ100.
-
Page 70: Mounting Inside The Cabinet
5. Installation and Wiring 5.3. Mounting Inside the Cabinet Typically the product is mounted to the cabinet using a DIN rail. Before mounting the product on a DIN rail, always attach the memory backup battery. For attaching, refer to the steps described in “5.2. Battery Connection". Use the following steps to mount the product to a DIN rail. -
Page 71: Screw-Mounting
5. Installation and Wiring 5.4. Screw-Mounting To mount the product using screws, make mounting holes with the following sizes, attach the specified screws, and apply the appropriate tightening torque to mount the product. - Screw to Use : M4 - Specified Torque : 1.2 N・m This product does not include the mounting screws. -
Page 72: Wiring Description
5. Installation and Wiring 5.5. Wiring Description 5.5.1. Power and Grounding Wires AC Power 100 to 240V Class D Grounding (Class 3 Grounding) Precautions for Correct Use - Connect the power to the power terminals (L-terminal, N-terminal. Be sure to connect to the correct terminal board. -
Page 73: Communication Port
5. Installation and Wiring 5.5.2. RS-485 Communication Port ■RS-485 Communications Port Wiring This product has four RS-485 communications ports for RS-485-connected measurement devices. Up to 31 devices can be connected to one port. Maximum transmission distance is 500 m for RS-485 communications. For an RS-485 communications port cable, a shielded twisted-pair cable of AWG24 to14 (0.205 to 2.081 mm ) or higher must be used. - Page 74 5. Installation and Wiring Precautions - Keep a little room upon wiring of RS-485 communications port terminal and a communications cable. - It should make easier the dismounting task of EQ100 for battery replacement. ■Terminal Screw and Crimping Terminal RS-485 Communications Port #1 Terminal Screw M3.5 captive screw Recommended Wire Size...
-
Page 75: General-Purpose Output Terminal
5. Installation and Wiring 5.5.3. General-Purpose Output Terminal ■Checking Input/Output Specifications Check the input/output specifications of the general-purpose input/output terminals. Applying a voltage over the rated one to the input terminal, or a voltage over the maximum load voltage to an output terminal, may result in a failure, disruption, or fire. -
Page 76: Lan Connection Port
5. Installation and Wiring ■Input/Output Devices For selection and connection of devices to the general-purpose input/output terminals, refer to the followings: ●Example of Input Device and EQ100 Internal Circuit EQ100 Internal Circuit Input(+) Power for Input 10.2 to 26.4 VDC Input(-) Zener Diode (33 V) -
Page 77: Sd Card
5. Installation and Wiring 5.5.5. SD Card ■SD Card Available on EQ100 Card Form Factor Full size (an adapter must be used for miniSD and microSD) FAT 16 for SD card, FAT32 for SDHC card File System Speed Class Class 2 or higher (SDHC card) Precautions - Use an SD card with an operating range wider than that from -25 to 85°C. - Page 78 5. Installation and Wiring ■Ejecting an SD Card To eject an SD card from the SD card slot, always use the following steps. (1) Press and hold the SD card save button for 5 seconds or longer. (2) After the buzzer sound stopped and the SD card access indicator turned off, release the SD card save button.
-
Page 79: Measurement Device Setup And Connection
6. Measurement Device Setup and Connection Measurement Device Setup and Connection 6.1. Measurement Device Main Body Setup and Measurement Setup Before connecting a measurement device to EQ100, main body setting including communications setting and measurement setting must be configured for each measurement device. -
Page 80: Preparation
6. Measurement Device Setup and Connection 6.1.1. Preparation The description below is for reference of measurement device preparation to connect to EQ100. Actual system construction must be planned, designed, and performed by the customer. ■Preparation ●Measurement Device Yes: Required, No: Not required Device Type Method Main... -
Page 81: Measurement Device Setup
6. Measurement Device Setup and Connection ●Wire & Connection Device Power cable (100 VAC), RS-485 communications port cable, LAN cable, switching hub USB cable (for KM1/KE1, A-miniB) USB cable (for WZ series, accessory of WZ-MLAN01) ●Computer for Setup Software Install the setup software for each measurement device. ●Documentation of Measurement Devices User's Manual/Communications Manual for Measurement Devices - The operation manual attached to a measurement device may not include necessary... - Page 82 6. Measurement Device Setup and Connection To a wireless slave unit of command-response communications (CompoWay/F)(WZ-SRS01), an RS-485-connected measurement device is connected. In such a case, a combination of its group ID, wireless unit ID, and the unit number of the RS-485-connected measurement device (CompoWay/F) is its identifier.
- Page 83 6. Measurement Device Setup and Connection Basic Measurement Setup for Setup for EQ100 Type Name (Model) Connection Measurement Devices CT Expansion Unit Electrical system 1/2 applicable (KE1-CTD8E) phase wire, measurement block 1/2 special CT, electrical system 1/2 VT ratio, measurement block 1/2 CT ratio, measurement start time, measurement end time, active input setting...
- Page 84 6. Measurement Device Setup and Connection Basic Measurement Setup for Setup for EQ100 Type Name (Model) Connection Measurement Devices Wireless Unit Slave - Wireless Unit ID (CompoWay/F) - Group ID (WZ-SRS01) - Others (wireless channel, broadcast communications) - RS-485 (communication speed, data length, stop bits, parity, time-out...
-
Page 85: Connection Between Eq100 And Measurement Device
*4: If the ZN-CTX21 firmware is Ver1.03.00 or later, electric energy can be measured. *5: A CPU unit with EtherNet/IP port or an EtherNet/IP unit is required. For the latest information of supported devices, see the latest EQ100 user's manual. http://www.fa.omron.co.jp/... -
Page 86: Wiring For Lan-Connected Measurement Device
6. Measurement Device Setup and Connection 6.2.1. Wiring for LAN-Connected Measurement Device Connect LAN cables to the following LAN ports for measurement devices. Device LAN Connection Port Sub-LAN Connection Port LAN-Connected Available Available Measurement Device Reference - Up to 100 measurement devices can be connected. - Connecting a measurement device to the sub-LAN port of EQ100 as the LAN dedicated to measurement devices enables stable measurement. - Page 87 6. Measurement Device Setup and Connection ●Connection Example between EQ100 and Wireless Device 1 Wireless Master Measurement Device Measurement Device ●Connection Example between EQ100 and Wireless Device 2 Wireless Master Wireless Slave RS-485-Connected Slave WZ-SRS01 Measurement Device...
-
Page 88: Wiring Of Rs-485-Connected Measurement Device
6. Measurement Device Setup and Connection 6.2.2. Wiring of RS-485-Connected Measurement Device EQ100 has four RS-485 communications ports for RS-485-connected measurement devices. Up to 31 measurement devices can be connected to one port (31 x 4 ports= Total 124 devices). Reference - Maximum transmission distance is 500m for RS-485 communications. -
Page 89: Connection To Pulse Output Measurement Device
6. Measurement Device Setup and Connection ■Connection Example ●Connection Example between EQ100 and RS-485-Connected Measurement Device Up to .31 devices per port RS-485 Port 1 RS-485 Port 2 RS-485 Port 3 RS-485 Port 4 Measurement Devices 6.2.3. Connection to Pulse Output Measurement Device A pulse output electric energy meter or flow rate meter can be connected to the general-purpose input terminal of EQ100. -
Page 90: Eq100 Settings
7. EQ100 Settings EQ100 Settings 7.1. Overview of EQ100 Settings To configure the EQ100 settings, an EQ project is required. An EQ project is a file containing configuration information to operate EQ100. An EQ project is created by EQ-Manager and written to EQ100 to configure EQ100. -
Page 91: Creating New Eq Project
For how to install EQ-Viewer, see "EQ-Viewer User's Manual". ■Creation Steps 1) Start up EQ-Manager. Press the Windows Start button, and click [All Programs] - [OMRON] - [EQ-Viewer] - [EQ-Manager]. Or, double-click the EQ-Manager icon on the desktop. EQ-Manager is activated. - Page 92 7. EQ100 Settings 4) Click [OK] to view the EQ project setup menu. Setting Menu...
-
Page 93: Editing Eq100 Ip Address/Device Name
7. EQ100 Settings 7.3. Editing EQ100 IP Address/Device Name This section describes how to edit an EQ project name, device name, and a LAN connection port IP address. ■Viewing/Editing Setup Screen Clicking [EQ Project] in the setup menu displays the following screen. To edit an item, click the respective [Set] button to display the setup dialog box. -
Page 94: Collecting Setting
7. EQ100 Settings 7.4. Collecting Setting 7.4.1. Overview The collecting setting registers measurement devices to connect to EQ100, and registers a channel of the measurement device for collecting. If necessary, register a connection device, create an operation channel, and/or configure a data type. -
Page 95: Connection Device Registration
7. EQ100 Settings 7.4.2. Connection Device Registration ■Function This registration is not required if no wireless unit is to be connected. To connect a measurement device through the wireless master unit, first register the wireless master unit and the wireless/RS-485 converter as a connection device. A wireless sensor or a RS-485-connected connection device must be registered as a measurement device connected to the wireless master unit or wireless/RS-485 converter registered as its connection device. - Page 96 7. EQ100 Settings Shown below are connection devices that must be registered before registration of measurement devices. Measurement Device Required Connection Remarks Device Wireless Device Thermo-Humidity Wireless Unit Master RS-485 connection of the air Sensor (WZ-STH01) particle sensor (ZN-PD-S) (WZ-MLAN01) is available only through a Wireless Device Light Intensity wireless slave unit...
- Page 97 7. EQ100 Settings 3) In the [Add Connection Device] dialog box, enter registration items for the connection device. Item Description Name Enter a name of the connection device. If not entered, "model"+"#"+"connection device address" is automatically set. <Input range> Half-width63 characters (Full-width 20 characters, more or less) Type A list of connection device types appears.
- Page 98 7. EQ100 Settings ■Editing Connection Device To change registration details of a connection device: 1) Click the [Edit] button of the connection device you want to change. 2) In the [Edit Connection Device] dialog box, change the registration details. 3) Clicking [OK] changes the registration of the connection device. ■Deleting Connection Device 1) In the [Connection Device Registration] screen, select the [Select] check box.
-
Page 99: Measurement Device Registration
7. EQ100 Settings 7.4.3. Measurement Device Registration ■Function Register a measurement device to connect to EQ100. To use a wireless device, first register a connection device before registering a measurement device. To use the general-purpose input, register pulse input as a measurement device. ■Adding Measurement Device 1) In the setting menu, click [Measurement Device Registration]. - Page 100 7. EQ100 Settings Item Description Device Name Enter a name of the measurement device. If not entered, "model"+"#"+"IP address" is automatically set. <Input range> Half-width63 characters (Full-width 20 characters, more or less) Device Type A list of measurement device types appears. Select a measurement device type to add.
- Page 101 7. EQ100 Settings <Wireless Measurement Device> Setting Item Description Device Name Enter a name of the measurement device. If not entered, "model"+"#"+"wireless unit ID" is automatically set. <Input range> Half-width63 characters (Full-width 20 characters, more or less) Device Type A list of measurement device types appears. Select a measurement device type to add.
- Page 102 7. EQ100 Settings Setting Item Description Default This function saves operations to channel registration and group Channel registration described later. If the [Default Channel Registration] check box Registration is selected, channel registration and group registration can be done at the same time by measurement device registration.
- Page 103 7. EQ100 Settings <RS-485-Connected Measurement Device> Setting Item Description Device Name Enter name measurement device. entered, "model"+"#"+"CompoWay/F unit number" is automatically set. <Input range> Half-width63 characters (Full-width 20 characters, more or less) Device Type A list of measurement device types appears. Select a measurement device type to add.
- Page 104 7. EQ100 Settings Setting Item Description Default This function saves operations to channel registration and group Channel registration described later. If the [Default Channel Registration] check box Registration is selected, channel registration and group registration can be done at the same time by measurement device registration.
- Page 105 7. EQ100 Settings <EQ100 General-Purpose Input Terminal (Pulse Input) Measurement Device> Setting Item Description Device Name Enter a name of the measurement device. If not entered, "EQ100 PULSE"+"#" is automatically set. <Input range> Half-width63 characters (Full-width 20 characters, more or less) Device Type Select [EQ100 PULSE].
- Page 106 7. EQ100 Settings ■Batch Registration Multiple measurement devices can be registered together in the [Add Measurement Device] dialog box. This function, however, configures the same settings for device address and others. You need to edit the settings after the batch registration. In this section, assume batch registration of KM100 as an example.
- Page 107 7. EQ100 Settings Setting Item Description Registered Enter the number of measurement devices to register. Number Address If you select this check box, you can register IP addresses or unit Increment numbers increased step-by-step by one from the one entered in the [Add Measurement Device] screen.
- Page 108 7. EQ100 Settings ■Deleting Measurement Device 1) In the [Measurement Device Registration] screen, select the [Select] check box. 2) Click [Delete]. 3) In the confirmation dialog box, click [Yes] if you are sure. Precautions for Correct Use - Deleting a measurement device deletes its channels that are registered as well. ■Enabling/Disabling Logging You can stop logging from a measurement device while keeping the measurement device registration as it is.
-
Page 109: Channel Registration
7. EQ100 Settings 7.4.4. Channel Registration ■Function Required channels of those retained by a measurement device can be registered as EQ100 collecting target. Depending on a registered measurement device and default channel registration, number of channels to register and registration steps differ. Condition Registration Availability/Method Default channel registration has been done on... - Page 110 7. EQ100 Settings <PLC> Setting Item Description Device Name Enter a name of the PLC measurement device. Channel Name Enter a channel name. If not entered, "Measurement Device Name"+"#"+"channel address" is automatically set. <Input range> Half-width63 characters (Full-width 20 characters, more or less) Data Type Select a data type.
- Page 111 7. EQ100 Settings <General-Purpose Input> Setting Item Description Device Name Enter a name of a device connected to the EQ100 general-purpose input terminal. Channel Name Enter a channel name. If not entered, "device name"+"#"+"PULSE" is automatically set. Destination Group to If the [Destination Group to Add] check box is selected, channels can be registered to a specified group at the same time.
- Page 112 7. EQ100 Settings <Others (other than PLC/EQ-100 connected to General-Purpose Input terminals)> Select the [Select] check box of the channel you want to register. The channels that have been registered already are shaded with their check boxes being selected. Registered Channel Registered Channel...
- Page 113 7. EQ100 Settings (Editing when the parameter change is available) Setting Item Description Channel Name Enter a channel name. If not entered, the created default name is set. Data Type Select a data type. Differential Select Yes or No for differential processing. Processing No: A channel is handled as an instantaneous value.
- Page 114 7. EQ100 Settings ■Editing Channel You can edit a channel name only. 1) Click the [Edit] button of the channel you want to change. 2) In the [Edit Measurement Device] dialog box, click [Edit]. 3) In the [Edit Channel Name] dialog box, change the channel name and click [OK]. ■Deleting Channel 1) In the [Channel Registration] screen, select the [Select] check box.
- Page 115 7. EQ100 Settings ■Channel Batch-Edit You can view a list of multiple channels and edit the channel names together. 1) On the bottom of the screen, click the [Channel Batch-Edit] button. 2) Click the field of the channel you want to edit, and edit the item directly. You can edit a channel name only.
-
Page 116: Operation Channel Setting
7. EQ100 Settings 7.4.5. Operation Channel Setting ■Function In the operation channel setting, you can create a virtual measurement channel through an operation based on actual measurement channels. There are two types of operation channels; a free operation channel and a basic unit operation channel (basic unit channel). - Page 117 7. EQ100 Settings ■Basic Unit Channel Basic unit operation is available. Base Unit Channel A (Numerator) Operation Energy Data Channel A÷B Base Unit Channel (Division) - Channel Name Setting Channel B (Denominator) Any Channel This function can be used if you want to use the following values: e.g.) - Electric energy consumption per production volume Precautions for...
- Page 118 7. EQ100 Settings ■Creating Free Operation Channel 1) In the setting menu, click [Operation Channel Setting]. 2) Click [Add]. 3) In the [Create Operation Channel] dialog box, click the [Free Operation Channel] tab. Item Description Channel Name Enter a name of a new operation channel to create. <Input range>...
- Page 119 7. EQ100 Settings 4) Enter a channel name. 5) Select a data type. 6) Create an expression. To add to the expression, double-click a channel name or click an operation button. Expression Field Select a channel Operation Button Item Description Expression An expression appears.
- Page 120 7. EQ100 Settings ●Setting Example of Operation Channel (Creating Free Operation Channel from EQ100 General-Purpose Input) The number of pulses from the EQ100 input terminal is counted and a pulse input count channel is automatically generated. A free operation channel created based on the count can convert units to engineering units (e.g.
- Page 121 7. EQ100 Settings ■Creating Basic Unit Operation Channel 1) In the setting menu, click [Operation Channel Setting]. 2) Click [Add]. 3) In the [Create Operation Channel] dialog box, click the [Basic Unit Operation Channel] tab and configure the settings. Setting Item Description Channel Name Enter a name of a new basic unit operation channel to create.
-
Page 122: Creating/Editing Data Type
7. EQ100 Settings ■Editing Operation Channel 1) Click the [Edit] button of the expression you want to change. 2) In the [Create Operation Channel] dialog box, edit the details. You cannot edit Destination Group to Add. To edit a group, refer to "7.4.7. Group Registration". - Page 123 7. EQ100 Settings ■Adding Data Type To add a new data type: 1) In the setting menu, click [Data Type Setting]. 2) Click [Add] on the bottom right of the screen. 3) In the [Data Type Setting] dialog box, enter the details. Setting Item Description Data Type...
-
Page 124: Group Registration
7. EQ100 Settings ■Editing Data Type To edit a data type: 1) Click the [Edit] button of the data type you want to change. In the [Data Type Setting] dialog box, change the settings. 2) Click [OK]. 7.4.7. Group Registration ■Function You can register a channel to a channel group. - Page 125 7. EQ100 Settings Shown below are button functions: Button Description Creates a channel group. Moves the selected channel group up by one. Moves the selected channel group down by one. If a channel is being selected, the channel is deleted from the registered group.
- Page 126 7. EQ100 Settings ■Adding Channels To add a channel to a channel group: 1) Select a channel group to add. In this example, click [1st Building 3rd floor]. 2) Add a channel to the channel group. (1) Select a channel to add. You can select: - One channel: By clicking the channel line.
- Page 127 7. EQ100 Settings 2) Select [Delete Group], and click [OK]. 3) The selected group and the channels belonging to the group are deleted. Precautions for Correct Use - You cannot delete a channel group if it is the only channel group. ■Partially Deleting Channels in Channel Group * You can delete channels using the Delete Channel Group screen.
- Page 128 7. EQ100 Settings 2) Select [Delete Group Element] and the check boxes of the channels you want to delete, and click [OK]. 3) The selected channels are deleted. ■Deleting Channel 1) Select channels you want to delete, and click the [x] button. 2) The selected channels are deleted.
-
Page 129: Eq100 Monitoring Setting
7. EQ100 Settings 7.5. EQ100 Monitoring Setting 7.5.1. Overview The monitoring settings include the following functions. Configure the setting if necessary. Monitoring Description Setting Monitoring Alarm Occurs when a measured value exceeds the configured control value. Device Alarm Occurs when a device error is detected. For device alarm, see "12.1.2. -
Page 130: Device Alarm
7. EQ100 Settings 7.5.3. Device Alarm Occurs when a device error is detected. For device alarm, see "12.1.2. Event Log Code List". Email Transmission EQ100 Mail Server Destination Group ■Setup Flow Destination Setting See "7.5.8. Destination Setting". ↓ Notification Setting See "7.5.6. -
Page 131: Control Value Setting
7. EQ100 Settings 7.5.5. Control Value Setting ■Function Specify the upper and lower threshold values for each channel collected by EQ100. In addition, specify the number of times over the threshold values to evaluate an occurrence of monitoring alarm. If a measured data exceeds the setting, an email is sent ("7.5.8. Destination Setting") or output is made to a general-purpose output ("7.5.9. -
Page 132: Notification Setting
7. EQ100 Settings ■Deleting Control Value Select the [Select] check box of the channel you want to delete, and click [Delete]. The control value setting is deleted. Reference - You can configure in on the Web UI screen as well. For details, see "9.4. Monitoring Screen". 7.5.6. -
Page 133: Periodic Report Setting
7. EQ100 Settings 7.5.7. Periodic Report Setting ■Function An email notifies EQ100 operations. Registered details are sent as an email to a destination group periodically. Before configuring periodic report setting, you must configure the destination group setting (see "7.5.8. Destination Setting"). Precautions for Correct Use - If the transmission condition of periodic report is out of the transmission schedule in the... -
Page 134: Destination Setting
7. EQ100 Settings 7.5.8. Destination Setting ■Function Specify a destination group and email address of [Notification Setting] and [Periodic Report Setting]. Up to four groups and up to 10 emails per group can be configured. Specify a transmission schedule and email address as a set. The transmission schedule must be specified in a day of the week and a time slot. - Page 135 7. EQ100 Settings 4) In the [Edit Destination Name] dialog box, specify a destination name. 5) Click [OK]. ■Adding Transmission Schedule and Email Address 1) Select a destination (1 to 4) tab, and click the [Add] button. 2) In the [Transmission Schedule] dialog box, enter the details. 7-46...
- Page 136 7. EQ100 Settings Setting Item Description Day of the Week Specify a day of the week to send. Select a check box for the day. Designation Transmission Time Select a time slot to send. Slot Available start time of the time slot is from 0 to 23 o'clock, end time from 1 to 24 o'clock.
-
Page 137: Output Terminal Setting
7. EQ100 Settings ■Deleting Transmission Schedule and Email Address 1) Select a destination (1 to 4) tab. 2) Select a transmission schedule to delete, and click [Delete]. 3) The selected transmission schedule and email address are deleted. 7.5.9. Output Terminal Setting Configure operations of four output terminals specified in the control value setting. - Page 138 7. EQ100 Settings 3) In the [Operation Setting] dialog box, select an operation setting. Item Description No output No output is done. On upon Event/Off upon Return On if an output is specified in the control value setting, Off if returned.
-
Page 139: Email Transmission Setting
7. EQ100 Settings 7.5.10. Email Transmission Setting ■Function Specify an email account of EQ100 (sender) to send in the notification setting and periodic report setting. ■Setup Steps 1) In the setting menu, select [Network Setting] and click the [Email Transmission] tab. 2) In the following screen, configure the following items. -
Page 140: Checking Email Transmission
7. EQ100 Settings Setting Item Description Email Address Set an EQ100 email address. Select an encoding character string as well. Encoding Character String <Input Range> Half-width63 characters SMTP Setting Enter SMTP settings. - SMTP Server Address <Input Range> Half-width 126 characters - SMTP Port Number <Initial Value>... -
Page 141: Eq100 Settings
7. EQ100 Settings 7.6. EQ100 Settings 7.6.1. Overview Configure the EQ100 settings. 7.6.2. Language/Time Zone Setting ■Function Specify a language type, date locale, and time zone. ■Setup Steps 1) In the setting menu, click [System Setting]. 2) Clicking the [Set] button in [Language/Time Zone Setting] displays the [Language/Time Zone Setting] dialog box. -
Page 142: Eq100 Time Synchronization
7. EQ100 Settings 7.6.3. EQ100 Time Synchronization ■Function Set a reference to adjust the time of EQ100. ■Setup Steps 1) In the setting menu, click [System Setting]. 2) Clicking the [Set] button in [Time Synchronization Setting] displays the [Time Synchronization Setting] dialog box. Setting Item Description Method... -
Page 143: Configuring Eq100 Lan Connection Port/Sub-Lan Connection Port
7. EQ100 Settings Setting Item Description Server Port Number Enter the server port number if time synchronization is performed by the SNTP server or EQ server. For EQ server, use the initial value "4211". For SNTP server, set the port number to "123". Initial value: 4211 3) Specify items required, and click [OK]. - Page 144 7. EQ100 Settings 3) In the screen shown below, configure the LAN connection port to use. Clicking the [Network Setting (LAN)] or [Network Setting (sub-LAN)] button displays the respective dialog box, in which configure the settings. Setting Item Description EQ100 Network Setting Set the LAN connection port of EQ100.
-
Page 145: Configuring Rs-485 Communications Port
7. EQ100 Settings 7.6.5. Configuring RS-485 Communications Port ■Function To connect an RS-485-connected measurement device, configure an RS-485 communications port. RS-485 Communication Port Separately specify the communications conditions for four serial communications ports (RS-485_1, RS-485_2, RS-485_3, and RS-485_4). Shown below are factory shipment settings of the communications ports: Item Factory Shipment Settings Communication Speed (bps) 9600... - Page 146 7. EQ100 Settings 3) In the [RS-485 Communications Port Setting] dialog box, select setup items and click [OK]. Setting Item Description Item Communication Speed (bps) Select a communication speed. 9600/19200/38400 Data Length Select a data length. 7 bits/ 8bits Parity Select parity.
-
Page 147: Changing Password For Access From Web Ui Function
7. EQ100 Settings 7.6.6. Changing Password for Access from Web UI Function ■Function Specify a password for access to the Web UI screen of EQ100. There are following two types of settings: Setting Item Description Normal Screen Password Access to EQ100 is protected by a password. Setting Maintenance Screen Setup change on the maintenance screen (system/operation... - Page 148 7. EQ100 Settings ●Maintenance Screen Password Setting 1) Clicking the [Set] button in [Maintenance Screen Password Setting] displays the [Maintenance Screen Password Setting] dialog box. Setting Item Description Maintenance Screen Password Old Password: Enter the old password. New Password: Enter a new password. Verify: Enter a new password again.
-
Page 149: Output Setting Of Collected Data/Event Log File
7. EQ100 Settings 7.7. Output Setting of Collected Data/Event Log File 7.7.1. Overview You can take out collected data files and event log files from EQ100. Depending on the EQ-Manager setting types, available files differ as shown below: Yes: Available, N/A: Not available EQ-Manager setting File Name SD Card Output... - Page 150 7. EQ100 Settings ●User-Specified File Designation Screen Setting Item Description Item File Output Specify whether a user-specified file Yes/No should be created or not. Output Cycle Specify a cycle to create the files. Select from 10 or 30 minutes or 1, 6, 12, or 24 hours.
-
Page 151: Sd Card Output Setting
7. EQ100 Settings 7.7.3. SD Card Output Setting ■Function Configure so as to output collected data of EQ100 to an SD card in a CSV file. Output is done once a day at a specified hour to an SD card. The SD card can be used for commercial software such as Excel or EQ-Viewer to view data. -
Page 152: Ftp Server Setting
7. EQ100 Settings 7.7.4. FTP Server Setting ■Function When the FTP server setting is configured, EQ100 can be operated as an FTP server. You can fetch collected data files in the EQ100 internal memory or an SD card attached to EQ100 using an FTP client. - Page 153 7. EQ100 Settings 3) In the [FTP Server Setting] dialog box, select the [Enable FTP Server] check box and configure [Account] and [Password]. Setting Item Description Enable FTP Server Specify whether the FTP server should be enabled or not. Account Specify an account to connect to the FTP server.
-
Page 154: Ftp Transfer Of Collected Data
7. EQ100 Settings 7.7.5. FTP Transfer of Collected Data ■Function When the FTP client setting is configured, EQ100 can be operated as an FTP client. Collected data in EQ100 is transferred to the FTP server at the timing of its creation. FTP Server EQ100 Auto-transfer... - Page 155 7. EQ100 Settings 3) In the screen shown below, select the [FTP Transfer Availability] check box and configure other items. Setting Item Description FTP Transfer Specify whether FTP transfer is required or not. Selecting this check Availability box enable the FTP client function. Transfer Target As a target of FTP transfer, select from internal system file or user-specified file.
-
Page 156: Saving Eq Project
7. EQ100 Settings 7.8. Saving EQ Project After creating an EQ project, save the EQ project on a computer as a file. 1) On the toolbar, click [File] - [Save]. 2) In the [Save As] dialog box, enter a file name and click [Save]. The [File Name] field shows the EQ project name. -
Page 157: Writing Eq Project File To Eq100
7. EQ100 Settings 7.9. Writing EQ Project File to EQ100 7.9.1. Overview Write an EQ project to EQ100. To write an EQ project to EQ100, use either of the following three operations: ■Writing through SD Card If you try to write an EQ project for the first time, this method is recommend. EQ-Manager EQ100 Write... -
Page 158: Writing Eq Project File Through Sd Card
7. EQ100 Settings 7.9.2. Writing EQ Project File through SD Card ■Steps 1) Attach an SD card to a computer. 2) Create a folder "EQ_project" right under the SD card (root directory). The folder name is case-sensitive. Project File (.eqpj) SD Card 3) Use EQ-Manager or Windows Explorer to save a project file (with extension of .eqpj) under the "EQ_project"... - Page 159 7. EQ100 Settings 6) Configure the setup DIP switch SW7 as ON. SW7=ON 7) If the power of EQ100 is ON, press the reset button for 1 second. Right after then, the operation status indicator flashes for about 30 seconds (or the power is turned off and on again).
-
Page 160: Writing Eq Project By Eq-Manager
7. EQ100 Settings 7.9.3. Writing EQ Project by EQ-Manager The default (factory shipment) IP address of EQ100 is 192.168.200.200. Temporarily changing an IP address of the computer with EQ-Manager installed so as to connect to EQ100 via LAN allows writing an EQ project to EQ100 via LAN. EQ-Manager EQ100 LAN Connection Port... - Page 161 7. EQ100 Settings 5) On the toolbar, click [Logger] - [Online]. 6) In the [Online Host Device] dialog box, check the displayed IP address and click [OK]. If the IP address is different from the one shown below, edit it. EQ100 IP Address upon Factory Shipment: 192.168.200.200 7) When online connection is done, the status bar indicates [Online].
- Page 162 7. EQ100 Settings 10) If the EQ project name written in EQ100 differs from the EQ project name to write, the following confirmation dialog box appears. If you are sure to write, click [OK]. 11) When the EQ project is written in EQ100, the following dialog box appears. The detail of the dialog box depends on the settings.
-
Page 163: Writing Eq Project By Web Ui Function
7. EQ100 Settings 7.9.4. Writing EQ Project by Web UI Function The default (factory shipment) IP address of EQ100 is 192.168.200.200. By allowing connection of a computer to EQ100, an EQ project can be written to EQ100 using the Web UI function. Web UI Screen EQ100 LAN or Sub-LAN Connection Port... - Page 164 7. EQ100 Settings 5) On the Web UI screen, select [Maintenance] - [Update]. 6) Click the [Browse] button of [Read EQ Project]. The EQ project selection screen appears. 7) Select an EQ project file to write to EQ100. 8) Click the [Update] button of [Read EQ Project]. 9) The EQ project is written to EQ100.
-
Page 165: Communication Test And Collecting Start
8. Communication Test and Collecting Start Communication Test and Collecting Start After configuring EQ100 settings and before starting data collecting, perform the communication test with measurement devices. This communication test does not log measured data to the EQ100 internal memory. When no problem is found in the communication test, transition the status of EQ100 from setup to collecting and start the measured data collecting and logging to internal memory. -
Page 166: Communication Test Operation By Eq-Manager
8. Communication Test and Collecting Start 8.2. Communication Test Operation by EQ-Manager Shown below are steps of communication test by EQ-Manager. 8.2.1. Starting Communication Test ■Steps 1) Use EQ-Manager to open an EQ project, and on the toolbar click [Logger] - [Online]. 2) In the [Online Host Device] dialog box, check the destination EQ100 IP address and click [OK]. -
Page 167: Ending Communication Test
8. Communication Test and Collecting Start 5) To verify the communication test result, select [Operation Monitor] in the setting menu to view. Please wait for a while before a collecting cycle of a measurement device passes. The communication test result appears in the [Status] field. Make sure that it should be [Logging]. -
Page 168: Communication Test Operation By Web Ui Screen
8. Communication Test and Collecting Start 8.3. Communication Test Operation by Web UI screen Select [Maintenance] - [System]. From the [EQ100 Operation] items on the screen, click the [Communication Test] button. The communication test result can be viewed by selecting [Simple Graph View] - [Current Value Monitor]. -
Page 169: Start Collecting
8. Communication Test and Collecting Start 8.4. Start Collecting When no problem is found in the communication test, transition the status of EQ100 from setup to collecting and start the measured data collecting. There are following three ways to transition the status setup to collecting: - Pressing RUN/STOP button on the EQ100 front end - Operation by EQ-Manager - Operation on Web UI screen... -
Page 170: Starting Collecting By Eq-Manager Operation
8. Communication Test and Collecting Start 8.4.2. Starting Collecting by EQ-Manager Operation To start collecting using EQ-Manager, open an EQ project and on the toolbar click [Logger] - [Start Logging] using EQ-Manager. On EQ-Manager, you can check the EQ100 collecting status. 8.4.3. -
Page 171: Checking Collected Data
8. Communication Test and Collecting Start 8.5. Checking Collected Data 8.5.1. Data in EQ100 after Collecting After measured data are collected, collected data files and event log files are saved in the EQ100 internal memory. See below for details: ■Collected Data File A collected data file is automatically generated once an hour. -
Page 172: Internal Folder Structure Of Eq100
8. Communication Test and Collecting Start 8.5.2. Internal Folder Structure of EQ100 Shown below is the folder structure for downloading by [File Download] operation on the Web UI screen or operations by an FTP client. 1st Level 2nd Level 3rd Level 4th Level 5th Level "sd"... - Page 173 8. Communication Test and Collecting Start ■[Reference] EQ100 Internal Folder seeing from FTP ●EQ100 Internal Memory (measurement) ●SD Card (sd) ●User-Specified File Folder (report)
-
Page 174: Web Ui Function
9. Web UI Function Web UI Function 9.1. Overview of Web UI Function The Web UI is a function to view data incorporated into EQ100, with EQ100 and a computer connected via LAN. Major functions include: - Status Check - Simple Graph View - Maintenance Function ■Configuration of Web UI Function Item... -
Page 175: Operating Environment
9. Web UI Function ■Icon Clicking icons on the screen top switches the screen views. Reference - Placing the cursor over the [Simple Graph View] and [Maintenance] icon displays a lower-level screen menu. 9.1.1. Operating Environment See below for operating environment for the Web UI function: Target OS(*) Windows Vista/7/8 Target Browser... - Page 176 9. Web UI Function Precautions for Correct Use - Disable the proxy server setting in the LAN configuration of the Web browser. If a connection is enabled via a proxy server, the connection to the Web UI may not be available.
-
Page 177: Connecting From Web Browser
9. Web UI Function 9.2. Connecting from Web Browser Shown below are steps to connect to EQ100 using a Web browser: ■Steps 1) Configure the LAN settings of the computer Configure the computer's IP address so as not to overlap the ones of EQ100 and LAN-connected measurement devices. - Page 178 9. Web UI Function 4) Open the Web UI screen Start up the Web browser of the computer and enter the EQ100 IP address in the URL field. The Windows security dialog box prompting a user name and password appears. Shown below are IP address examples of EQ100 with factory shipment settings.
- Page 179 9. Web UI Function Reference - The password "admin" for the user name "admin" is an online connection password of EQ100 upon factory shipment or after initialization. - If the login password for the Web UI has been changed, use EQ-Manager to select [Advanced Setting] - [System Setting], and change the password in the [Normal Screen Password Setting].
-
Page 180: Top Screen
9. Web UI Function 9.3. Top Screen When the Web UI screen is opened by a Web browser, the following top page appears. On the top page, you can view the descriptions of icons used for the Web UI screen. Clicking an icon on the screen switches the screen. -
Page 181: Monitoring Screen
9. Web UI Function 9.4. Monitoring Screen Clicking the [Monitor] icon on the screen top displays the following screen. In this screen the monitoring setup details appear. ■Monitoring Screen (List View Screen) Configuration Monitoring Setting Display Area Edit Button Update Button ■Description of Display Areas Item Description... - Page 182 9. Web UI Function Clicking the [Edit] button on the left of a monitoring condition displays the following threshold setting screen. In this area you can edit the threshold value while viewing a graph of monitoring operations for review of the threshold setting. ■Monitoring Screen (Threshold Setting Screen) Configuration View Button Display Period...
-
Page 183: Simple Graph View > Current Value Monitor
9. Web UI Function 9.5. Simple Graph View > Current Value Monitor When you select [Current Value Monitor] from the menu displayed when the cursor is over the [Simple Graph View] icon on the screen top, the current value monitor screen appears. The current value monitoring screen displays the latest measured data of each measurement device. - Page 184 9. Web UI Function ■Update Interval of Current Value Monitor Screen The current value monitor screen is automatically updated after transitioned. Shown below are display update intervals: Operation Status Display Update Interval Communication Test 10 seconds Collecting Status 60 seconds ■Display Target of Current Value Monitor Screen The latest values displayed on the current value monitoring screen are measured values acquired from measurement devices.
- Page 185 9. Web UI Function Reference - A measurement channel specified as "energy data" in the data type setting of EQ-Manager is automatically displayed in a bar graph. A measurement channel not specified as "energy data" is automatically displayed in a line graph. 9-12...
-
Page 186: Simple Graph View > Graph View
9. Web UI Function 9.6. Simple Graph View > Graph View When you select [Graph View] from the menu displayed when the cursor is over the [Simple Graph View] icon on the screen top, the graph view screen appears. In the graph view screen, you can select a channel from a specified channel group to view in a bar graph (energy data) and a line graph (other than energy data). - Page 187 9. Web UI Function Item Description Display Period Select a view period for the horizontal direction (horizontal time Selection Area span). [Hourly]: The range of horizontal time period for the entire graph is one hour [Daily]: The range of horizontal time period for the entire graph is one day [Monthly]: The range of horizontal time period for the entire graph is one month...
-
Page 188: Simple Graph View > Basic Unit View
9. Web UI Function 9.7. Simple Graph View > Basic Unit View When you select [Basic Unit View] from the menu displayed when the cursor is over the [Simple Graph View] icon on the screen top, the basic unit view screen appears. In the basic unit view screen, you can view a graph including a basic unit of the selected channel group. - Page 189 9. Web UI Function ■Display Update Interval of Basic Unit View Screen The graph display in the basic unit view screen is updated upon clicking the display button. ■Display Target of Basic Unit View Screen A graph in the basic unit view screen shows only the values of the channels registered as a basic unit channel.
-
Page 190: Maintenance > Setting View
9. Web UI Function 9.8. Maintenance > Setting View When you select [Setting View] from the menu displayed when the cursor is over the [Maintenance] icon on the screen top, the setting view screen appears. In the setting view screen, you can check the following EQ100 settings. - EQ Project - Occurred Error - EQ100 Information... - Page 191 9. Web UI Function ■Time Synchronization Setting The following time synchronization settings configured by EQ-Manager are displayed. View Details: Synchronization Type, Time Slot, Server Address, Server Port Number ■Network Setting The network settings of EQ100 LAN and sub-LAN ports configured by EQ-Manager are displayed (Default Gateway and DNS are displayed for LAN only).
- Page 192 9. Web UI Function ■FTP Transfer Setting The settings for transmission from EQ100 as an FTP client to an external FTP server, configured by EQ-Manager, are displayed. View Details: FTP transfer enabling flag, FTP Server Address, FTP Server Port Number, FTP User Name, FTP Destination Path, file type ■FTP Server Setting The settings to use EQ100 as an FTP server configured by EQ-Manager are displayed.
-
Page 193: Maintenance > System
9. Web UI Function 9.9. Maintenance > System When you select [System] from the menu displayed when the cursor is over the [Maintenance] icon on the screen top, the system screen appears. On the system screen, you can check and configure an EQ100 operation status, time setting, SD card data output, and event logs. -
Page 194: Maintenance > Operation Check
Correct Use - Be careful when you perform an output test while a general-purpose output port and an external device being connected. OMRON shall not be responsible for any impact on a connected device due to customer's operation. - A status of general-purpose output port is kept as that operated in the operation check. After the operation check, you may need to change the status back. -
Page 195: Maintenance > Data Acquisition
9. Web UI Function 9.11. Maintenance > Data Acquisition When you select [Data Acquisition] from the menu displayed when the cursor is over the [Maintenance] icon on the screen top, the data acquisition screen appears. In this menu, you can acquire collected data of a specified period via network and save as a CSV file. -
Page 196: Maintenance > File Download
9. Web UI Function 9.12. Maintenance > File Download When you select [File Download] from the menu displayed when the cursor is over the [Maintenance] icon on the screen top, the file download screen appears. In the file download screen, you can download collected data files of EQ100 internal memory. Precautions for Correct Use - EQ100 saves collected data in the internal nonvolatile memory for up to one week. - Page 197 9. Web UI Function 3) In the [Save As] dialog box, enter a destination to save and click [Save]. Download is completed. 9-24...
-
Page 198: Maintenance > Update
9. Web UI Function 9.13. Maintenance > Update When you select [Update] from the menu displayed when the cursor is over the [Maintenance] icon on the screen top, the update screen appears. On the update screen, you can update an EQ project and the firmware. ■Update Screen Configuration You can perform the following operations: - Loading an EQ project... -
Page 199: Help Screen
9. Web UI Function 9.14. Help Screen Clicking the [Help] icon on the screen top displays the Help screen. The Help screen shows a link to OMRON's Web page. ■Help Screen Configuration Link to OMRON’s Web page 9-26... -
Page 200: Viewing/Analyzing Graph On Eq-Graphviewer
10. Viewing/Analyzing Graph on EQ-GraphViewer Viewing/Analyzing Graph on EQ-GraphViewer EQ-GraphViewer is software to summarize collected data from measurement devices stored in the summary data DB of the EQ server for viewing and analyzing the graph. To view in the EQ-GraphViewer, it is necessary to create an EQ Server Project and make settings to the EQ server. -
Page 201: Connecting To Eq Server
10. Viewing/Analyzing Graph on EQ-GraphViewer 10.2. Connecting to EQ Server Shown below are steps to connect to the EQ Server. ■Steps 1) On the toolbar, click [File] - [Connect Server]. 2) In the [Connect Server] dialog box, enter the IP address of the destination to connect and click [Connect]. -
Page 202: Selecting A Channel Group To Display
10. Viewing/Analyzing Graph on EQ-GraphViewer 10.3. Selecting a Channel Group to Display Click and select a channel group for a graph display from the channel tree area on the left of the main screen. Channel groups are displayed as folder icons. ■Showing/Hiding Channel Tree Area If the channel tree area is not displayed, on the toolbar click [Disp.] and select the [Disp. - Page 203 10. Viewing/Analyzing Graph on EQ-GraphViewer ■Hiding a Channel Name You can hide channel names belonging to a channel group. 1) On the toolbar, click [Setting]. 2) In the [Setting] dialog box, clear the [Channel] dialog box of [Tree Area] in [Display Setting] field.
-
Page 204: Configuring Graph View
10. Viewing/Analyzing Graph on EQ-GraphViewer 10.4. Configuring Graph View To configure graph view settings, use the main screen. Item Description Graph Type Setting Specify a type of a graph to draw in the graph area. Area Disp. Period Setting Specify a period of a graph to draw in the graph area. Area Summary Interval Specify a unit of summary of a graph to draw in the graph area. - Page 205 10. Viewing/Analyzing Graph on EQ-GraphViewer Use the following steps to configure a graph view. 1) Select a data type Specify a data type to view in a graph in [V-Axis 1] and [V-Axis 2] in the data type setting area. A unit of data type specified in [V-Axis 1] is displayed on the left of the graph.
- Page 206 10. Viewing/Analyzing Graph on EQ-GraphViewer 3) Select a view period You can switch between the periods for the horizontal axis (temporal axis) of a graph in the view period setting area. Select from six types of view periods, minute/hour/day/month/year/10 years. Selecting an item refreshes the graph.
- Page 207 10. Viewing/Analyzing Graph on EQ-GraphViewer 6) Select a type of bar graph Select a type of bar graph from four types in the graph type area, Sum/Stack/Parallel/Classified. Shown below is overview of graph types: Graph Type Description Sum graph A graph of total value of the selected channels is displayed. Stack graph A stacked bar graph of the selected channels with different colors is displayed.
- Page 208 10. Viewing/Analyzing Graph on EQ-GraphViewer 9) Switching graph view (Bar/Line) Selecting the preferred option switches the graph view between bar and line. To view either in bar or line depends on the initial value of each data. The initial value can be changed in the EQ-Manager.
-
Page 209: Other Operations
10. Viewing/Analyzing Graph on EQ-GraphViewer 10.5. Other Operations If necessary, perform the following operations. 10.5.1. Displaying Past Data Comparison Screen You can compare data being displayed (source) and data of other date/time (target). For detailed steps, see "EQ-Viewer User's Manual". 10.5.2. -
Page 210: Safe Mode
11. Safe Mode Safe Mode The safe mode is for maintenance to recover an EQ100 failure. Under the safe mode, the following operations are available: - Checking EQ100 information - Checking LAN/sub-LAN connection port settings - Clearing setting/stored data - Updating the firmware - Clearing logs - Recovering to the factory shipment status 11.1. - Page 211 11. Safe Mode 4) Start up a Web browser, enter the following URL, and press Enter. http://192.168.200.200/ The Web UI screen of the safe mode appears. You do not need to log in (enter ID and password). The password "admin" is an online connection password of EQ100 upon factory shipment or after initialization.
-
Page 212: Safe Mode Web Ui Screen
11. Safe Mode 11.2. Safe Mode Web UI Screen The Web UI screen of the safe mode differs from that of the normal mode in configuration. The safe mode shows the following items. Main Body Information LAN Setting Initial Setting Firmware Update Log Clear Factory Shipment... - Page 213 11. Safe Mode Shown below is information to be initialized by initialization operations under the safe mode: Yes: Initialized, No: Not initialized Setting/Stored Factory Firmware Information Log Clear Shipment Update Clear Status Operation Settings (EQ Project File) Collected Data File (CSV File) Event Log File (CSV File)
-
Page 214: Setting/Stored Information Clear
11. Safe Mode 11.3. Setting/Stored Information Clear Clears information stored in EQ100 programs (failure occurrence information, unsent emails, unsent FTP information). This does not clear collected data and event logs already outputted to internal memory or an SD card. See below for operation steps: 1) Click [Clear] in the initial setting. -
Page 215: Updating The Firmware
11.4. Updating the Firmware Updates the firmware of the EQ100 to the latest one. For the latest firmware information, visit OMRON's Web site. http://www.fa.omron.co.jp You can view the current firmware version being used on the top page of the Web UI screen under the safe mode. - Page 216 11. Safe Mode 4) On the message prompting process confirmation, click [OK]. The firmware update begins. During firmware update, the progress bar (progress status) appears on the browser's task bar. 5) When the update is completed, a message prompting restart appears. Click [OK]. 6) Configure the DIP switch SW10 on the EQ100 front end as OFF 7) Use a fine-tipped screwdriver or other tools to press and hold the reset button on the EQ100 front end for 1 second or longer.
-
Page 217: Log Clear
11. Safe Mode 11.5. Log Clear Clears event logs in EQ100. The event log files that have been already output as a file are not deleted. See below for operation steps: 1) Click [Clear]. 2) On the message prompting process confirmation, click [OK]. 3) When the event logs are cleared, a message indicating completion of the process appears. -
Page 218: Recovering To Factory Shipment Status
11. Safe Mode 11.6. Recovering to Factory Shipment Status Resets all data of EQ100 (including the firmware) to the factory shipment status. See below for operation steps: 1) Click [Initialization] in the factory shipment status. 2) On the message prompting process confirmation, click [OK]. 3) When the EQ100 is reset to the factory shipment status, a message prompting restart appears. -
Page 219: Exiting Safe Mode
11. Safe Mode 11.7. Exiting Safe Mode To exit the safe mode and return to the normal mode, use the following steps to start up and connect. 1) Configure the DIP switch SW10 on the EQ100 front end as OFF. 2) Use a very fine screwdriver or other tools to press and hold the reset button on the EQ100 front end for 1 second or longer. -
Page 220: Appendix
12. Appendix Appendix 12.1. Troubleshooting Item Action Refer to Cannot access the Check the LAN cable connection. “5.5.4. LAN login screen Connection Port” Check that the computer's LAN settings (IP “9.2. Connecting from address, subnet mask, DNS, default gateway) Web Browser” should match the connected LAN environment. - Page 221 12. Appendix Item Action Refer to A graph view on Integrated data value may get large if collecting the Web UI screen has been stopped for a long period of time due to shows a large power off or setup change. value.
- Page 222 12. Appendix Item Action Refer to Check that the connection to the SNTP server's “7.6.3. EQ100 Time ” communications port should be permitted. Time Check the LAN cable connection. “5.5.4. LAN synchronization by Connection Port” the EQ server Check that the SNTP server name, LAN settings “7.6.4.
- Page 223 12. Appendix Item Action Refer to Check that the terminal resistor should be “7.6.5. Configuring properly connected. RS-485 Communications Port" Abnormal battery Check that the battery should be properly “5.2. Battery” voltage connected. Replace the battery if it has been used for years “5.2.
-
Page 224: Overview Of Error Status Types And Actions
Setup/status EQ100 cannot Abnormal setup Flashing Please contact failure start or continue data, internal OMRON. (transition to the collecting parameter error, status. clock failure setup status) The status transitions to the setup status. Instrument... -
Page 225: Event Log Code List
12. Appendix 12.1.2. Event Log Code List Clearing of Failure Device Error Operation EQ100 Status Alarm Event Status Status Action Code Operation upon Status Types Indication Setting Indicator Change Instrument Restart by Failure runaway forced reset by detected hardware Startup in safety Abnormal mode program data... - Page 226 12. Appendix Clearing of Failure Device Error Operation EQ100 Status Alarm Event Status Status Action Code Operation upon Status Types Indication Setting Indicator Change Battery cover and continued while Voltage replace the waiting for Occurred battery within recovery 5 minutes (occurred status is kept even after the setting...
- Page 227 12. Appendix Clearing of Failure Device Error Operation EQ100 Status Alarm Event Status Status Action Code Operation upon Status Types Indication Setting Indicator Change Sub-LAN Process continued Connection Error Recovered Email Check the Process is Temporar Transmission notification continued while y Flashing Error settings...
- Page 228 12. Appendix Clearing of Failure Device Error Operation EQ100 Status Alarm Event Status Status Action Code Operation upon Status Types Indication Setting Indicator Change Settings Power Cut Process before Detected power cut Under (saving time and Monitoring previous integrated value, etc) Power Cut Collecting is...
- Page 229 12. Appendix Clearing of Failure Device Error Operation EQ100 Status Alarm Event Status Status Action Code Operation upon Status Types Indication Setting Indicator Change ns and resume collecting. Process Measured continued Data Missing Recovered Check the FTP Flashing Yes Data Transfer Process is transmission Error...
- Page 230 12. Appendix Clearing of Failure Device Error Operation EQ100 Status Alarm Event Status Status Action Code Operation upon Status Types Indication Setting Indicator Change (Data overwritten and Transfer) new data are saved Collecting Solve the SD Flashing Yes Process is Failure card error continued while...
-
Page 231: Subjective Operation Guide
12. Appendix 12.2. Subjective Operation Guide 12.2.1. Setting for EQ100 How do I Operation Refer to Create a new setup On EQ-Manager, select [File] menu - This manual: "7.2. data project? [Create] - [EQ Project] Creating New EQ Project" EQ-Viewer User's Manual: "4.6 Creating EQ100 Project"... -
Page 232: Taking Out Eq100 Collected Data
12. Appendix How do I Operation Refer to Configure an IP On EQ-Manager, select [EQ Project] - This manual: "7.6.4. address of EQ100 [Network Setting] - [EQ100 Network Configuring EQ100 LAN sub-LAN connection Setting](Sub-LAN) and configure an IP Connection Port/Sub-LAN port? address Connection Port"... -
Page 233: Eq100 Operation
12. Appendix 12.2.3. EQ100 Operation How do I Operation Refer to Start Use the Web UI to start communication test This manual: "8.3. communication or use EQ-Manager to switch to Communication Test test? communication test (select [Logger] menu - Operation by Web UI [Start Test]) screen", "8.2. -
Page 234: Taking Out Eq100 Collected Data
12. Appendix 12.2.4. Taking Out EQ100 Collected Data How do I Operation Refer to Using Web UI View current values Connect a computer to the LAN or This manual: function or simple graph of sub-LAN connection port of EQ100 “9.2. Connecting data collected from from Web (2) In the URL field, enter the IP... - Page 235 12. Appendix How do I Operation Refer to to EQ100? Send collected data On EQ-Manager, select [Advanced This manual: files (hourly) in the Setting] - [Network Setting] - [FTP “7.7.5. FTP EQ100 internal Transfer Setting] Transfer of memory to an FTP Collected Data”...
-
Page 236: Faq (Frequently Asked Questions)
For a configuration that does not use an server? EQ server, such as a standalone configuration, you can choose an SNTP server. Is an SMTP server for email The SMTP server must be provided by transmission setting OMRON's the customer. SMTP server? 12-17... - Page 237 12. Appendix Item Question Answer How many channels can be Maximum number of channels is 500. registered if RS-485- and example, after registering LAN-connected measurement channels for RS-485-connected devices, devices exist? you can register up to 340 channels for other connection devices. File Output Can collected data files for one day Yes.
-
Page 238: Adding/Deleting Measurement Device
12. Appendix 12.4. Adding/Deleting Measurement Device This section describes an EQ project and Web UI screen graph view for adding/deleting a measurement device. As an example, assume data collecting with an EQ100 connected to measurement devices (1), (2), and (3) (an SD card is attached to the SD card slot and the SD card output function is enabled). -
Page 239: Failure And Replacement Of Measurement Device
Otherwise integrated data cannot be properly acquired right after starting the collecting. 12.4.2. Support for New Measurement Device To use a measurement device for EQ100, use the latest EQ-Manager. For the latest EQ-Manager and support for measurement devices, see OMRON's site: http://www.fa.omron.co.jp/ 12-20... -
Page 240: Impact Of Time Synchronization On Collected Data
12. Appendix 12.5. Impact of Time Synchronization on Collected Data Changing EQ100 time may affect collected data in the EQ100. ■Changing the time from current to past Current Time Past Data (1) Past Data (2) New Data (1) New Data (2) New Data (3) ▲Measured ▲Measured... -
Page 241: Web Ui Screen On Internet Explorer 8 (Ie8)
12. Appendix 12.6. Web UI Screen on Internet Explorer 8 (IE8) If the Web UI screen is viewed on Internet Explorer 8, it may be displayed as shown below. This is caused by compatibility view mode of Internet Explorer 8 setting. ■Solution 1) Press F12 key, select [System] - [Development Tools]. -
Page 242: Communications Protocol
12. Appendix 12.7. Communications Protocol Shown below are communications protocols used for EQ100: Protocol Name Interface Port Upper Level Lower Level Number Communications Communications CompoWay/F RS-485 EPC Communication 2323 Protocol WZ Communication 16000 Protocol FINS 9600 EQUO-LINK 4211 HTTP SNTP SMTP POP3 12-23... -
Page 243: Sd Card Folder Configuration
12. Appendix 12.8. SD Card Folder Configuration Shown below is SD card folder configuration used for EQ100: Folder Details Description ¥EQ_[serial number] Folder for each EQ100 This folder is created for each EQ100. To share an SD card among multiple EQ100s, a serial number is included. -
Page 244: Output File Format
File format: CSV, UTF-8 (No BOM) code, LF linefeed Component: Header block + Data block Header Block #OMRON,EQUO,file format version<LF> #SNC ID, model ID, sensor ID, model, <version>, <operation mode>, <measurement mode>, channels<LF> #CH0, measurement type, UPPER, <upper limit>, LOWER,<lower limit>, SCALE, <scaling value>, SUMMARY_TYPE,<summary type><LF>... - Page 245 For other output specifications, contact OMRON. Item Details 1st line This line is always outputted. #OMRON,EQUO,1.5 fixed 2nd line This line is always outputted. SNC_ID is a unique ID for each EQ100. Channels indicate the number of channels to output...
-
Page 246: Use-Specified File (Data Acquisition With Web Ui, User-Specified File)
12. Appendix 12.9.2. Use-specified file (data acquisition with Web UI, user-specified file) File name: "SNC_ID"_YYYYMMDDhhmmss_YYYYMMDDhhmmss_“X”.csv SNC_ID: Unit identifier for EQ100 _”X”: Number of file output times for file output at the specified time from EQ100. Starts from 1, and increments when the output time is duplicated such as when the start time returns. Omitted for the data acquisition by Web UI. - Page 247 12. Appendix Described below are item details: ■Header Block Item Details <date/time column> Either of the followings is outputted. (1) Output in three columns DATE,TIME,MESC (2) Output in two columns DATE,TIME (3) Output in one column DATETIME <channel information{n}> Channel information consists of the following parameters: <channel name>...
-
Page 248: Event Log File
12. Appendix 12.9.3. Event Log File EQ100 saves error detection, monitoring function, and operation status changes with the occurred hour as event log files for its device management function. The event log files can be externally outputted by using EQ-Manager or Web UI operation. They can be viewed on the Web screen. -
Page 249: Software License
12. Appendix 12.10. Software License This product uses the following open source software. Although the software are not guaranteed based on the copyright by nature of open source, this product is guaranteed by the warranty certificate and conditions described in "Introduction" section of this manual. - Page 250 12. Appendix PHP License -------------------------------------------------------------------- The PHP License, Version 3.0 Copyright (c) 1999 - 2003 The PHP Group. All rights reserved. -------------------------------------------------------------------- Redistribution and use in source and binary forms, with or without modification, is permitted provided that the following conditions are met: 1.
- Page 251 12. Appendix PARTICULAR PURPOSE ARE DISCLAIMED. IN NO EVENT SHALL THE PHP DEVELOPMENT TEAM OR ITS CONTRIBUTORS BE LIABLE FOR ANY DIRECT, INDIRECT, INCIDENTAL, SPECIAL, EXEMPLARY, OR CONSEQUENTIAL DAMAGES (INCLUDING, BUT NOT LIMITED TO, PROCUREMENT OF SUBSTITUTE GOODS OR SERVICES; LOSS OF USE, DATA, OR PROFITS; OR BUSINESS INTERRUPTION) HOWEVER CAUSED AND ON ANY THEORY OF LIABILITY, WHETHER IN CONTRACT, STRICT LIABILITY, OR TORT (INCLUDING NEGLIGENCE OR OTHERWISE) ARISING IN ANY WAY OUT OF THE USE OF THIS SOFTWARE, EVEN IF ADVISED...
- Page 252 12. Appendix cheetan cheetan is licensed under the MIT license. copyright (c) 2006 cheetan all right reserved. http://php.cheetan.net/ prototype.js Copyright (c) 2005-2010 Sam Stephenson Permission is hereby granted, free of charge, to any person obtaining a copy of this software and associated documentation files (the "Software"), to deal in the Software without restriction, including without limitation the rights to use, copy, modify, merge, publish, distribute, sublicense, and/or sell copies of the Software, and to permit persons to whom the Software is...
- Page 253 12. Appendix Ruby Ruby is copyrighted free software by KITAITI Makoto <KitaitiMakoto@gmail.com>. You can redistribute it and/or modify it under either the terms of GPL (the GNU General Public License), or the conditions below: For GPL, refer to the GPL file. 1.
- Page 254 12. Appendix msmtp msmtp is an SMTP client. In the default mode, it transmits a mail to an SMTP server (for example at a free mail provider) which does the delivery. To use this program with your mail user agent (MUA), create a configuration file with your mail account(s) and tell your MUA to call msmtp instead of /usr/sbin/sendmail.
- Page 255 (MEMO)
- Page 256 © OMRON Corporation 2013 All Rights Reserved. In the interest of product improvement, specifications are subject to change without notice...
Need help?
Do you have a question about the EQ100-E and is the answer not in the manual?
Questions and answers