
Subscribe to Our Youtube Channel
Summary of Contents for Seahorse XF96
- Page 1 XF96 Extracellular Flux Analyzer and Prep Station Installation and Operation Manual 100900-400_MANUAL XF96 W/ PREP STATION_RA...
- Page 2 REV_A RELEASED PER ECO #0161 02/11/10 Copyright: Copyright ©2009 Seahorse Bioscience Inc. All rights reserved. Trademark Information: Microsoft, Windows, Excel, and Vista are registered trademarks of Microsoft Corporation. All other trade names are properties of their respective companies. Patents applied for: Seahorse Bioscience Inc.
- Page 3 100900-400_MANUAL XF96 W/ PREP STATION_RA...
- Page 4 37ºC for ~20 minutes before running on XF96 Analyzer. Final volume per well should be 150-200 µl. 5. Load XF Assay template into XF96 software or make a new template using the Assay Wizard. Use the table below to program the optimal mix, wait and measure cycle times.
-
Page 5: Table Of Contents
Performing the XF Assay Seahorse Bioscience Cell Culture Overview XF assay Day 1 - Seeding Cells in XF96 Cell Culture Plates XF assay Day 1 - Preparing Sensor Cartridge for the XF96 Assay XF assay Day 2 - Preparing Cell Plate for the XF96 Assay... - Page 6 Analysis of XF Experimental Data – General Guidelines Basic Analysis Intermediate Analysis Advanced Analysis: Level Data Sample protocols for using the XF96 analyzer Cell titration and uncoupling experiment, C2C12 myoblast cells Metformin-Enhanced Fatty Acid Oxidation Experiment using C2C12 myoblast cells...
- Page 7 User Login and User Profile Preferences Refresh, File Menu, and File Filter Pop-up Menus, Temperature, and Auto Data Recovery Reagent and Solution Preparation XF Assay medias: DMEM, KHB Stock Compounds: oligomycin, FCCP, DNP, Rotenone, 2-DG 100900-400_MANUAL XF96 W/ PREP STATION_RA...
- Page 8 Preparation of Palmitate-BSA complex VII. XF Cell Plate Coating Methods VIII. XF96 Trouble-Shooting and FAQs XF96 Training Class Test Support Contact and Ordering Information 100900-400_MANUAL XF96 W/ PREP STATION_RA...
-
Page 9: Introduction
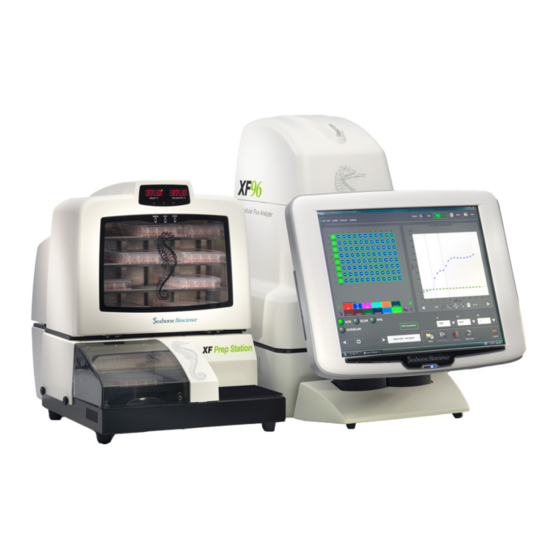
Because XF measurements are non-destructive, cells can be profiled over a period of minutes, hours or days. The XF96 system include a bench top analyzer and touch screen controller, a plate preparation station (PS) for exchanging media in the tissue culture plate, disposable measurement / compound delivery cartridges, and microplates for cell culture, calibration media and XF96 software. -
Page 10: Technical Specifications
37°C, (user ° Environment may change both) No CO control No CO control Software OS Windows Vista Windows Vista Data Interface RS232c (internal) RS232c > USB (1 cable, with TCP/IP (external) separate Serial to USB adaptor) 100900-400_MANUAL XF96 W/ PREP STATION_RA... - Page 11 100900-400_MANUAL XF96 W/ PREP STATION_RA...
-
Page 12: Xf Instrument, Controller And Ps Installation Procedure
XF96 Analyzer- The analyzer is a temperature controlled instrument that contains all optical and electronic measurement components to measure oxygen and proton flux of cells grown in XF96 cell culture plates. The analyzer is used in conjunction with XF96 sensor cartridges. - Page 13 The following items are included in the XF96 instrument and controller boxes Instrument/Controller Number XF96 Instrument XF Controller XF Controller Stand Power Cord (instrument) Power Cord (controller) Power Supply (controller) RS232 Cable 100900-400_MANUAL XF96 W/ PREP STATION_RA...
- Page 14 RS232 > USB Cable Wireless Mouse/Keyboard 1 set USB Extension Cable Extra Fan Filters Excel 2007 CD USB drive The following items are included in the Prep Station Box: Prep Station Number Prep Station 8 channel Manifold 100900-400_MANUAL XF96 W/ PREP STATION_RA...
- Page 15 XF Plate Tray Power Cord RS232 Cable RS232>USB adaptor and USB cable Reagent Bottles Reagent Bottle Top/Tube (with white check valve) Reagent Bottle Top/Tube (without check valve) 100900-400_MANUAL XF96 W/ PREP STATION_RA...
- Page 16 Vacuum Filter/muffler Suitable Locations for the XF96 system The XF96 is designed for laboratory use. The internal environment of the analyzer is controlled to a preset temperature by the user, and therefore, laboratory room temperature must be maintained within the range listed in the specification table.
- Page 17 The XF96 system is intended to be used with a non-CO , 37°C incubator that is a built in component of the Prep Station. This allows cell culture plates to remain warm during transport from the incubator to the analyzer.
-
Page 18: Internal Components Of The Xf96
Internal components of the XF96 Analyzer The measurement enclosure is the heart of the XF96 Analyzer. Removing the side doors reveals the measurement chamber in which the assay is conducted. The electro- optics hardware is enclosed in a card cage in the rear chamber and this is connected to the probe head through a set of bundles of fiber optic cables. -
Page 19: Setup And Interconnects: Cable Installation
Setup and Interconnects: Cable Installation The XF96 Analyzer is operated from a touch screen computer mounted to a stand that fits up against the front of the instrument. Two RS-232 cables handle the communication of commands and data between the instrument and the computer. - Page 20 The Keyspan USB serial adapter is designed to connect the Plate Preparation station to the controller or separate computer. It is a communications pass through that is required for the Plate Preparation station to be operated by a computer. 100900-400_MANUAL XF96 W/ PREP STATION_RA...
- Page 21 XF software know which port to use to communicate with the Plate Preparation Station. 1. Start the XF96 software. 2. Login to the software. 3. Click on “Instrument” in the lower right corner of the screen.
-
Page 22: Unpacking The Prep Station
Lift the left side of the spray shield while pulling away from the PS. Remove the packing foam from underneath the manifold mount and remove the two thumb screws from the top of the manifold mount (see right diagram below). 100900-400_MANUAL XF96 W/ PREP STATION_RA... - Page 23 Note that the hoses and connectors are coded with different color O-rings to facilitate the connection process. Often it is easier to install the hoses if the instrument is placed on the bench with the rear side facing out. 100900-400_MANUAL XF96 W/ PREP STATION_RA...
- Page 24 Schematic Diagram of the PS Hose Connections (rear view) Schematic Diagram of the Waste Hose Assembly and Media Hose Assembly to the manifold (Top view). 100900-400_MANUAL XF96 W/ PREP STATION_RA...
- Page 25 The end with the red check valve is fitted onto the LOWER (input) media pump nozzle (match green O-rings). Ensure the arrows on the valve indicate that the flow direction is out of the bottles and into the pump. 100900-400_MANUAL XF96 W/ PREP STATION_RA...
- Page 26 Ensure that the rinse basin is toward the rear of the instrument and that the tray is square and level, with the guidance tabs on the bottom aligned properly onto the tray track. Tray Plate in PS 100900-400_MANUAL XF96 W/ PREP STATION_RA...
-
Page 27: Testing The Prep Station
XF controller in the designated port (see page 19) and the serial end to the PS. Place an XF96 cell plate into the plate holder. Turn on the power of the instrument, PS and the XF controller (see page 28). -
Page 28: Temperature Settings For The Ps Incubator
100900-400_MANUAL XF96 W/ PREP STATION_RA... -
Page 29: Safety Considerations
An optical sensor is used to determine the status of the door. The XF96 has a heater that maintains a stable internal system temperature. Typically, the temperature will be maintained at 37°C, as monitored by temperature sensors and controllers embedded in the tray and above the tray. -
Page 30: Basic Operation Of The Xf96 Instrument
A drain tube leads from the bottom of the plenum to the exterior of the instrument to prevent accumulation. 4. Basic Operation of the XF96 Instrument Power and Warm up power... - Page 31 Measurements are taken using the XF96 Sensor Cartridge. It has two analyte sensor spots on the bottom of each probe that are sensitive to oxygen and proton concentration, respectively. By measuring the concentration of each analyte over time, the oxygen consumption rate (OCR) and extracellular acidification rate (ECAR) may be calculated.
-
Page 32: Xf Software And Login
XF Software and Login Launch the XF96 software and allow the XF96 Analyzer to warm to 37°C for at least two hours. Ideally, the instrument should be left on overnight to ensure consistent and accurate temperature. Note that the instrument will NOT warm to 37°C unless the XF96 software is launched (simply turning on the instrument only will NOT engage the heater). -
Page 33: Introduction To The Xf Software And Graphic User Interface
2. The Status button shows the status of the assay in real time, including the current command, current temperature, time remaining for the current step and for the entire 100900-400_MANUAL XF96 W/ PREP STATION_RA... - Page 34 Assay Wizard: Used to generate new assay templates or modify existing templates for assay design. A thorough discussion of the Assay Wizard is presented in Appendix I. Instrument: Interface for instrument set-up, preferences, troubleshooting and Seahorse instrument and software maintenance.
- Page 35 This is useful for opening templates and specifying a default template file and a default Protocol (the protocol consists of the commands used to drive the instrument). Instrument Setup: Assay Screen 100900-400_MANUAL XF96 W/ PREP STATION_RA...
- Page 36 Hardware settings fixed Seahorse Bioscience and cannot be accessed without a password. The Subsystem Buttons allow users modify certain hardware software settings. Instrument displays the serial number of the Instrument Setup: instrument Administration Screen 100900-400_MANUAL XF96 W/ PREP STATION_RA...
- Page 37 Highlight the wells and click “OK.” The current recommendation for Background Correction wells is A1, A12, H1, and H12. This information will already be set if the Assay Wizard Template is set up correctly. Subsystems: Background Correction 100900-400_MANUAL XF96 W/ PREP STATION_RA...
- Page 38 SHB may ask you to access these settings should you experience issues with barcode reading, stripping cartridge, calibration, or similar issues, otherwise you will likely not need to use these commands. Plate Manager Screen 100900-400_MANUAL XF96 W/ PREP STATION_RA...
-
Page 39: Cleaning And Routine Maintenance
User Manager Screen Cleaning and Routine Maintenance The XF96 instrument was designed for minimal cleaning and maintenance by the user. Note all consumables are disposable and none of the instrument components come into contact with the cell plate at any time, preventing cross-contamination of biological or chemical materials. -
Page 40: Performing The Xf Assay
Please refer to the following sections to familiarize yourself with these cell culture techniques. XF Assay-Day 1 6. Seeding Cells in XF96 Cell Culture Plates Assays are performed in a Seahorse 96-well cell culture plate in conjunction with an XF96 sensor cartridge. Both... - Page 41 For optimum data quality and consistency, Seahorse Bioscience recommends hydrating XF96 Sensor Cartridges overnight using the following procedure: A. Add 200 µl of Seahorse Bioscience XF96 Calibrant pH 7.4 to each well of a Seahorse Bioscience 96-well Utility plate. B. Place sensor cartridge on top of plate and store at 37ºC without CO overnight or for up to 72 hours.
-
Page 42: Operation Of The Prep Station For Media Exchange
D. Incubate the XF96 cell culture plate in a 37˚C incubator without CO until ready for use or at least 60 minutes prior to loading plate in XF96 instrument to allow cells to equilibrate to the new media. Media Changes for Differentiation in XF96 Cell Culture Plates 1. - Page 43 3. Launch the XF96 software, log in, and press the “Prep Station.” Button in the lower right portion of the screen. 4. If the Clean and dH O lines (tubes) are dry, prime the lines with Clean solution and O, respectively.
- Page 44 13. Should the user wish to perform PS maintenance manually, click on the maintenance tab in the PS screen and choose the appropriate option for your needs (Rinse and Soak, Overnight Loop, or Long Shutdown). 100900-400_MANUAL XF96 W/ PREP STATION_RA...
- Page 45 10. Loading the XF Sensor Cartridge with Compounds The XF96 Sensor Cartridge has a single Analyte Sensor Spot on the bottom of each probe that measures oxygen consumption and extracellular acidification. Each well has two injection ports, designated Port A and Port B. The Cartridge Lot Number is on the front of the cartridge and the Bar Code is on the back.
- Page 46 A drug Loading Guide is provided with the XF96 cartridges. It allows access to either all A ports OR all B ports while covering the sensor hole prevent accidentally dispensing compounds into the sensor hole. guide designed for using Rainin 250 µl pipette tips (Rainin product # RT- 20S).
- Page 47 Set up an experimental template by using the Assay Wizard (see Appendix I). This template can be prepared in advance so it is ready to be loaded into the XF96 software. Open the appropriate assay (.xls) template by clicking the “Open” icon on the bottom of the screen and choosing the desired template.
- Page 48 When the run is complete, the user will be prompted to remove the cell plate and sensor cartridge from the XF96 Analyzer. All data will be automatically exported to the export file set up at the beginning of the assay.
-
Page 49: Xf Experimental Results: Using The Xf Data Viewer
This section introduces the basic graphing, data display and data analysis features of the XF96 Analyzer software, both in the XF Reader application and the Excel-based Data Viewer. Note that these formats function in a very similar manner and either can be used for data display and data analysis. - Page 50 Rate Data (Plate view): all of the rate data for each analyte is shown in a “plate” view” by measurement. Rate Data: all of the data for each analyte by column. Time Events: Lists all of the time events associated with the experiment, including Calibration, mix, wait measure, and injection commands. 100900-400_MANUAL XF96 W/ PREP STATION_RA...
-
Page 51: Well Grid Features And Options
Note that only the selected wells of a group are factored into the mean and error values for the entire group. This allows the user to remove outlier values or view a set of wells within a group. 100900-400_MANUAL XF96 W/ PREP STATION_RA... - Page 52 Data may be normalized to cell count, protein or DNA content, cell viability, etc. This is especially useful when working with primary and/or differentiated cells where the user may have difficulty determining an accurate cell number before the XF assay. 100900-400_MANUAL XF96 W/ PREP STATION_RA...
-
Page 53: Basic Graphing Features And Options
(OCR, ECAR, PPR, OCR/ECAR, O or pH). Use the scroll bar to change which rate measurement data appears in the wells and group boxes (Rate 1, Rate 2, etc.). Analyte Buttons and Rate control 100900-400_MANUAL XF96 W/ PREP STATION_RA... - Page 54 The Zoom Feature opens a window displaying the graph in a larger viewing format. Note that Y-axis now has panning, expanding and contracting features similar to the X- axis. Also note the tab in the upper right of the window that allows the user to toggle 100900-400_MANUAL XF96 W/ PREP STATION_RA...
- Page 55 Font size, Line width, Point size, graph title, Grids, custom Zero Time Point, Injection marker options, Bar graph option, and graph legend options. Many of the features are explained in more detail in Appendices IV and V. 100900-400_MANUAL XF96 W/ PREP STATION_RA...
- Page 56 In addition to features listed above, the Excel data file also includes extra data viewing, analysis and statistical features. These features are presented in detail in Appendix III. 100900-400_MANUAL XF96 W/ PREP STATION_RA...
-
Page 57: 13. Analysis Of Xf Experimental Data - General Guidelines
Select the preferred statistical parameter (SD or SEM). Set Rate Data Display As: Middle Point Only Check “Link Y1 of graph to display variables” Check “Do Temperature Correction” Check “Show Graph Legend” Check “Draw Vertical Markers 100900-400_MANUAL XF96 W/ PREP STATION_RA... -
Page 58: Intermediate Analysis
For example, the % change in OCR may be viewed instead of the absolute rates. This is useful when comparing data from multiple plates or experiments run at different times (see below). Absolute OCR Baselined OCR (% change) 100900-400_MANUAL XF96 W/ PREP STATION_RA... - Page 59 For example, we begin with separate kinetic graphs of the OCR and ECAR (PPR) data: OCR only ECAR only OCR + ECAR 100900-400_MANUAL XF96 W/ PREP STATION_RA...
- Page 60 “level data”. Level data is the raw data corresponding to the changes in mm O vs. time or pH vs. time for OCR and ECAR, respectively. 100900-400_MANUAL XF96 W/ PREP STATION_RA...
- Page 61 DNP, the starting O2 levels decrease with each successive measurement. This is due to the fact that the cells are now O2 level data: non-ideal 100900-400_MANUAL XF96 W/ PREP STATION_RA...
- Page 62 Below are subtle and extreme examples (left and right, respectively) showing the pH of the injected compound altering the pH of the media in the well. 100900-400_MANUAL XF96 W/ PREP STATION_RA...
-
Page 63: Metformin-Enhanced Fatty Acid Oxidation Experiment Using C2C12 Myoblast Cells
This experiment demonstrates addition of the fatty acid, palmitate, to increase the OCR of the cells. (Note that more example protocols for the XF96 will be added in the near future.) The purposes of these protocols are several-fold: 1) Introduces new users of the XF96 to the experimental methods used to obtain... - Page 64 14. Dose Response Experiment using C2C12 myoblast cells In this experiment, C2C12 cells are seeded at a given density in Seahorse cell culture plates. The basal oxygen consumption (OCR) and extracellular acidification (ECAR) rates are measured to establish baseline rates. The cells will then be treated with...
- Page 65 Note: A one-step seeding procedure is used for XF96 plates a. The culture surface of the XF96 plate is 40% the area of a typical 96 well plate. For XF96 assays, C2C12 cells are seeded at 12,000 cells per well in a final volume of 80 µl.
- Page 66 A , using a multi- channel reservoir. c. Incubate the loaded cartridge at 37°C non CO incubator until ready for use. 8. Assay Protocol Protocol Steps Time Command Port (min) Calibrate Equilibrate Loop Start 100900-400_MANUAL XF96 W/ PREP STATION_RA...
- Page 67 “baseline” the data to % response to obtain information from the graph. This is performed by using the button, and setting the baseline option for “baseline subtraction just prior to injection A (default option). The “baselined” graphs are shown below. 100900-400_MANUAL XF96 W/ PREP STATION_RA...
- Page 68 100900-400_MANUAL XF96 W/ PREP STATION_RA...
- Page 69 FAO in XF96 Analyzer. This offers a rapid, easy and non-radioactive alternative assay for fatty acid oxidation. In addition, both kinetic and accumulative data can be obtained in a single assay.
- Page 70 Note: A one-step seeding procedure is used for XF96 plates a. The culture surface of the XF96 plate is 40% the area of a typical 96 well plate. For XF96 assays, C2C12 cells are seeded at 12,000 cells per well in a final volume of 80 µl.
- Page 71 Load 20 µl of BSA-Palmitate into both ports per well (e.g. ports A & B) for columns 3, 5, 7, 9, and 11 (40 ul total per well). Note: optimal palmitate concentration for different cell types can vary. Palmitate concentration titration is recommended for a specific cell type/line 100900-400_MANUAL XF96 W/ PREP STATION_RA...
- Page 72 OCR and ECAR values of the cells (increasing concentrations tend to decrease the basal OCR rates, see graph below), thus in order to make a direct comparison among groups, the % response is used. 100900-400_MANUAL XF96 W/ PREP STATION_RA...
- Page 73 FAO activity. AVG AUC (Measurements 4 - 8) 600.00 0Met-BSA 500.00 0Met-PA 0.25mM Met-BSA 400.00 0.25mM Met-PA 300.00 0.5mM Met-BSA 0.5mM Met-PA 200.00 0.75mM Met-BSA 100.00 0.75mM Met-PA 0.00 1mM Met-BSA 1mM Met-PA -100.00 100900-400_MANUAL XF96 W/ PREP STATION_RA...
- Page 74 (palmitate). E.g. HepG2 cells appear to have little to no response in an FAO assay. Further, other cell types may require additional components (e.g. insulin, metformin, etc.) to show an acute response in OCR to exogenous fatty acid injection. 100900-400_MANUAL XF96 W/ PREP STATION_RA...
-
Page 75: Appendices
Wizard, use the Reset button clear that XF96 Assay Wizard Screen: General particular section. Description of the Assay Wizard Tabs and building an XF Assay Template : This is to input project info, such as assay name, project name, etc. - Page 76 Repeat steps a-e to assign “Blank” to the reference wells. (Hint: simply select the four wells to be used, then press “assign”. Be sure to enter a seeding count of “0” here. You may use the Zoom Grid button to view the Cell Layout in full screen. 100900-400_MANUAL XF96 W/ PREP STATION_RA...
-
Page 77: Media And Ppr Tab
7.4. This value is then used in calculating Proton Production Rate (PPR). Note that if no Buffer Capacity value is assigned to a new assay media, then a default value will be used for the PPR calculation 100900-400_MANUAL XF96 W/ PREP STATION_RA... -
Page 78: Compounds Tab
“New”, then enter compound Name concentration information. Repeat for multiple compounds. Note that the user may also store compound Assay Wizard: information in the database by clicking “add to Compound Info Screen database”. 100900-400_MANUAL XF96 W/ PREP STATION_RA... -
Page 79: Background Correction Tab
Do Background Correction: this button engages background correction function and should always be ON. Label for background wells: Typically “Bkg. Cor.” is used, but the label may be changed by the user if desired. Assay Wizard: Back. Corr. Tab 100900-400_MANUAL XF96 W/ PREP STATION_RA... -
Page 80: Groups And Labels Tab
Click the wells in the plate layout to add them to a specific group. e. Repeat to assign each well to a group if desired. f. Up to 96 groups can be identified for each plate. Wells that are not assigned to a group will be black. 100900-400_MANUAL XF96 W/ PREP STATION_RA... -
Page 81: Protocol Tab
Media Change: This button is not yet functional in the current version of software. Copy: Copies the highlighted commands, can be used in conjunction with the Paste command to facilitate protocol set up. 100900-400_MANUAL XF96 W/ PREP STATION_RA... - Page 82 D. Note that OCR and ECAR values are typically not stable until the second or third measurement cycle, thus it is strongly recommended that 4 basal measurements are performed prior to injection of compounds in order to establish the baseline metabolic rates for the experiment. 100900-400_MANUAL XF96 W/ PREP STATION_RA...
-
Page 83: About Mix, Wait And Measure Times
The saved template can be modified at any time by opening it back up in the Assay Wizard and changing the desired fields. To end the Assay Wizard, press the End Wizard button. 100900-400_MANUAL XF96 W/ PREP STATION_RA... - Page 84 When constructing protocols in the Assay Wizard, Load… and Save… buttons will be available to load and save protocol files. Protocols can be saved separately as *.ptc files for later recall. This feature is only available in the Assay Wizard. 100900-400_MANUAL XF96 W/ PREP STATION_RA...
-
Page 85: Ocr, Ecar And Ppr: Information On Rates Calculations
Delta, set in mmHg, defines the range of values to use from the starting point. Seahorse Bioscience recommended that the Edge Offset equal/be set to 1 and Delta to 50 mmHg in order to achieve the most accurate measurements. - Page 86 When calculating OCR, there is an edge offset of 1, so the first point of level data is omitted, and is displayed in the graph as an outline. Level Data The next four points are solid. They 100900-400_MANUAL XF96 W/ PREP STATION_RA...
- Page 87 A default value of 16.74 µl for the chamber volume is based on calculations comparing rate data between the XF24 and XF96 instruments and knowledge of O2 diffusion and storage properties of the materials used for the XF96 plates and cartridges.
-
Page 88: Ecar Calculations And Settings
Extracellular Acidification Rate (ECAR) Calculation and Settings Since the introduction of the XF96, extra-cellular acidification rate (ECAR) has been calculated using the 2 Points technique for determining the slope. The slope between the average of three points at the beginning and end of the measurement period determined the rate. -
Page 89: Ppr Calculations And Settings
An exponential function is used to calculate buffer capacity at any measured pH level. This function is derived from a table of pH values and their corresponding buffer capacity. The pH values are in 0.1 pH increments starting at 7.4. 100900-400_MANUAL XF96 W/ PREP STATION_RA... - Page 90 Default Buffer Capacity field is used if no running media has been defined or assigned to the plate. The Buffer Capacity calculation Technique determines whether buffer capacity will be treated as a fluctuating factor in the assay or a constant. 100900-400_MANUAL XF96 W/ PREP STATION_RA...
- Page 91 2. Select the Buffer Capacity calculation Technique. The default value of Variable is recommended. This step must be performed on the instrument controller prior to starting the assay. If using the default Variable technique, this step can be skipped since no change is required. 100900-400_MANUAL XF96 W/ PREP STATION_RA...
-
Page 92: Measuring The Experimental Buffer Capacity Of Xf Assay Media
= 1.18 (from 7.40 to 8.58, recall pH is a unit-less value) Buffer Capacity = (1.0 M * 27 x 10 L) / (1.18 * 25 x 10 = 27 x 10-6 moles / 29.5 x 10 = 9.152 x 10 moles/L = 9.152 x 10 100900-400_MANUAL XF96 W/ PREP STATION_RA... -
Page 93: Group Statistics And Auc Analysis
Appendix III - Group Statistics and AUC analysis Statistics, CVs and Data quality Because the XF96 is a non-invasive instrument, multiple measurements may be made within a well and thus remove biological variability. From measurement to measurement within a well, the CV is +/-5% and can be considered instrument noise only. Further, because basal metabolic measurements are taken before addition of any compounds, each well may serve as its own control. - Page 94 This feature is useful for reviewing the statistics associated with the entire experiment and may be useful for identifying trends and troubleshooting the experiment. These values may also be copied to other graphing programs if desired. 100900-400_MANUAL XF96 W/ PREP STATION_RA...
-
Page 95: Auc Analysis Using Multiple T-Tests
Excel, you will prompted insert Office installation CD. To enable the add-in, go to the Tools menu and select Add-Ins… The Add-Ins dialog will appear. Select the checkbox for Analysis ToolPak – VBA. Click 100900-400_MANUAL XF96 W/ PREP STATION_RA... - Page 96 Analysis Results The AUC worksheet contains several elements. At the top left is a bar chart of the average AUC for each group. To the right is a copy of the Data Viewer graph. 100900-400_MANUAL XF96 W/ PREP STATION_RA...
- Page 97 % and would represent a total percentage change from the baseline. In addition, if the normalization option is enabled and the data is normalized to cell count or some other factor, then the AUC is calculated using the normalized data. 100900-400_MANUAL XF96 W/ PREP STATION_RA...
-
Page 98: Anova Auc Analysis
Tukey method has been implemented for determining HSD (Honest Significant Different) to generate a table of P values comparing each pair of groups. Using the Tool 1. Click on the AUC Group Anova Analysis... button. 100900-400_MANUAL XF96 W/ PREP STATION_RA... - Page 99 4. Once the groups have been selected, click OK. 100900-400_MANUAL XF96 W/ PREP STATION_RA...
- Page 100 The AUC worksheet contains several elements. At the top left is a bar chart of the average AUC for each group. The error bars indicate Standard Deviation or Standard Error, depending on your selection in the graph settings dialog. 100900-400_MANUAL XF96 W/ PREP STATION_RA...
- Page 101 AUC is calculated. Assuming the third point is the starting rate, the yellow region, representing the baseline area, is subtracted from the total area. The remainder, the red region, is the AUC used in the analysis. 100900-400_MANUAL XF96 W/ PREP STATION_RA...
- Page 102 P value from the ANOVA test is not significant. To the right of the table of P values is a table of Q values. These values are from the Studentized Range distribution. Tukey’s HSD test is based on this distribution. 100900-400_MANUAL XF96 W/ PREP STATION_RA...
- Page 103 Again, note that a significant P from the ANOVA test only indicates that one or more groups may be different from the rest. It does not tell you which group or groups are different. We use Tukey’s HSD post-test to determine which groups are significantly different from the others. 100900-400_MANUAL XF96 W/ PREP STATION_RA...
-
Page 104: Advanced Graphing Options And Features
The examples in figure above displayed a single analyte. Use the Y2 axis to display a second analyte on the graph as shown in the figures below, comparing rates 4 and 5. Group Display of OCR & ECAR at Rate 4 (before injection) and Rate 5 (after injection) 100900-400_MANUAL XF96 W/ PREP STATION_RA... - Page 105 2. Enable the option to Match Y2 zero to Y1 (This feature is under the Advanced Graph Options in the XF Reader Software). 3. Click Close. 4. Click on the button 100900-400_MANUAL XF96 W/ PREP STATION_RA...
- Page 106 To display it as shown in the figure to the right, 1. Click on the button to open the graph settings dialog and then on Advanced Graph Options…. 2. Enable the option to Display Date in Title. Graph with Assay Date displayed. 100900-400_MANUAL XF96 W/ PREP STATION_RA...
- Page 107 2. Configure the Grid settings. Options include single axis lines or lines in both axes. The lines can be either solid or dotted. The figures below show four examples with grid line options: Graph Examples showing Grid Lines in only one axis 100900-400_MANUAL XF96 W/ PREP STATION_RA...
- Page 108 2. Enable the Display Legend when in Well Group Mode options. Also select the default location for the legend. 3. Once displayed, adjust the position of the legend by clicking and dragging. Graph Legend Examples 100900-400_MANUAL XF96 W/ PREP STATION_RA...
- Page 109 The port letters can now be replaced with customized labels. The figure below shows a graph with the standard port labels and with custom labels. Standard and Custom Injection Marker Labels 100900-400_MANUAL XF96 W/ PREP STATION_RA...
-
Page 110: Labels
2. Click on the Time Zero Options button. 3. As shown in the figure below, an injection point or protocol command can be selected as the new time origin. Click OK after making a selection. 4. Close the graph settings dialog 100900-400_MANUAL XF96 W/ PREP STATION_RA... - Page 111 When analyzing data, it’s often necessary to manually adjust the min and max values of the graph axes to focus in on a subset of data. In the Excel-based Data Viewer, this can now be done interactively. 100900-400_MANUAL XF96 W/ PREP STATION_RA...
- Page 112 These may be found in the Graph options dialogue (see figure to right). Graph Options Dialogue: Point to Point Rates mode 100900-400_MANUAL XF96 W/ PREP STATION_RA...
-
Page 113: Labels
Also, select a color and size for the text font. Click OK when finished. After all labels have been added, click OK on the Labels dialog Label Info dialog 100900-400_MANUAL XF96 W/ PREP STATION_RA... -
Page 114: Data Threshold Option
The figure to the right shows an example graph with a threshold applied. Threshold applied to scatter plot of OCR vs. ECAR. 100900-400_MANUAL XF96 W/ PREP STATION_RA... - Page 115 3. Close the graph settings dialog. Enabling Display threshold. 4. Click on the Well Group Mode button so it is not outlined in green. Note: Well group mode is not compatible with the threshold feature. 100900-400_MANUAL XF96 W/ PREP STATION_RA...
- Page 116 Threshold graphing an analyte vs. another analyte When graphing an analyte versus time, the threshold region is indicated by a solid red line bounded by two dotted red lines indicating the range. Threshold graphing an analyte vs. time 100900-400_MANUAL XF96 W/ PREP STATION_RA...
-
Page 117: Working With Multiple Data Sets
Files of type option. 3. Once a file has been selected, click Open. Open dialog The list in the Data Files tab will update to indicate the contents from the selected file have been added. 100900-400_MANUAL XF96 W/ PREP STATION_RA... - Page 118 The well grid can only show data from one data set at a time. To switch between data sets, click and highlight the desired listing on the Data Files tab. Continue to use the controls on the Grid & Graph Controls tab to select which analyte to display in the grid. 100900-400_MANUAL XF96 W/ PREP STATION_RA...
- Page 119 The figure below shows a group from two different data sets graphed separately on the left and averaged together on the right. Averaging Data from Two Data Sets 100900-400_MANUAL XF96 W/ PREP STATION_RA...
-
Page 120: Multi-View And Multi-Graph Display
Initially, each data file will start out with one tab representing the default view. More tabs can be added using the buttons at the lower right. This feature is useful for looking at several different graphs from the same assay at one time. Data Viewer 100900-400_MANUAL XF96 W/ PREP STATION_RA... - Page 121 Click on the Graph tab to see a display of each graph from the four views. In this mode, the tabs include a button for showing and hiding the corresponding graph. So one, two, or three graphs can be displayed instead of all four. 100900-400_MANUAL XF96 W/ PREP STATION_RA...
-
Page 122: Saving And Exporting Graph Data
As shown in the figure below, the worksheet will contain pictures of the well grid and graph. The data will be located below the pictures organized by group or well, depending on how the graph is configured. 100900-400_MANUAL XF96 W/ PREP STATION_RA... - Page 123 Right click on Graph: choose “save graph data…..” The “save graph data” output will contain only the data shown in the graph: Export from the Save Graph Data function: OCR 100900-400_MANUAL XF96 W/ PREP STATION_RA...
-
Page 124: Copying, Saving And Exporting Graph And Well-Grid Images
Save As dialog for the Graph 4. Select Image without border to have a borderless image. This produces a result similar to Copy Standard when choosing to copy and paste the graph. 100900-400_MANUAL XF96 W/ PREP STATION_RA... -
Page 125: The Media, Cell, & Compound Database And Additional Features And Options
3. A window with a running media list will appear. Click on and highlight the desired media name from the list. The definition will be displayed on the right side window. Click Select. 4. The selected media should now appear in the Running Media List on the Media Info screen. 100900-400_MANUAL XF96 W/ PREP STATION_RA... - Page 126 To configure the software to access these files from a different location 1. Click on the Instrument button to enter instrument setup. 100900-400_MANUAL XF96 W/ PREP STATION_RA...
-
Page 127: User Login And User Profile Preferences
Results screen or Run screen. A Guest login, requiring no password, is provided. Editing or removing user logins can be done via the User Manager tool in the Instrument setup section. 100900-400_MANUAL XF96 W/ PREP STATION_RA... - Page 128 New User… button. In the User Info dialog, enter in the login and password. Though only three seahorse icons are available, there is no limitation on the total number of users that can be created. User Login Info...
- Page 129 This administrative function can be done from the User Manager section of Instrument setup. Display this section by selecting the User Manager button after entering Instrument setup mode. Accessing User Manager 100900-400_MANUAL XF96 W/ PREP STATION_RA...
- Page 130 Administrator level logins can access this section. To remove unneeded users, select a user login and click on the Delete button. New users can also be created here instead of at the main login screen. User Manager 100900-400_MANUAL XF96 W/ PREP STATION_RA...
-
Page 131: Refresh, File Menu And File Filter
All files can be displayed, or just those files generated by the XF software. The data files come in two formats, *.xls and *.xfd. 100900-400_MANUAL XF96 W/ PREP STATION_RA... -
Page 132: Pop Up Menus, Temperature And Auto Data Recovery
Double-clicking on a file opens that file and displays the data in the Results section. Double-clicking on a folder opens the folder and displays the contents on the right hand tree display in the Files section. 100900-400_MANUAL XF96 W/ PREP STATION_RA... - Page 133 Figure 31 shows the error message that will be displayed if this occurs. If the software has been installed to the default location, the Recovered Data folder can be found here: C:\Program Files\Seahorse Bioscience\XFReader96\Recovered Data. 100900-400_MANUAL XF96 W/ PREP STATION_RA...
-
Page 134: Reagent And Solution Preparation
XF Assay Media, Specially Formulated DMEM (0 mM Glucose) Part No. 100965 XF Assay Media is for use in conjunction with the Seahorse Bioscience XF Analyzer instruments, XF Biosensor cartridges and XF tissue culture plates. XF assays require a non-buffered media to accurately measure proton production rate and extra cellular acidification rate (PPR and ECAR) of cells growing in culture. - Page 135 25 mM 0.0008557 Note that Seahorse Bioscience suggests that serum (e.g. FBS) be omitted from the final media formulation as it will affect the buffer capacity of the media. If FBS is required for cell viability or phenotypic maintenance, Seahorse Bioscience suggests using low amounts (~1% or less) and determining the resulting buffer capacity empirically for accurate PPR calculations.
- Page 136 Use 5M NaCl stock solution. Make 100 mL stock solutions of KCl (1 M), MgSO (0.5 M), and Na (0.5 M) in dH O as follows: Stock Concentration (M) Amount for 100 mL NaCl --purchase-- 7.456 g MgSO 6.019 g 7.098 g 100900-400_MANUAL XF96 W/ PREP STATION_RA...
- Page 137 Add indicated volumes of 5X KHB, dH2O, 45% glucose solution and 50mM carnitine in a beaker containing a stir bar. # of 1x KHB 5X KHB 45% glucose 50mM carnitine Plates Needed (mL) (mL) (mL) (mL) 0.05 0.10 0.15 0.20 100900-400_MANUAL XF96 W/ PREP STATION_RA...
- Page 138 Dilute in XF Assay media to achieve desired stock concentration for loading into injection ports. Typical working (final) concentrations are 0.1 – 5.0 µM. Note that response to FCCP will be dependent in Assay media composition ([pyruvate], [glucose], presence of BSA, etc.) Aliquot and store at -20°C. 100900-400_MANUAL XF96 W/ PREP STATION_RA...
- Page 139 Hint: compare the color of 2-DG solution to the same volume of unbuffered DMEM media to accurately pH. Make sure both solutions are at the same temperature during comparison. You may also test with a narrow band pH strip. 100900-400_MANUAL XF96 W/ PREP STATION_RA...
-
Page 140: Preparation Of Palmitate-Bsa Complex
44 ml of 150 mM NaCl solution in 50mL Erlenmeyer flask. 2. Cover flask with parafilm and weight with lead ring. Place in the other pre- warmed 1.0 L water bath on a heated stir plate; heat to 70˚C while stirring (thermometer in water bath). 100900-400_MANUAL XF96 W/ PREP STATION_RA... - Page 141 BSA which is 0.17 mM for a 5x injection to 33.3 µM final. The conjugated palmitate can be diluted to a lower concentration with NaCl or KHB. This protocol can be adapted to make a 2 mM palmitate solution for 10x injection, or 8x, etc as desired. 100900-400_MANUAL XF96 W/ PREP STATION_RA...
- Page 142 FAQs. For further information, please contact your local Seahorse Bioscience Field Application Scientist You may also contact Seahorse Bioscience Support via email or phone (see Appendix X below). Appendix IX: XF96 Training Completion Check Questions 1.) Label the Injection Ports below: 1.
- Page 143 8.) What is typically the shortest measurement period?____________________________ 9.) True or False: A 1-Step seeding procedure is used for seeding cells in the XF96 cell culture plates. 10.) When seeding a new cell line in XF96 cell culture plates, how long should you wait...
- Page 144 18.) What is the Seahorse Bioscience Customer Support email address?______________ 19.) When the XF96 is set up in YOUR lab, perform a baseline cell run with an acute drug response (2,4-DNP, CCCP, etc.) following the guidelines detailed in this protocol.
- Page 145 Appendix X – Contact, Support and Ordering Information For questions about XF technology, the XF96 instrument, Prep Station, XF experimental design, data analysis, troubleshooting and other information: Email: support@seahorsebio.com Phone (USA): (800) 671-0633, option #3 Phone (EU): +1 (978) 671-1600, option # 3...
Need help?
Do you have a question about the XF96 and is the answer not in the manual?
Questions and answers