Table of Contents
Advertisement
Quick Links
Advertisement
Table of Contents

Related Manuals for Honeywell Experion MX


Summary of Contents for Honeywell Experion MX
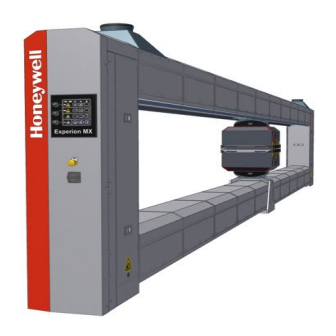
- Page 1 Experion MX RELEASE 702.1 Operators Guide 6510020335 Rev 02 May 2019...
- Page 2 In no event is Honeywell liable to anyone for any direct, special, or consequential damages. The information and specifications in this document are subject to change without notice.
-
Page 3: Table Of Contents
Scanner Crash and Forward/Reverse Limit Switches ..............70 2.5.6 Motor Torque ..............................70 ............................71 ETTING TARTED About Experion MX Quality Control System ..................71 System Overview ..............................71 Scanners .................................. 72 Sensors ..................................72 3.4.1 Basis Weight ............................... 72... - Page 4 ABOUT THIS GUIDE 3.4.2 Moisture ................................73 3.4.3 Caliper ..................................73 3.4.4 Color ..................................73 3.4.5 Ash ................................... 74 3.4.6 Formation ................................74 3.4.7 Gloss ..................................74 3.4.8 Coat Weight................................. 74 3.4.9 Z – Axis ................................... 74 3.4.10 Air Gap Temperature ............................75 Operator Stations ..............................
- Page 5 5.4.1 Reel Display ..............................100 5.4.2 Grade Display ..............................101 5.4.3 Shift and Day Display ..........................102 Printed Reports ..............................106 5.5.1 Reel Report ............................... 107 5.5.2 Grade Report..............................108 5.5.3 Shift Report ..............................109 5.5.4 Day Report ................................ 110 ....................
- Page 6 ABOUT THIS GUIDE 6.8.2 Trend Graph and Data ..........................139 6.8.3 Trend Display Control ..........................140 Recipe Change Display ..........................142 6.9.1 Selecting the Next Recipe ......................... 144 6.9.2 Loading the Current Recipe ........................144 6.10 Multi Profile Display ............................145 6.10.1 Profile Selection .............................
- Page 7 ............................... 168 OTICES 6510020335...
-
Page 8: About This Guide
ABOUT THIS GUIDE About this guide Scope The purpose of this manual is to introduce the Experion MX Quality Control System, and its operation. Revision history Revision Date Description May 2011 Initial release of the document May 2018 Updated for R702.1 release. -
Page 9: Scanner Safety And Local Controls
SCANNER SAFETY AND LOCAL CONTROLS Scanner Safety and Local Controls The Experion MX QCS may be connected to a variety of scanners. Each scanner is equipped with a system of local control operation and safety features. In general, the items and concepts are applicable to all scanners but the specific examples and figures that are explained in this chapter is for the Model Q4000-80 series. -
Page 10: Training
Radiation Safety Training for Customers: While this manual includes references to appropriate safety and regulatory requirements because scanners include sensors that use radiation sources, Honeywell strongly recommends that users obtain and become familiar with the information provided in the Radiation Safety Manual For Honeywell Customers (p/n 6510020197). -
Page 11: Safety Hazards
SCANNER SAFETY AND LOCAL CONTROLS Safety Hazards To quickly determine hazards for working on or near the scanner, refer to the hazard zone figures in this section, and the appropriate safety warnings and precautions listed and described in the accompanying tables and Figures. There are many potential personal safety hazards associated with the scanner. - Page 12 SCANNER SAFETY AND LOCAL CONTROLS Pinch point Warning Label Fig. 2. Body Crush Warning Label Fig. 3. Hand Crush Warning Label Fig. 4. Prior to opening any scanner beam or side cover panel, the scanner motor must be locked out by using a hasp on the motor drive breaker. This CAUTION completely prevents unintended motion that could be caused by actions of coworkers or software routines while working near drive components.
- Page 13 SCANNER SAFETY AND LOCAL CONTROLS When the scanner is raised or spans open floor areas, fall protection needs to be considered in accordance with local mill rules and regulations. Table 1 lists and describes hazard zones. Scanner Frame: Mechanical Motion Precautions Table.
- Page 14 SCANNER SAFETY AND LOCAL CONTROLS Belt Bracket Pinch points Fig. 7. Lower Carriage Pinch point Fig. 8. 6510020335...
- Page 15 SCANNER SAFETY AND LOCAL CONTROLS Power Track Bracket Pinch point Fig. 9. Belt Tension Pulley Pinch point Fig. 10. 6510020335...
- Page 16 SCANNER SAFETY AND LOCAL CONTROLS 2.2.1.2 Hot Surfaces Warning labels on the leading edge of the head indicate hot surfaces (see Figure 11). Hot Surface Warning Label Fig. 11. The scanner head has a number of heated surfaces that may pose burn hazards. Figure 12 identifies potentially hot surfaces, such as sheet guides and leading edges, as well as safety precautions.
- Page 17 SCANNER SAFETY AND LOCAL CONTROLS Compressed Air Hoses (red), and Coolant Hoses (green) Fig. 13. Below table lists and describes hazards, warnings, and safety precautions related to the air and coolant systems on the scanner. 6510020335...
- Page 18 SCANNER SAFETY AND LOCAL CONTROLS Compressed Air and Coolant Precautions Table. 2. Hazard Type Warning Safety Precaution Red hoses, compressed air (See Energized air lines can cause Ensure that compressed air to the scanner Fig 12) projectile motion and hose-whip that is isolated and de-energized;...
-
Page 19: Electrical Safety Hazards
SCANNER SAFETY AND LOCAL CONTROLS 2.2.1.4 Misalignment of the Upper and Lower Heads If the upper head does not completely cover the lower head for any reason, care must be taken that nobody is exposed to the beam. Pushing any off sheet button, either on an operator station or on the scanner control panel, closes the shutter, eliminating the hazard, as can be verified by observing the shutter status indicator lights. - Page 20 SCANNER SAFETY AND LOCAL CONTROLS Cable End Voltage Zones Fig. 15. 6510020335...
- Page 21 SCANNER SAFETY AND LOCAL CONTROLS Distant End Voltage Zones Fig. 16. 6510020335...
- Page 22 SCANNER SAFETY AND LOCAL CONTROLS Scanner Head Voltage Zones Fig. 17. Electrical Hazard Voltage Precautions Table. 3. Hazard Type Warning Safety Precautions Work in this area exposes the worker Work on wiring or components on the to high voltage and current levels that input power rail requires de- can cause serious and/or fatal injury.
- Page 23 SCANNER SAFETY AND LOCAL CONTROLS 2.2.2.3 Electric Shock Within the end bells, some terminations are not completely covered by access shields or insulation. At these locations a user could come into contact with AC power at 208–240 V AC levels. Electrical shock warning labels (see Figure 18) have been placed in locations where bare terminations pose electrical shock hazards (see Figure 19.
-
Page 24: Radiation Safety Hazards
Review those sections with special care, and note any questions that need to be answered by Honeywell authorized personnel. 2.2.3.1 Nuclear radiation The measuring head on the scanner typically has a radioactive source with shielding casing materials and an aperture opening controlled by a shutter system. - Page 25 SCANNER SAFETY AND LOCAL CONTROLS Nuclear Radiation Hazard Zone Fig. 20. Shutter status indicators, the red and green lights on heads and user panels, indicate radiation sensor shutter open or close states. These indicators are mounted to both upper and lower heads (see Figure 21), facing both directions, and to end bell user panels (see Figure 22).
- Page 26 SCANNER SAFETY AND LOCAL CONTROLS Figure 21 shows a typical user panel radiation status condition, indicating: • the nuclear sensor interlock switch is on, yellow indicator and switch position • the basis weight sensor button has been enabled, yellow ring indicator •...
- Page 27 SCANNER SAFETY AND LOCAL CONTROLS Table 4 summarizes nuclear and X-ray radiation hazards, warnings, and safety precautions to be used in systems with a nuclear- or X-ray-based sensor (radiation hazard zone < 1 m (3.28 ft) from heads). Nuclear and X-ray Radiation Hazard Precautions Table.
- Page 28 SCANNER SAFETY AND LOCAL CONTROLS Laser eye safety is controlled by an interlock key switch and enable button on the user panel (see Figure 24). Additionally, software and hardware interlocks ensure that sensors are properly mounted and aligned, and that software controls are properly functioning. User Panel Laser Interlock Key switch and Sensor Enable Button Fig.
- Page 29 2.2.3.3 General radiation safety precautions The Honeywell system has been designed with built-in safety interlocks to handle anticipated hazards. However, there are a few additional common-sense rules of safety that must be followed. All personnel working in the area around the head must become familiar with the following basic precautions regarding these types of devices: •...
-
Page 30: Fire Contingency
SCANNER SAFETY AND LOCAL CONTROLS • In the event of a fire near the scanner, turn the equipment off and put out the fire; extinguishing the fire is the highest priority. Authorized and qualified service personnel must examine the equipment before returning it to service. •... - Page 31 SCANNER SAFETY AND LOCAL CONTROLS lifting. Unlatching the top caps is most easily done by releasing and lifting one side at a time. Before you remove the top cover, make sure to remove the associated side covers. NOTE The beam side panels do not contain latches and can be removed for ease of maintenance.
- Page 32 SCANNER SAFETY AND LOCAL CONTROLS 2.3.1.2. Head Covers Description: Head covers (see Figure 26) are located on the cross-direction sides of both upper and lower heads. They are removable with the use of an 8-mm square key (see Figure 27). Head Covers Fig.
- Page 33 SCANNER SAFETY AND LOCAL CONTROLS Each end bell of the scanner contains two vertical side panels. Each panel hooks onto the scanner at the top edge and has a keyed latch located at the bottom edge (see Figure 28). The removable panels allow maintenance access to internal scanner systems within minimal space requirements.
- Page 34 SCANNER SAFETY AND LOCAL CONTROLS The operating equipment is housed in two cabinets at either end of the scanner. These cabinets are accessible through the end cabinet doors, which are locked with two square key latches at top and bottom along one side to prevent unauthorized access (see Figure 29).
- Page 35 SCANNER SAFETY AND LOCAL CONTROLS SCANNER STOP Button Fig. 30. Pushing this button on either end of the scanner electrically disables the enable signal to the motor drive, and disarms the emergency stop circuit to provide alarm information to the system computer. Pull the button back out to re-enable the motor drive.
- Page 36 SCANNER SAFETY AND LOCAL CONTROLS Head Buffer Stop Fig. 31. The head buffer stop is employed to arrest the horizontal motion of the head in the event that the scanner fails to stop at its configured software scan position limits. The positions of the head buffer stops are factory-set to the required positions relative to the end columns, and field adjustment is normally not required.
- Page 37 SCANNER SAFETY AND LOCAL CONTROLS Safety Labels (without text) Table. 6. Image Description Location Warning! Hand pinch and entanglement hazard Outside vertical side panels at both the from belts and pulleys. cable and distant end (see Subsection 2.2.1.1). Warning! Body crush hazard between the head and Inside scanner O-frame on vertical plates scanner O-Frame.
- Page 38 SCANNER SAFETY AND LOCAL CONTROLS Safety Labels (with text) Table. 7. Image Description Location Caution! Radioactive material to be Located on a head containing serviced by authorized personnel only. Nuclear source (if present). Safety shield must be inserted into the gap before service can begin.
-
Page 39: Electrical Safety Features
SCANNER SAFETY AND LOCAL CONTROLS User Panel Key Fig. 32. Purpose: Keys provide access control to: • scanner internals protected by panels and doors • head gap surfaces through head split switch • safety-related sensor interlock operations such as nuclear, X-ray, and laser sources Only authorized personnel should have access to scanner keys. - Page 40 SCANNER SAFETY AND LOCAL CONTROLS Purpose: Electrical LOTO allows for power control of a system or subsystem by workers in accordance with mill rules and safety regulations. 2.3.2.2 Scanner Drive Interlock Description: The scanner drive interlock is a 24V armed circuit that disables the motor drive enable signal when voltage is broken by either faulty wiring, or either of the SCANNER STOP operator buttons on each end column (see Figure 34).
- Page 41 SCANNER SAFETY AND LOCAL CONTROLS Purpose: Crash switches are mounted in a groove in the upper track and are triggered just before contact with the buffer stops at each end. Triggering a crash switch signals the frame control system to stop the motor. Motion limit switches are mounted inboard of crash switch locations in the lower track, and are marked as forward limit switch (distant end), and reverse limit switch (cable end).
- Page 42 SCANNER SAFETY AND LOCAL CONTROLS Sensors with nuclear or X-ray radiation-based shutter controlled sources route the signal through microswitches attached to the shutter closed positions. Empty sensor positions, or sensors without radiation hazards, use a jumper in the wiring harness to complete the circuit. User panels pass the signal as well, requiring the last panel in line to utilize a jumper to close the circuit.
- Page 43 SCANNER SAFETY AND LOCAL CONTROLS There are two types of labels used that relate to grounding safety: Equipotential (see Figure 37), and Earth (see Figure 38). Equipotential Label Fig. 37. Earth Ground Label Fig. 38. Grounding is required for safety and reliable operation of the electrical subsystems. Before power is connected to the scanner, a safety ground should be terminated to the scanner (see Figure 39).
- Page 44 SCANNER SAFETY AND LOCAL CONTROLS This safety ground connects the scanner frame to a local ground to prevent any potential connection between the scanner and surrounding conductive equipment, and the resultant possibility of electrical shock. The safety ground should be 6 AWG wire to easily conduct the maximum current possible with an accidental ground fault.
- Page 45 SCANNER SAFETY AND LOCAL CONTROLS This switch disconnects all scanner subsystems, after the GFI breaker, from electrical power, effectively disabling power to: • Heads • Power tracks • TES pump • Transformer • Motor drive and motor • Cable end power supplies •...
-
Page 46: Radiation Safety Features
SCANNER SAFETY AND LOCAL CONTROLS Thermal Switch Fig. 42. Purpose: These devices are intended to protect equipment and sensors only in case of unintended extreme conditions. Tripping of these devices indicates abnormal behavior. Diagnose and adjust the operation of the scanner. The cable end temperature limit switch disables power to the cabinet subsystems in case of temperatures exceeding 65 °C (149 °F) at the switch location. - Page 47 SCANNER SAFETY AND LOCAL CONTROLS Note that laser radiation status is not included in the operation of these indicators. ATTENTION All indicators use redundant PCB mounted LEDs with feedback to allow confirmation of proper operation back to the supervisory system for diagnostic alarms. Indicators on the head are not sensor-specific.
- Page 48 SCANNER SAFETY AND LOCAL CONTROLS ash sensor will only light up when the shutter is open during scanning and standardize (see Figure 47). The basis weight sensor nuclear source cannot be turned off but its shutter action can be specifically disabled with user panel. X-ray Power Enabled On User Panel Fig.
- Page 49 SCANNER SAFETY AND LOCAL CONTROLS The shutter status safety indicators on the measuring heads provide a second, 360-degree indicator set if the user is working inside the scanner frame and cannot see the endbell user panel status lights. If the indicators are glowing green, the shutters are closed and it is safe approach the heads.
- Page 50 SCANNER SAFETY AND LOCAL CONTROLS When the keyswitch is turned off, the yellow indicator is not lit, and sensors associated with that hazard type are not enabled when the icon/button is pressed. Purpose: The sensor key lock allows for LOTO of sensors, enabling safe work to be conducted near the scanner head and sensors in accordance with safety regulations.
- Page 51 SCANNER SAFETY AND LOCAL CONTROLS switch output is connected to a digital input on an alley EDAQ PCB, and is reported to the rest of the control system for interlocking purposes. Purpose: If the upper head does not completely cover the lower head, radiation from sources is not properly captured and poses a hazard.
- Page 52 SCANNER SAFETY AND LOCAL CONTROLS 2.3.3.8 Source to receiver communication pairing Description: A software algorithm that detects communication failure between electronic devices in the radiation safety chain. Purpose: Due to the distributed computing nature of the scanner EDAQ architecture, radiation safety tasks are controlled by separate EDAQ boards.
-
Page 53: Operators Controls And Indicators
SCANNER SAFETY AND LOCAL CONTROLS Operators Controls and Indicators 2.4.1 Scanner user panel and radiation warning indicators Two scanner user panels are provided, one located at each end of the beam (see Figure 51). Scanner User Panel Fig. 51. The primary functions of the panel are: •... - Page 54 SCANNER SAFETY AND LOCAL CONTROLS Hazards Table. 9. Radiation hazard: nuclear and X-ray sources. The shutter or power functions of these sources are able to be overridden and locked out, via a keyswitch, for extra safety during maintenance activities. The top row of sensor enables buttons include radiation shutter status indicators.
- Page 55 SCANNER SAFETY AND LOCAL CONTROLS Symbol Description Warnings Radiation safety warning icon Main red and green shutter status indicators Nuclear sensor keyswitch indicator Laser eye safety warning icon Laser sensor keyswitch indicator Sensors on this row contact the sheet when enabled caution icon Head split enable caution indicator and icon Sensors Basis weight sensor enable button/indicator...
- Page 56 If the sensor is not configured in the Experion MX software, the button does not react at all. To disable a sensor through the user panel, press the sensor icon to send a command to the control system (the border light will turn off).
- Page 57 SCANNER SAFETY AND LOCAL CONTROLS 2.5.1.3 Head Split Figure 53 shows the head split keyswitch. Key Switches Fig. 53. The keyswitch on the lower row is used to enable the head split function. When the key is activated, a head split request is processed by the FC and by the upper alley EDAQ. Activation of the head split mechanism air cylinder is done only if all radiation and motor safety conditions are met.
- Page 58 SCANNER SAFETY AND LOCAL CONTROLS The three buttons/indicators to the right of the head split switch control the scanner movement. The scan and offsheet buttons are used to enable the scanning process as well as to move the scanner in manual mode (scan moves forward towards the distant end, and offsheet moves the head towards the cable end).
- Page 59 SCANNER SAFETY AND LOCAL CONTROLS Scanner User Panel Status Messages Table. 11. Panel Indicator Status Scanner Function Scan Single Offsheet Point Communications between RAE and MSS not established. Flashing During scan mode, background or standardize is being collected. The heads may be in the process of moving to one of the reference positions, or collecting data at a given reference position.
- Page 60 SCANNER SAFETY AND LOCAL CONTROLS Panel Indicator Status Scanner Function Flashing Off sheet mode action not complete. Scanner is in offsheet mode, going to the offsheet position Scanner is in sheet break mode. Sheet break detected while scanning. Press the offsheet or scan button.
- Page 61 SCANNER SAFETY AND LOCAL CONTROLS QCS Alarms Linked to Offsheet Indicator Flashing Table. 12. Sheet Break Sheet Break Scanner Stop Button Lump Detection More information can also be obtained by using the MSS Diagnostics Summary display (see Table 13). 6510020335...
- Page 62 SCANNER SAFETY AND LOCAL CONTROLS MSS Information Linked to Offsheet Indicator Flashing Table. 13. Condition MSS Summary Display Information (flashing offsheet lamp only) Sheet break /scanner 1/mss/sensor manager/job set/alarm condition found Frame In Break Mode To Clear Press Off Sheet or Scan SCANNER /scanner 1/mss/position control/job set/frame controller/what’s wrong status/what’s wrong info STOP...
- Page 63 SCANNER SAFETY AND LOCAL CONTROLS Scanner User Panel (red: shutter open, radiation indicators active) Fig. 55. This arrangement of indicators provides the highest visibility to personnel approaching the scanner and performing tasks on or close to the scanner heads. The top row sensor controls include radiation shutter indicators associated with the state of the radiation sensors.
- Page 64 SCANNER SAFETY AND LOCAL CONTROLS Scanner Heads (red: shutter open, radiation indicators active) Fig. 56. The green radiation lights are driven by a series electrical circuit that runs through all green light indicators and radiation shutter microswitches in both heads and scanner user panels.
- Page 65 SCANNER SAFETY AND LOCAL CONTROLS Radiation Shutter Status Indicator Summary Table. 14. Radiation Light Status System Status Green Not a normal operating condition, assume shutter(s) may be open Troubleshoot green light circuit to ensure no shutters are open Occurs when there is no power to the scanner or heads Any of the nuclear or X-ray shutters have been commanded to open, and at least one shutter has opened to interrupt the green light circuit.
-
Page 66: Scanner Stop Push Button
SCANNER SAFETY AND LOCAL CONTROLS 2.4.2 Scanner Stop Push Button A yellow SCANNER STOP push button is located on the door at each end of the scanner (see Figure 57). SCANNER STOP push button Fig. 57. If this button is pressed, the enable signal to the motor controller is instantly cut off, and the scanner heads stop. -
Page 67: Misalignment Of The Upper And Lower Heads
SCANNER SAFETY AND LOCAL CONTROLS For additional safety, when working on drive components, the motor drive power can be disabled through the corresponding circuit breaker. This three-level movement protection implementation ensures that scanner heads will not move without user input. The SCANNER STOP push buttons are connected in series, and are separated from any of the other scanner beam switches. -
Page 68: Head Movement Monitoring And Control
SCANNER SAFETY AND LOCAL CONTROLS Head Movement Monitoring and Control The scanner is equipped with various switches that monitor and control head movement. Table 15 lists and describes the switches. Head Movement Monitoring and Control Switches Table. 15. Switch Function Preset Provides a permanent fixed reference to the motor controller software to monitor the head position relative to encoder counts. -
Page 69: Preset Switch
SCANNER SAFETY AND LOCAL CONTROLS Motion Control Switch Locations Fig. 59. 2.5.1 Preset Switch The preset switch provides a reference position to the FC when the head scans. The preset switch is located approximately mid-scanner on the upper track. When the heads pass, the preset switch is activated with a magnet in the head carriage, and a digital signal is sent to the FC input in the cable end. -
Page 70: Scanner Crash And Forward/Reverse Limit Switches
SCANNER SAFETY AND LOCAL CONTROLS • A thermal switch and temperature reporting of air wipe heater. • a thermal switch in the lower left corner of the cable end cabinet (see Figure 60) Thermal Switch Fig. 60. Purpose: These devices are intended to protect equipment and sensors only in case of unintended extreme conditions. -
Page 71: Getting Started
Gloss • An Experion MX server computer • Operator station(s). For small systems, the Experion MX server may also act as an Operator station • An interface to an Input/Output (I/O) subsystem such as a distributed control system (DCS) or programmable logic controller (PLC). I/O is required if the system is controlling process loops such as stock flow, steam pressure, dye flows •... -
Page 72: Scanners
The Experion MX O-Frame Scanner Model Q4000-80 is a Honeywell scanner that is controlled by the Experion MX System. Sensors are in the upper and lower scanner heads, which traverse the sheet. -
Page 73: Moisture
GETTING STARTED A beta radiation source, located in the lower head of the scanner, emits a stream of high- speed electrons called beta particles. As the particles pass through the sheet, the fibers absorb some of them. A receiver in the upper head collects those particles that pass through the sheet. -
Page 74: Ash
GETTING STARTED 3.4.5 Provides online ash measurement of the paper. How It Works: The measurement operates on the principle of preferential X-ray absorption, in conjunction with basis weight and moisture measurements. 3.4.6 Formation Provides measurements of size and distribution of flocs. How It Works: The formation sensor measures characteristics of sheet formation by analyzing fluctuations in a transmitted light beam caused by movement of the sheet past the beam. -
Page 75: Air Gap Temperature
Operator stations appear as desktop stations, for clean environments, or the Environmental Operator Station, for harsher environments. These stations provide the operator interface between the Experion MX System and the process line. The operator station includes a monitor (touch screen optional), a pointing device (mouse), and a keyboard. -
Page 76: Experion Mx Rae Station Layout
HMI (Human Machine Interface) for use with Honeywell’s new Experion PKS (Process Knowledge System). In Experion MX RAE station you can access all QCS displays. For more information on the process displays and their description see section Process Information Displays. -
Page 77: Toolbar
EXPERION MX RAE STATION LAYOUT Toolbar The buttons on the Toolbar allow you to quickly view important QCS pop-up displays and control the scanners. The default configuration provides you with large buttons for touch- screen usage, and for easy access to important pop-up displays and controls. -
Page 78: Qcs System Setup And Debug
EXPERION MX RAE STATION LAYOUT Button Description Group – Call up the group display for the selected object. If there is no associated group display, this button invokes the group command and requires a group number to be entered. Trend – Call up the trend display for the selected object. If there is no associated group display, this button invokes the trend command and requires a trend number to be entered. - Page 79 EXPERION MX RAE STATION LAYOUT access rights of the present Station operator. Figure 63 shows this popup as it would appear for a Station user with Operator access rights. Click button to open System setup & debug pop up as shown below.
-
Page 80: Mini Profile And Mini-Trend
EXPERION MX RAE STATION LAYOUT Button/Field Description Opens a standard Windows calculator for making any necessary Calculator hand calculations Close Use this button to close the popup. 4.2.2 Mini Profile and Mini-Trend The mini-trend and mini-profile popup can be opened at any time in order to keep track of the process while performing other duties on the operator station. -
Page 81: Recipe Synonyms
EXPERION MX RAE STATION LAYOUT 4.2.3 Recipe Synonyms There are various terms that may be used interchangeably with “Recipe”. These include “Recipes”, and "Codes". Any one of these may be used and will appear in the software text. For simplicity, we will use "Recipe" throughout this documentation. - Page 82 EXPERION MX RAE STATION LAYOUT Click OK. When a new recipe is selected all recipe setpoints stored in the database are immediately loaded as target values. If the Supervisory loops (Controlled Variables such as Reel Weight and Reel Moisture) are in control, speed, steam, and stock flow moves immediately to achieve the new CV setpoints.
-
Page 83: Scanner Control
EXPERION MX RAE STATION LAYOUT Recipe Select Dialog Box – Color Code Fig. 67. 4.2.4 Scanner Control The Scanner Control button is used to access the Scanner Control display. Scanner Control Display Fig. 68. 6510020335... -
Page 84: Scan
EXPERION MX RAE STATION LAYOUT During normal scanning of the product throughout the shift, the scanner stops periodically and standardizes. This function verifies sensor accuracy. At least once every 24 hours the scanner performs a background check that allows the sensor to measure the background... -
Page 85: Offsheet
The current Product or Grade that the line is producing is displayed in this field. Click on Current Product or Recipe Code to open Simple Recipe Change Pop-up. 3. Current Color Code: The current color code that the Experion MX is using to control the dye flows is displayed in this field. 6510020335... - Page 86 EXPERION MX RAE STATION LAYOUT Click on Current Color Code to open Simple Recipe Change Pop-up. 4. Scanner Modes: The status of the scanners is shown in the Application Status Zone of every display. In multiple scanner systems, scanner number 1 is the closest to the wet end. Scanner number 2 is the second closest to the wet end, and so on.
-
Page 87: Navigation Bar
EXPERION MX RAE STATION LAYOUT 5. System Status Messages: The status field to the right of the radiation icon provides a prioritized list of QCS status information. Various status messages and system events (for example, sheet breaks) are given here. You can click on the button at the right corner of this status line ) to display the complete list of QCS Status messages. - Page 88 EXPERION MX RAE STATION LAYOUT clicking on Navigation Bar button. The button corresponding to the active display is highlighted if present in that navigation category. Horizontal Navigation Bar Fig. 71. You can select other navigation categories by clicking the up arrow at the right end of the Navigation Bar.
-
Page 89: Status Line
EXPERION MX RAE STATION LAYOUT Status line Status Line Fig. 73. The Status Zone provides you with an overview of the system status. Table 5: Status Line Fields Field Description Date Shows the current date as set on the server. -
Page 90: Monitoring
MONITORING Monitoring Overview This chapter describes alarm types, how to acknowledge alarms, and how to change alarm displays. Alarm Displays An alarm is generated whenever an abnormal condition occurs. For example, when the measurement value is above or below the acceptable range. Alarms, are also generated when an important event occurs, such as a communications failure. -
Page 91: Alarm Line Items
MONITORING Alarm Summary Display Fig. 74. The Alarm Summary is a ring buffer that can hold up to 1000 alarms. The list can be scrolled using the vertical scroll bar on the right side of the display. 5.2.2 Alarm Line Items Table 16 describes the default alarm line items. - Page 92 MONITORING Alarm Summary Display Table. 16. Alarm Line Item Description Red and flashing: the alarm is urgent priority, unacknowledged and the cause of the alarm still exists. Red and not flashing: the alarm is urgent priority, acknowledged, and the cause of the alarm still exists. Inverse color and flashing: the alarm is urgent priority, unacknowledged, and the cause that generated the alarm no longer exists.
-
Page 93: Acknowledging Alarms
MONITORING Alarm Line Item Description If the point ID is too long to be fully displayed in the alarm summary, it is truncated. To see the full name, hover the mouse pointer over the partial point ID to display the full point ID. Condition The condition of the alarm. -
Page 94: Associated Display
MONITORING Your Objective Description Click the Acknowledge Page button on the lower right-hand corner of the display. Acknowledge all alarms currently Note that if there are any more unacknowledged visible on the Alarm summary alarms in the list, you must first display them before clicking the Acknowledge Page button again. - Page 95 MONITORING An easy way to filter the summary is to perform a (Like Currently Selected) filter. For example, if you want to see all alarms for a particular point, select any alarm for the particular point, click the Source column and select (Like Currently Selected). The Alarm Summary is filtered to show all alarms in the summary that match the source of the currently selected alarm.
- Page 96 MONITORING Filtering the Alarm Summary To filter the alarm summary, do the following: Call the Alarm Summary display. Click the column heading you want to filter by. Select the filter you want to apply. Example Scenario: You want to filter the Alarm Summary so that you see unacknowledged alarms of high priority only.
-
Page 97: Using Views
MONITORING 5.3.2 Using Views View Menu Fig. 77. You can change the way the information is displayed in the Alarm Summary by applying a different view. A view contains the information about filtering and sorting, which alarm line items are shown, the order they are shown in, and the space provided for each item. There are several predefined views. -
Page 98: Using The Location Pane
MONITORING • (urgent priority alarms). Shows only urgent alarms. There can also be other views that have been configured for your system. To apply a view: Click the view list. Select the desired view from the list. 5.3.3 Using the Location Pane Location Pane Fig. -
Page 99: Using The Details Pane
MONITORING • Click the Show Location pane icon • Click the Location list and click the Push Pin to dock the area pane. To hide the area pane: • Click the Hide location Pane icon to close the location pane. 5.3.4 Using the Details Pane The Details pane shows the details of the currently selected alarm. -
Page 100: Reel Display
MONITORING The report engine allows you to accumulate variables for management information summaries (MIS). There are four ready-made displays: • Reel Display • Grade Display • Shift Display • Day Display These reports may be printed in hard copy form by selecting a print option. 5.4.1 Reel Display The Reel Display provides the Reel Production and Quality Report. -
Page 101: Grade Display
MONITORING Reel Display Fig. 79. 5.4.2 Grade Display The grade display looks like the reel display. It displays the current grade data and last grade with no historian feature. The “print” button will make a multi-page report for the current grade, at the current time. A typical grade display is shown in figure 80. 6510020335... -
Page 102: Shift And Day Display
MONITORING Grade Display Fig. 80. 5.4.3 Shift and Day Display Shift Production and Quality Report The shift production display is also a fixed format display. A typical display looks like that in Figure 81. 6510020335... - Page 103 MONITORING Shift Production and Quality Summary Fig. 81. Figure 82 which consists of the Shift Production Summary and the Quality Summary. It has almost the same format as the Reel production summary. The items eliminated by the Reel Production Summary automatically carry over to this display. 6510020335...
- Page 104 MONITORING Shift Production Display Fig. 82. Day Production and Quality Report The day production display is also a fixed format display. A typical display looks like that in Figure 83. 6510020335...
- Page 105 MONITORING Day Production and Quality Summary Fig. 83. Figure 84. The Day Production Summary has almost the same format as the Reel Production Summary. The items eliminated by the Reel Production Summary automatically carry over to this display. 6510020335...
-
Page 106: Printed Reports
MONITORING Day Production and Quality Report Fig. 84. Printed Reports At the end of each reel, each shift, each day, and recipe run, a printed report is available to print. By selecting the “Print reports?” option in general setup, the reports will be printed automatically. -
Page 107: Reel Report
MONITORING 5.5.1 Reel Report For each reel, there can be “n” number of pages. The first page is production related and the rest of the pages are quality related. Refer to Figure 85 for a printed Reel Report. Reel Report Print Fig. -
Page 108: Grade Report
MONITORING 5.5.2 Grade Report For each grade run (recipe end), there can be multiple pages of report. The first page is production related and the rest of the pages are quality related. Refer to Figure 86 for a printed Grade Report. Grade Report Print Fig. -
Page 109: Shift Report
MONITORING 5.5.3 Shift Report For each shift, there can be multiple pages of report. The first page is production related and the rest of the pages are for shift recaps. The Shift Production Report is about the same as the Shift Production Display. Refer to Figure 87 for a printed Shift Production Report. -
Page 110: Day Report
MONITORING 5.5.4 Day Report Each day, there can be multiple pages of report. The first page is production related and the rest of the pages are for day recaps. The Daily Report is about the same as the Day Production Display. Refer to Figure 88 for a printed Day Production Report. -
Page 111: Process Information Displays
PROCESS INFORMATION DISPLAYS Process Information Displays Overview This chapter provides description about the process information displays. The process information displays contain information about the process only, and no control of the process is possible through these displays. The process information displays can be found in the Favorite and Standard Categories. -
Page 112: Advanced Color Map
PROCESS INFORMATION DISPLAYS Advanced Color Map The Advanced Color Map display shows fifty sets of data in a 2-dimensional plot using colors to indicate the amplitude of the data. This is typically used to analyze a series of profile arrays from scanning sensors; although this can be used to plot any array data in the database. -
Page 113: 3D Selection Dropdown
PROCESS INFORMATION DISPLAYS 6.2.1 2D/3D Selection Dropdown 2D / 3D selection dropdown defines how values are rendered to the color grid. When 2D is selected, then color grid shows the values in 2-dimensional plot area. Refer to Figure 95. When 3D is selected, then values are shown as a waterfall. Refer to Figure 90. 3D - Advanced Color Map Fig. -
Page 114: Measure Selection
PROCESS INFORMATION DISPLAYS 6.2.2 Measure Selection When you click on the measurement selection button to see the variables. , the Select Array Variables popup appears. You can select the required variables from this popup. Select Array Variable Fig. 91. 6.2.3 Scale Each variable can be provided its own scale or can be scaled automatically. -
Page 115: Graphs
PROCESS INFORMATION DISPLAYS 6.2.4 Graphs When you click on the Graph button , it opens the Graph Selection dialog box, where user can select the additional statistical data graphs and the previous graph. Graph Selection Fig. 93. 6.2.5 Allow New Data display updates whenever new data become available. -
Page 116: Color Indicator
PROCESS INFORMATION DISPLAYS To enter the time in the QCS History dialog box, perform the following: Click icon The QCS History Selection dialog box appears. If only the Start Time check box is selected, then data is retrieved from start time to current time. -
Page 117: Data Display
PROCESS INFORMATION DISPLAYS Color Indicator Fig. 95. Data Display When you press the Data display button on the Navigation Bar, the following screen is displayed. Data Display Fig. 96. The Data Display is a simple display for viewing or changing system data. What data is displayed on this screen is determined by what kind of system you have and how the screen has been setup. - Page 118 PROCESS INFORMATION DISPLAYS The third cell column contains units. You may choose from one of four Sets of data by selecting the drop-down menu in the upper left hand corner of the display. Additionally, you can change the value of the cell, if the cell is configured as writable. However, you can enter value between the upper limit and lower limit which is configured through the setup popup.
- Page 119 PROCESS INFORMATION DISPLAYS A Trend Set is a collection of four user-specified trends, you can define up to 20 Trend Set. Trend Sets are stored in the local node, and is unique for each Operator Station. Towards the top left of the display is a dropdown NOTE list box , which is used to select the Trend Set to...
-
Page 120: Limit Alert Display
PROCESS INFORMATION DISPLAYS Alpha Numeric Selection popup (Keyboard popup) Fig. 98. • If the variable is of Boolean type, when you click the value cell then Dropdown Selection pop up appears, through which you can edit the cell. Additionally, you may enlarge the first four items of either set by selecting the Enlarged check box. -
Page 121: Production Data Display
PROCESS INFORMATION DISPLAYS Limit Alert Display Fig. 100. Production Data Display Production Data button Fig. 101. The Production Data display provides a consolidation of useful information about the process. A primary measurement profile is displayed along with the current values for selected process measurements and calculations. - Page 122 PROCESS INFORMATION DISPLAYS Production Data Display Fig. 102. The Production Data display is primarily an operator information display. It has two sections: • Production Data table (top section): This is a data area for several process measurements and calculations. This table displays a maximum of 28 production data values of different measurements into two sections of 14 each, separated by blank column.
-
Page 123: Profile Display
PROCESS INFORMATION DISPLAYS Profile Display Profile Display Button Fig. 103. The Profile display shows up to three profiles of the primary scanning parameters on one display. Each profile shows the CD variations for the selected variable. The vertical axis represents the value of the variable being measured or monitored. The RED horizontal lines on the graph are the LIMITS set in the recipe (Refer to Figure 104). - Page 124 PROCESS INFORMATION DISPLAYS Profile Display Fig. 105. 6510020335...
-
Page 125: Profile Selection
PROCESS INFORMATION DISPLAYS Data Section Description: Below table describes each field in the data section. Field Description Bin Number indicates to the where the cursor is pointing. Max is the maximum value of the data for the displayed variable, including the data not shown when zoomed in. If this maximum value exceeds the limit, it is displayed in red on black. - Page 126 PROCESS INFORMATION DISPLAYS The profile selection drop-down list can be used to select any profile defined in the system. To select a new profile, click on the drop-down arrow and then select the desired profile. A new profile may also be selected with the Profile Selection button that is just to the right of the drop-down list.
-
Page 127: Profile Status
PROCESS INFORMATION DISPLAYS A pop-up dialog box appears. Highlight the array type required. Select the type of data by clicking on the Select Type area. A pop-up dialog box appears. Highlight the type of data you require. There are several types. When the selection has been made, click OK to activate. -
Page 128: Profile Magnification
PROCESS INFORMATION DISPLAYS This feature allows you to manually set the range of the profile so that it fits in the area provided. To activate, click the button and the Profile Scale Setup dialog box appears This dialog box may look different in your view. The buttons and fields may have slightly different names. -
Page 129: Freeze Button
PROCESS INFORMATION DISPLAYS Zoom In button Fig. 109. The Zoom Out button decreases the magnification of the profile. Minimum magnification is the entire sheet width. Zoom Out button Fig. 110. To activate: Drag the yellow cursor to the position across the profile to be examined in more detail. -
Page 130: Cursor
PROCESS INFORMATION DISPLAYS 6.6.6 Cursor The cursor, provided on each profile, may be used to display the profile value of any point. Select the cursor by clicking on the vertical yellow line and dragging this line (the cursor) to any point on the profile. The cursor value box displays the profile value at the cursor location. -
Page 131: Set Selection
PROCESS INFORMATION DISPLAYS Spread is the n sigma spread of the data for the displayed variable, including the data not shown when zoomed in. n is the sigma multiplier as set through the System Setup & Debug pop-up display, typically 2. Average is the average value of the data for the displayed variable, including the data not shown when zoomed in. -
Page 132: Measurement And Quality Information
PROCESS INFORMATION DISPLAYS Quality Summary Display Fig. 115. • On the quality control summary display, click on Wet End to opens Scanner Control page. NOTE • Click on the list in the measurement field opens Mini Profile of the specific measurement. For example: Basis Weight Trend and Moisture Trend. - Page 133 PROCESS INFORMATION DISPLAYS next time the recipe is loaded, this value is set to the new value. The current value can also be changed through the Measurement Setup display and then either stored to permanents or to the recipe. Setpoint If the measurement is a directly controlled measurement, the setpoint is displayed.
-
Page 134: Scanner Status Information
PROCESS INFORMATION DISPLAYS 6.7.2 Scanner Status Information The scanner status information section lists the scanners and the current status of the scanner. If the scanner is in single point mode or fixed-point mode, the scanner head position is also displayed. Scanner Sensor Status Information Fig. -
Page 135: Trend Plot Display
PROCESS INFORMATION DISPLAYS • Offline (Local Offsheet): Scanner is in local offsheet mode and can only be scanned by pressing Scan at the scanner. This mode allows the scanner to be taken offsheet for a maintenance operation where the scanner can’t be scanned without first checking the condition at the scanner. - Page 136 PROCESS INFORMATION DISPLAYS Up to four trend variables at a time can be viewed on the trend display. The four variables in a set are differentiated by color on the graph. Variables can be trended at a rate or at an event.
- Page 137 PROCESS INFORMATION DISPLAYS Button/Icons Description Trend Set Selection Dropdown: Trend set is the collection of four user defined trends. Display Style: User can select up to 4 display type Now Value/ Cursor Dropdown: The cursor button is used to view and hide the trend cursor.
-
Page 138: Trend Variable Menu
PROCESS INFORMATION DISPLAYS 6.8.1 Trend Variable Menu Select the Variable Select button at the top of the display and a menu appears showing the trend variables to choose from. The variable name is shown on the buttons on the Trend Variable Menu. The most recent value for the variable is shown directly below the button. -
Page 139: Trend Graph And Data
PROCESS INFORMATION DISPLAYS 6.8.2 Trend Graph and Data Trend Graph and Data Fig. 120. Graph Data and Controls The Graph Data and Controls show data for graph and allow setting of the graph parameters. Graph Data and Controls Fig. 121. •... -
Page 140: Trend Display Control
PROCESS INFORMATION DISPLAYS • Min Button: Use this feature to automatically position the cursor at position with the minimum value. To update the maximum scale, enter the number you require using the numeric keypad and then click on ENTER MAX. The value appears in the Enter Max box. ... - Page 141 PROCESS INFORMATION DISPLAYS Click the Sort List check box to sort the measurement list in alphabetical order and vice versa. Graph Layout Selector The Graph Layout Selector controls the how the variables are graphed with respect to each other. Graph Layout Selector Fig.
-
Page 142: Recipe Change Display
PROCESS INFORMATION DISPLAYS Display Range You can change the time range of the trend plot(s) by selecting the Display Range numeric entry field Display range Fig. 125. This brings up a numeric panel. Enter the time range you want to display in minutes and press [ENTER]. - Page 143 PROCESS INFORMATION DISPLAYS Recipe Change Display Fig. 129. Fields Description Current Recipe, Current Allows you to select the recipe that is used currently and Recipe ID and Next Recipe the recipe that will be used next. Current Setpoint, Process 1. The Recipe-dependent target parameters for the and Next Setpoint current recipe are displayed in the “Current Setpoint”...
-
Page 144: Selecting The Next Recipe
PROCESS INFORMATION DISPLAYS Fields Description Recipe List Displays all the recipes that have already been established Recipe Start / Recipe End 1. When you press the “Recipe Start” button then any information that the scanner collects about your process is used in the statistical and MIS reports. -
Page 145: 6.10 Multi Profile Display
PROCESS INFORMATION DISPLAYS Once you are ready to start collecting report information about the product that you are currently making, press the Recipe Start button. The display message changes to Recipe Start and accumulations for this product begin. 6.10 Multi Profile Display The Multiple Profiles display allows operators to view four profiles in a single graph. -
Page 146: Profile Selection
PROCESS INFORMATION DISPLAYS 6.10.1 Profile Selection There are four profile selection buttons for each profile. When you click on the profile variable button, a popup dialog box appears, highlighting various variables to choose. The display is updated with the selected profile and the associated data. If there is only one production line available, then Production Line dropdown menu is disabled. -
Page 147: Scale Information
PROCESS INFORMATION DISPLAYS Profile Type Description Average is the average value of the data for the displayed variable, which includes the data that is not shown when zoomed in. If the variable is Average being displayed around average, a green arrow is shown to the right of the label. -
Page 148: Setup
PROCESS INFORMATION DISPLAYS Following are the options that you can see in the Scale: AutoScale – When you select AutoScale it enables the profile component to use the currently-selected AutoScale algorithm to scale the profile. Range – When you click the range, the popup allows the user to enter minimum and maximum values for the y-axis range on the profile. -
Page 149: Units
PROCESS INFORMATION DISPLAYS 6.10.5 Units The Units combo box allows you to change the units. 6.10.6 Profile Magnification The Zoom In button magnifies the profile and the Zoom Out button decreases the magnification of the profile. 6.10.7 Cursor You can use the cursor, provided on graph, to display the profile value of any point. Select the cursor by clicking on the vertical yellow line and dragging the line (the cursor) to any point on the profile. -
Page 150: Profile Selection
PROCESS INFORMATION DISPLAYS High Resolution Profile Display Fig. 135. 6.11.1 Profile Selection When you click the profile variable button a popup dialog box appears, highlighting the various variables to choose. The display is then updated with the selected profile and the associated data. -
Page 151: Freeze Button
PROCESS INFORMATION DISPLAYS Indicator Description Indicates the data is both within limits and is not stale. Indicates the scanner has not yet scanned sufficient scans, usually two scans. Indicates the data is either out of limits or is stale. Stale means that the data has not been updated within the timeout period defined by the setup display 6.11.3... -
Page 152: Cursor
PROCESS INFORMATION DISPLAYS 6.11.5 Cursor The cursor, provided on each profile, can be used to display the profile value of any point. Select the cursor by clicking on the vertical yellow line and dragging this line (the cursor) to any point on the profile. Cursor Fig. -
Page 153: 6.12 Multi Fixed Point Display
PROCESS INFORMATION DISPLAYS 6.12 Multi Fixed Point Display The Multi Fixed Point display combines a single standard Trend plot graph with a single Fixed Point graph. Multi Fixed Point Display Fig. 141. 6.12.1 Fixed Point This graph displays the magnitude of the selected variable on a defined time range. Variables for which the fixed point measurements have been defined are available in this graph. - Page 154 PROCESS INFORMATION DISPLAYS The Measurement and Selection is used to select the measurement. In the Measurement Selection popup, you can select the available production line and this option is enabled only when there is more than one production line. Measurement Selection Fig.
-
Page 155: 6.13 Trend And Fixed Point
PROCESS INFORMATION DISPLAYS Using the Set selection drop-down, you can select a set, which is shown in the display. A set describes the collection of three fixed point profiles that are brought up on the display when a set is selected from the combo box list. Set Selection drop-down Fig. - Page 156 PROCESS INFORMATION DISPLAYS Fixed Point graph: This graph displays the magnitude of the selected variable on a defined time range. Variables for which the fixed point measurements have been defined are available for display in this graph. Data in this graph is updated only when the scanners are in fixed point mode.
-
Page 157: Appendixa
PROCESS INFORMATION DISPLAYS Appendix A Read this section to understand the scanner safety and local controls of Precision Platform 4000-01 Scanners. This section also gives you brief understanding of operator controls and indicators. System Overview Features and Benefits of Precision Platform 4000-01 scanners The Precision Platform 4000-01 series scanners include a four- or six-sensor PrecisionPak sensor enclosure and either an integrated Precision Measurement Processor (PMP), a remote PMP, or a direct interface to existing MXOpen systems, depending on the... - Page 158 PROCESS INFORMATION DISPLAYS • Power tracks to carry the power, air, and coolant to the heads, and the sensor measurement data to the PMP • A Precision Measurement Processor (PMP), either mounted to the scanner (4000-01 model) or set up remotely (4000- 21 model) including: ...
- Page 159 PROCESS INFORMATION DISPLAYS Precision Platform 4000-01 Scanner Fig. 148. 6510020335...
- Page 160 PROCESS INFORMATION DISPLAYS Precision Platform 4000-20/21 Scanner Fig. 149. 6510020335...
-
Page 161: Local Scanner Controls
PROCESS INFORMATION DISPLAYS Local Scanner Controls This section highlights the local controls for a 4000-series style of scanner. Similar controls for other scanners exist. Refer to the specific scanner manual for details. The scanner control panel is typically on the tending side of the frame (see Figure 150) and permits individual local scanner control. - Page 162 PROCESS INFORMATION DISPLAYS Scanner Control Panel Buttons Table. 17. Button/Switch Mode/Position Function ON - Computer Starts scanning. Mode Scan ON – Manual Mode Starts scanning toward the motor end support. ON - Computer Closes all sensor shutters, disables sensors, Mode and sends the heads off-sheet at a faster rate (by signaling the motor controller) and takes the heads off line.
-
Page 163: Emergency Stop Button
PROCESS INFORMATION DISPLAYS Button/Switch Mode/Position Function EMERGENCY Turns off power to the ash sensor, which in turn sends the heads off sheet. The local control buttons always take precedence over the scanner control buttons on any PC-based operator station. Therefore, if a scanner is taken offsheet at the scanner, it cannot be restarted from any other location. -
Page 164: Scanner Crash Switch
PROCESS INFORMATION DISPLAYS Model 4000 Series Scanner Control Buttons Fig. 151. The switches located below the main power switch are used for sensor calibration and maintenance (Figure 151). These controls are restricted to qualified maintenance personnel. Scanner Crash Switch Scanners are equipped with four crash switches, one of which is located at each end on the upper and lower cross beam of the scanner frame as shown in Figure 152. -
Page 165: Motor Torque
PROCESS INFORMATION DISPLAYS SCANNER UPPER BEAM SUPPORT CRASH SWITCH UPPER SENSOR HEAD Scanner Crash Switch Fig. 152. The crash switch is concealed under the beam covers of the scanner frame. It is not visible from the outside of the scanner frame. By reaching your fingers under the cover, you can feel the mechanism. -
Page 166: Scanner Troubleshooting
If the scanner is taken offsheet at the scanner with the scanner control buttons, the scanner status on the Experion MX operator station is offline and not offsheet – scanning must be initiated at the scanner again with the scanner control buttons. -
Page 167: Glossary
The Cross Direction is transverse to the MD (Machine Direction) that relates to a position along the length of the paper machine. Experion MX The name for Honeywell’s latest QCS system. Distributed Control System Deutsches Institut für Normung E.V. - Page 168 Documentation feedback You can find the most up-to-date documents on the Honeywell Process Solutions support website at: http://www.honeywellprocess.com/support If you have comments about Honeywell Process Solutions documentation, send your feedback to: hpsdocs@honeywell.com...
- Page 169 Honeywell investigates all reports of security vulnerabilities affecting Honeywell products and services. To report a potential security vulnerability against any Honeywell product, please follow the instructions at: https://honeywell.com/pages/vulnerabilityreporting.aspx Submit the requested information to Honeywell using one of the following methods: •...
- Page 170 Honeywell Process Solutions 1250 W Sam Houston Pkwy S #150, Houston, TX 77042 Honeywell House, Skimped Hill Lane Bracknell, Berkshire, RG12 1EB Building #1, 555 Huanke Road, Zhangjiang Hi-Tech Park, 6510020335 Pudong New Area, Shanghai, China 201203 May 2019 www.honeywellprocess.com...