
Summary of Contents for NEO PQA8000
- Page 1 USER MANUAL V1.9 www.neo-messtechnik.com NEO Messtechnik GmbH Sonnweg 4, A-2871 Zöbern Austria +43 2642 20 301 @ NEO Messtechnik GmbH. All rights reserved. Page 1 of 76...
- Page 2 Subject to change without notice. NOTE: NEO Messtechnik GmbH. shall not be liable for any errors contained in this document. NEO Messtechnik MAKES NO WARRANTIES OF ANY KIND WITH REGARD TO THIS DOCUMENT, WHETHER EXPRESS OR IMPLIED.
-
Page 3: Table Of Contents
Table of Contents Introduction........................5 Safety Information ......................7 General Safety ......................7 Battery Handling ...................... 9 Warranty ........................10 Recycling .......................10 CE Conformity ......................10 RoHS ........................10 Hardware ........................11 Instrument ......................11 Power ON/OFF Switch ...................12 Connector Pins .......................12 3.3.1 Voltage Inputs ....................13 3.3.2 Current Inputs ....................13 3.3.3... - Page 4 Automatic Report Generator ................66 4.6.8 Data Analysis on PC / Copy data of instrument ..........69 Further Manuals and Links ..................70 Technical Data and Specifications ................71 PQA8000H ......................71 PQA8000 .......................72 Digital Inputs ......................73 Environment and Mechanical .................74 Page 4 of 76...
-
Page 5: Introduction
Maintenance and Care ....................75 1 Introduction This manual contains important tips on how to use the NEO Messtechnik instruments safely, properly and efficiently. Its purpose to help you to avoid danger, repair costs, and down time as well as to help maintain reliability and life of the instruments. - Page 6 High speed, high capacity SSD (2 x 256GB max.) Sunlight readable multi-touch screen LCD and HDMI port for external monitor Small and light case with rubber protection Versatile Power Quality software including analyzer, data storing, reporting Page 6 of 76...
-
Page 7: Safety Information
REMOVE POWER and do not use the product until safe operation can be verified by service-trained personnel. If necessary, return the product to NEO Messtechnik sales and service office for service and repair to ensure that safety features are maintained. - Page 8 For working on equipment under voltage use the guidelines given in EN50110. Always follow the 5 golden safety rules: 1. Always switch off. Meaning that the electrical installation must be disconnected from live parts on all poles. Block all poles of the power source for every part of the operation. Switchgear of home or factory, low voltage switch mode, the power of the machine control switch should be cut off.
-
Page 9: Battery Handling
2.2 Battery Handling Lithium-Ion rechargeable batteries require routine maintenance and care in their use and handling. Do not leave batteries unused for extended periods of time, either in the product or in storage. When a battery has been unused for 3 months, check the charge status and charge or dispose of the battery as appropriate. -
Page 10: Warranty
2.3 Warranty The warranty for the instrument is 2 years – usual operating conditions preconditioned. 2.4 Recycling This is an electronic instrument and must be recycled according to the WEEE – directive. Do not throw away. More information see: http://ec.europa.eu/environment/waste/weee/index_en.htm ... -
Page 11: Hardware
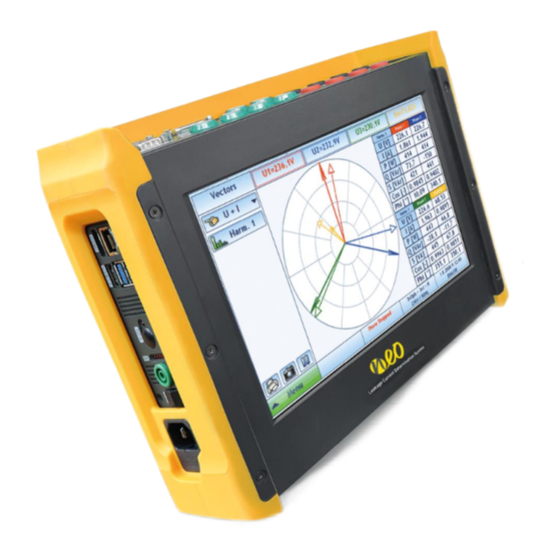
3 Hardware The PQA8000 is an All-in-one Power Quality Analyzer having the most practicable measurement and computer interface, enabling measurements and analysis as soon as sensors and cables are connected. Foer further functions like GPS synchronization or data communication like RS-485, CAN2.0B and DIO, additional cable set are available. -
Page 12: Power On/Off Switch
Power ON/OFF Switch The Power ON/OFF switch is located on the left side on the bottom and has the following three functions, depending on its position. Position Function Start (push switch) ON after start or standby Middle (returns to this position after push) OFF (MAX. -
Page 13: Voltage Inputs
For current measurement via sensors, 6 LEMO connectors are placed on the right top side of the device. These input connectors support many different kinds of sensors including TEDS - sensors. Please refer to the “Neo Technical Reference Manual” for detailed information. Page 13 of 76... - Page 14 10pin LEMO connector Current sensors like Clamps, Rogowski-coils and other current sensors can be connected using the following pin assignment. Signal PQA8000H Signal+ Signal + Signal- Signal- / GND FGND FGND Rogowski + TEDS TEDS +3.3V Isolation GND +12V Isolation +9V +15V +15V -15V...
-
Page 15: Additional Low Voltage Signal Input
3.3.3 Additional Low Voltage Signal Input DSUB-15 female connector for additional Low Voltage signal measurement The DSUB-15 connector allows connection of additional input signals. It offers three additional analog inputs, power supply of +12V, TEDS function and I2C serial interface. The third analog input (AI-2) of the DSUB-15 connector is multiplexed with the 6 LEMO input for current measurement. -
Page 16: Digital Input / Output
3.3.4 Digital Input / Output DSUB-9 Female connector for digital input and output The digital input is isolated and can measure up to +50 VDC with programmable Schmitt trigger levels. Digital output is also isolated using a PhotoMOS relay. Signal Description Isolated digital output 0 Isolated digital output 1... -
Page 17: Computer Interface
3.3.6 Computer Interface The Computer interfaces are located on the left top side One 1GB Ethernet interface, two USB3.0, one USB2.0 interfaces and one HDMI port for an external monitor. 2 x USB 3.0 HDMI Port Signal Signal TMDS data2+ Data- TMDS data2 shield Data+... -
Page 18: Antenna And Battery Indicator Led
3.3.7 Antenna and Battery indicator LED The SMA jack connector is prepared for external GPS antennas having a SMA plug type connector, and supports passive and active antennas. The GPS LED indicates the GPS status, if it is locked or not. WLAN Antenna: internal patch antenna is used. -
Page 19: Status Led
3.4 Status LED The status LED is located on the upper right side of the upper plate. LED Status Description Green Standby for measurement Green blinking Measuring (and storing) Page 19 of 76... -
Page 20: Software
4.1 Start Measurement Software After turning on the instrument, the NEO Software will automatically be started. If not, the software can be started by the shortcut “ENA Measurement Software” The number of systems can be configured at: „Setup“ – „Misc.“ – „Multisystem“. - Page 21 Overview Multisystem configuration 4U4I Standard configuration with 4x Voltage and 4x Current measurement Configuration for two different power systems 3U3I + 1U1I Example 1: 1x 3-Phase AC and 1x DC Example 2: 1x 3-Phase AC (50Hz) and 1x 1-Phase AC (16.7Hz) Configuration for two different power systems Example: 2x 3-Phase AC (same Voltage for both systems, 3U3I + 3U3I...
-
Page 22: Quick Start With A Simple Setup
4.2 Quick Start with a simple setup 4.2.1 Fundamental Frequency Setup The Fundamental frequency is set in the Setup Processing panel. You can whether navigate there via “Setup” - “Processing” or via the “Summary Panel. The Summary panel shows the current setup values of the device and is the easiest way to configure the instrument for your application. -
Page 23: Basic Wiring Setup
Select a fundamental frequency (1). After selecting the fundamental frequency, click the 'Apply' button (2). 4.2.2 Basic Wiring Setup To select a wiring type, click ‘Wiring’ button in Summary panel (1). Alternative Navigation: “Setup” – “Input” Page 23 of 76... - Page 24 The following picture shows the ‘Setup Input’ panel for the wiring setup. The Setup Input panel allows changing the input wiring, input ranges, sensors and scale factors. By changing any of these parameters the measurement is restarted. If data is currently stored, the change of these settings is disabled. ...
- Page 25 STAR (Y) Connection Select '3xUph + 3xl' in the wiring setup and connect the cables according to the picture below. Page 25 of 76...
- Page 26 STAR (Y) + N-PE Connection Select '3xUph + 3xl + N' in the wiring setup and connect the cables according to the picture below. Page 26 of 76...
- Page 27 Delta Connection Select '3xUline + 3xl ' in the wiring setup and connect the cables like below picture. Page 27 of 76...
- Page 28 Single Phase Connection Select ‘1xUph + 1xl' in the wiring setup and connect the cables like below picture. Page 28 of 76...
-
Page 29: Main Menu
4.3 Main Menu 4.3.1 Defining user and project name Navigation: “Setup” – “Profile” The Setup Profile panel allows to change the profile of the instrument. PROFILE: All instrument’s settings and setups are stored into a profile. The user can choose to create multiple profiles with different settings. -
Page 30: Data Storage
4.4 Data Storage 4.4.1 Store Data Panel Navigation: “Store” – “Time Series” The Store Data panel allows to configure the storing of calculated data. It can be set to store periodic time series data, Power Quality data and digital inputs data independently. ... - Page 31 How to setup storing Insert measurement name, description and place (2) Set storing interval and multiplier (3,4). Interval can be selected from 200ms up to 2 hours Select quantity groups that you want to store (5). Power Quality data storing and digital inputs can be configured in separated tabs.
- Page 32 Page 32 of 76...
-
Page 33: Store Events/Transients Panel
4.4.2 Store Events/Transients Panel Navigation: “Store” – “Events” The Store Events panel allows configuring storing options for capturing events. The configuration for storing alarms, transients, disturbances and voltage signals can be done independently. EN50160 events are stored automatically, if EN50160 time series storing is enabled. ... -
Page 34: Measurement
4.5 Measurement 4.5.1 FFT / Spectra Navigation: “Advanced” – “Spectra” The Spectra panel displays FFT harmonic analysis either of voltage, current, active power, reactive power or apparent power. There are four different options for visualisation: Harmonics Interharmonics Higher Frequenciese in 200Hz bands up to 9 kHz Supraharmonics in 2kHz bands up to 68kHz 1. -
Page 35: Oscilloscope
4.5.2 Oscilloscope Navigation: “Advanced” – “Scope” The Scope panel displays one period of voltage and current on all phases or instant active power p(t). The Graph can be zoomed. 1) Selection of Parameters for Scope View (Voltage, Current, Instant Power) 2) Enable/Disable Phase 1-3 and Neutral 3) Selection of Number of Periods (1 period or 5 periods) 4) Zoom Functions for X and Y axis... - Page 36 1. Displayed vectors – both or voltage only or current only 2. Selected harmonic – clicking on this button will open keyboard to insert harmonic number 3. Vector diagram 4. Additional instant values of selected harmonic 5. Selection of Delta or Star values 6.
-
Page 37: Multi-Chart
1. Select basic quantity 2. Select derived quantity 3. Select Min/Avg/Max 4. Click Add or Update button to add or change selected quantity 5. Selected quantities list 6. Name of selected quantity 7. Click OK button to apply changes 8. Click Cancel button to cancel 4.5.5 Multi-Chart Navigation: “Advanced”... -
Page 38: En50160 Analyzer
4.5.6 EN50160 Analyzer Navigation: “Advanced” – “EN50160” The EN50160 panel shows Power Quality evaluation according to EN50160 standard. It is possible to switch between the evaluation of all data and evaluation of not flagged data (data when no voltage event occurred). ... - Page 39 1. Table with count of voltage events distributed by length and level 1. Table with count of rapid voltage changes distributed by length and level 1. Table with rapid voltage changes statistics Page 39 of 76...
-
Page 40: Transient, Event And Disturbance Recorder
4.5.7 Transient, Event and Disturbance Recorder 4.5.7.1 Event Definition Navigation: “Events” – “Definition” There are different types available. The following table gives an overview about event type and recording type Type Recording EN50160 Event list of all EN50160 limit violations Alarms Event list of defined alarms Event list of harmonic voltage limit... - Page 41 For the Voltage Limits the limits for flagging the data, Swell & Dip Limit, Interruption Limit and the hysteresis can be defined. For Rapid voltage changes the steady state, rate of change, min. steady state difference and duration can be define. Alarms Navigation: “Events”...
- Page 42 storing of alarms is enabled). Alarms can be configured for different quantities and different evaluation times according to next picture (Alarms definition sub panel): 1. List of available quantities 2. Alarm enable/disable button 3. Alarm limits Harmonic Voltage Alarms Navigation: “Events” – “Definition” – “Harmonic Voltage Alarms” These events are generated when a specific voltage harmonic crosses defined limits and can be logged (if storing of alarms is enabled).
- Page 43 which is transported by this signaling is stored. The definition of this event allows the setup of specific parameters of the signaling voltage, like signal frequency, start pattern and length. 1. Signaling frequency 2. Start pattern (length of logical 1 and logical 0 on the beginning of the signal) 3.
- Page 44 Transients Navigation: “Events” – “Definition” – “Transients” Transients are stored in full sampling rate (sampling rate defined in “Setup”-“Processing”). A transient event can occur if specified conditions are met. As a condition a specific quantity, their limits, hysteresis and type of hysteresis (level or time), phases and type of window (inside limits or outside limits) can be defined.
- Page 45 The following table shows the different trigger types and their calculation base. Type Time Base RMS (U, I) ½ Period RMS values Harmonic (U, I, THD, etc.) 200ms values (10/12 period-values) P, Q, S, PF, phi 200ms values (10/12 period-values) Frequency 1 period value Delta Frequency...
- Page 46 Disturbances Navigation: “Events” – “Definition” – “Disturbances.” These events are similar to Transients. Instead of waveforms the half-period values for voltage, current, phase angle, power, power factor, etc. are stored. Each Disturbance event will also trigger an Transient event. In that way any kind of disturbance can be detected. 1.
-
Page 47: Phase Measure Unit
4.5.8 Phase Measure Unit Navigation: “Menu” – “PMU” The instrument is a highest-precision Phase Measure Unit (PMU). The accurate voltage and current inputs, together with the high-precise internal GPS unit, allows measurements with highest quality. The PMU functionality requires a minimal sampling rate of 19,2kS/s. Using the PMU function doesn’t store any data on the instrument. - Page 48 4.5.8.2 Configuration Navigation: “Menu” – “PMU” – “Setup” First the phasors need to be assigned to input channels of the instrument. it can be defined which quantity is being provided – for each Reported Phasor channel – e.g. „raw“ phasor, or positive, negative, zero component Phasor name user can edit quantity name exceeding the limit is included as an information in a „Status Word“...
- Page 49 4.5.8.3 Connection Navigation: “Menu” – “PMU” – “Conn.” At general PMU settings the connection to the central PMU software (e.g. WAMS system) can be defined. PMU ID supposed to be unique identification number, one of the crucial parameters when connecting to PMU data stream PMU TCP port tcp port used to connect to PMU data stream (often 4712, but for network related reasons might be changed to another)
-
Page 50: Display Of Actual Values
4.5.9 Display of actual values Actual values info bar shows actual value of phase voltages or currents or active, reactive and apparent power. Switching between displayed values is done by clicking on actual values info area. By clicking on the top bar you can switch between the different data types. Page 50 of 76... -
Page 51: Data Analysis
4.6 Data Analysis In the NEO Software Starter Screen you can select between “Report” and “Report New” tool. The classical “Report” tool is available on the market for more than 15 years – well known from PNA hardware products. It covers all classical functionalities. All data of PNA instruments (PNA 561, PNA571) can be opened and analyzed. -
Page 52: Settings
Report New The graphical user interface of the new Report Tool was updated and optimized. In addition a couple of new features have been implemented. Simultaneous analysis of different kind of data is a new feature, as well as enhanced analysis and data visualizations functions. Another feature is the possibility to overlay data of different measurements. -
Page 53: Graphs / Time Series Data
4.6.2 Graphs / Time Series Data After selecting “Graphs” and pressing “Add Data” (1) button (see picture) the Channel selection menu will appear. Then select the System (2) and project (3). The treeview will enhance and show the different measurements. Select the measurement (4) on the left side and check the quantities you want to show/analyze on the right (5). - Page 54 Overview Data visualization panel Selected Quantities (1) By pressing on the green indication lamp you can enable/disable individual quantities or phases (2) for the Visualization Configuration of Visualization (3) x-y axis (scaling, lin/log) interpolation type point style number of charts Cursors Zoom In/out Function...
- Page 55 Zoom In / Out and Cursors A second cursor can be activate by pressing (1) To Zoom In activate Zoom function by pressing (2) Now Zoom function is activated. Keep the left mouse button pressed and move over the selected area you want to zoom.
- Page 56 Multiple Charts To show data in multiple charts, first select the type of multi chart visualization (1). Up to four independent charts can be defined. There are three different options available Single chart Multiple charts among each other Multiple charts – 2 Charts in one row (see picture) After selecting the chart type, you can assign the quantities to the individual charts via dropdown selection (2).
-
Page 57: Fft Data
4.6.3 FFT Data After selecting “FFT” you can add the channels in the same way as described for Graphs. 1) You can show the FFT data in multiple charts or all together in one 2) Axis scaling (linear, logarithmic, Auto, manual) 3) X-Axis in Harmonic orders or in Hertz (Hz) 4) Showing Min / Max Values 5) Horizontal lines... - Page 58 FFT Reference Curve Application: Evaluation according to IEC61000-2-2, -3-3, IEEE519, etc. For Harmonic FFT analysis it’s possible to add a reference curve to the visualization screen. When selecting the quantities (1), you can add the desired reference curve at “Limits” (2). The limits are shown as circles in the visualization: For different graphs, different limits can be selected.
- Page 59 MIN / MAX values For each harmonic the Min and Max Values can be shown in addtion. They will appear as colored rectangles: Recorder + FFT By pressing “Add data” and selection of time-series data you can add a recorder window to the FFT data.
-
Page 60: Events, Alarms, Transients, Disturbances
4.6.4 Events, Alarms, Transients, Disturbances For the presentation of events, transients, alarms and deletions, the "Event Panel" is available. After clicking on Events (1), the selection of the range (2) can be selected (3). It can also be combined with all Events. The list with all events is shown. - Page 61 Zoom (1) Time selection (2) Axis (3) Multi-Chart (4) In addition, other parameters can be taken into account like derivate of voltage or current or frequency, etc. This is possible via "Add" (5) and selection of parameters at "TRA" (6 + 7) Page 61 of 76...
-
Page 62: En50160
Predefined templates are available for EN50160, IEC61000-2-2, IEC61000-2-4, IEEE519, FoL standards. Other templates can be added by oneself or by NEO Messtechnik. Select time-intervall (Note: Multiple data files can be analysed together) Analysis and Report visualisations see: The table shows all parameters and the limits according to EN50160. - Page 63 Event list The following table shows the Event statistics and classifications. Depending on length and extrema of voltage events, the different events will be counted. Voltage Harmonics The following FFT chart shows 95% quantil, max and limit value of the voltage harmonics. Event list All events are listed with phase information date and time.
- Page 64 ITIC curve The ITIC curve is an additional visualization to show and classify events. The events will be shown in different colors as points, depending on phase. Points outside the ITIC area, can affect electronic equipment. Page 64 of 76...
-
Page 65: Data Export Options
4.6.6 Data Export options There are several options to export data. Option 1: Export in Main tab This option allows to export data of one or multiple datafiles together with full storage rate for time series data respective full sampling rate for Transients. 1) Start “Export function”... -
Page 66: Automatic Report Generator
4.6.7 Automatic Report Generator This function allows creating automatic reports with customizable templates. Any kind of stored parameter can be displayed in various visualisations like XY-Chart, FFT-Chart, Transient View etc. 4.6.7.1 How to generate a report After opening report function via click on “PDF” the report generator screen will appear. 1) Select one or more data files 2) Select one templates 3) Define time-frame... - Page 67 4.6.7.2 How to create a new template After opening the report generator panel (PDF), you can add, change or remove templates: After adding a new template via “Add” you can define a name for the template in the popup window: The idea of creating templates follows a modular block system.
- Page 68 Example: Adding a XY-Chart for voltage and current on one page 1) Add new block 2) Select block for new page and press confirm (7) 3) Add new block (1) and select Graph XT 4) Select Voltage Urms 5) Select page style, legend off/on and line style 6) Phase selection 7) Confirm 8) Save...
-
Page 69: Data Analysis On Pc / Copy Data Of Instrument
4.6.8 Data Analysis on PC / Copy data of instrument All data can be analyzed on your personal computer. There are two options to copy the data: Option 1: Copy data folder to your PC For this option only the report tool needs to be installed on your PC. 1) Copy whether the data folder, where all measurements are stored, of your instrument, or the folder of the measurement to your PC 2) The easiest way is to copy the folder to the exact same path of the installation folder. -
Page 70: Further Manuals And Links
Classical Report Tool Manual Detailed information for the classical report tool, detailed description to all analysis and data visualization functionalities. NEO Messtechnik Brochure Showing all products and accessories available. Quick Start Manual This quick start manual is available online and as PDF. -
Page 71: Technical Data And Specifications
6 Technical Data and Specifications 6.1 PQA8000H ANALOG Voltage Channel Current 6 (LEMO) 5(LEMO) Analog Input 2(DSUB15) 3 (DSUB15) ±1600Vp Voltage ±800Vp Input Clamp Range Current ±10Vp MAX Rogowski Analog Input ±10Vp MAX DC Accuracy ±0.05%FS ±0.05%FS Voltage Clamp 1,2,5,10 x 1,2,5,10 / 1,5 Rogowski Gain Current... -
Page 72: Pqa8000
1 TEDS for All CH Sensor TEDS Analog Input 1 TEDS for All CH Isolation Type CH-CH Sensor Isolation Isolation Voltage 6kVp Sensor Isolation 6.2 PQA8000 ANALOG Voltage Channel Current 6 (LEMO) 5(LEMO) Analog Input 2(DSUB15) 3 (DSUB15) Nom. ±500Vrms Voltage (±1,600Vp MAX) -
Page 73: Digital Inputs
No FIR filter 66kHz@140ksps One FIR 700 9.2kHz@20ksps,140ksps order -0.1dB Digital Two FIR 700 (FIR) 3kHz@12ksps,6ksps order Two FIR 700 2.5kHz@10ksps,5ksps order -3dB 68kHz Measuring BandWidth -0.1dB 66kHz Typical SNR 95dB Typical CMRR 90dB Current Sensor Power ±15V(1.3A),9V(1A),3.3V(1A) Current 1 TEDS / CH Sensor TEDS Analog Input... -
Page 74: Environment And Mechanical
Besides the instrument, the following additional components are provided as seen below. (Touch pencil) (PQA8000) (Power cable) (Bag) 6.6 Accessories Please check the NEO Messtechnik brochure or webpage (www.neo-messtechnik.com) to see all available accessories for the instrument. Page 74 of 76... - Page 75 Detailed calibration reports can be requested. Service & Repair The team of NEO Messtechnik performs any kinds of service and repairs to your system to assure a safe and proper operation in the future. Contact us for more information. Maintenance work should be done by NEO Messtechnik only.
- Page 76 Version 1.9. Report Generator Contact When you are working with our products we want to provide you with the greatest possible benefits. If you need any support, we are her to assist you. support@neo-messtechnik.com www.neo-messtechnik.com Austria: Switzerland: Sonnweg 4, Moosacherstrasse 15, A-2871 Zöbern...