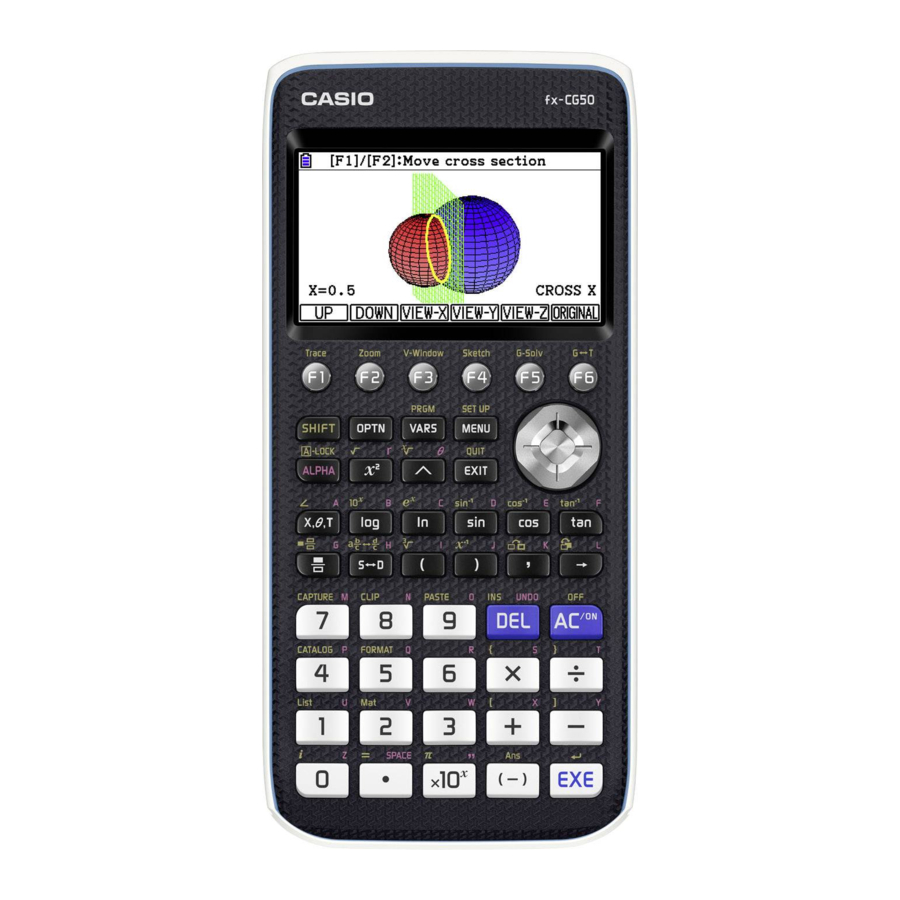
Casio fx-CG50 Quick Start Manual
Hide thumbs
Also See for fx-CG50:
- User manual (667 pages) ,
- Hardware user's manual (18 pages) ,
- Setting-up manual (12 pages)
Table of Contents
Advertisement
Quick Links
fx-CG50
Q U I C K S T A R T G U I D E
The status bar will display messages and current status like battery level, angle mode, fraction results, complex
mode, or input/output settings.
Select the desired icon by highlighting it and pressing
the upper right corner.
The function keys allow you to access the tab (soft key) menus that appear at the bottom of the screen.
u
When an (>) appears above the
key, selecting
p
The
key displays every mode the calculator has. To select a mode, press
l
press
or press the number or letter in the upper right hand corner of the icon.
d
The
key operates like the back arrow on a web browser; it will take you back one screen
d
each time you select it. The
key will not take you to the icon menu.
L
The
key activates any function displayed on or above the calculator buttons that is yellow. For
example, to find the square root of a number, you would need to press
to on-screen color formatting.
O
The
key will power the unit on. To turn the unit off, press
a
The
key activates any function displayed on or above the calculator buttons
that is in red. For example, to type the letter A, press
l
The
key executes operations. When data is entered, the
pressed to store the data.
fx-CG50
l
or pressing the number or letter in
u
will offer more on-screen choices.
$N
to the desired icon and
L
s
L5
,
then
.
gives
L
O
.
a
f
,
then
.
l
button must be
you access
Advertisement
Table of Contents

Related Manuals for Casio fx-CG50


Summary of Contents for Casio fx-CG50
- Page 1 Q U I C K S T A R T G U I D E fx-CG50 The status bar will display messages and current status like battery level, angle mode, fraction results, complex mode, or input/output settings. Select the desired icon by highlighting it and pressing or pressing the number or letter in the upper right corner.
- Page 2 The following explains the meaning of each icon on the fx-CG50 icon menu Icon Menu Name Description RUN-MATRIX This icon menu is used for general computations, including binary, octal, decimal, and hexadecimal functions and matrices. This icon menu is used to perform single-variable (standard deviation) and paired variable...
- Page 3 The following explains the meaning of each icon on the fx-CG50 icon menu Icon Menu Name Description PROGRAM This icon menu is used to store programs in the program area and to run programs. FINANCIAL This icon menu is used to perform financial calculations and to draw cash flow and other types of graphs.
- Page 4 Note: the status bar at the top of the screen displays the selection for some of these options. 1. Evaluate 2 3 (...) jc c (a--4) Press To see the result as a mixed number, press To see the result as a decimal, press 4 fx-CG50 Quick Start Guide...
- Page 5 The purpose of this example is to demonstrate the key. represents the previous answer. Press 48+24l. Then, press M2l. appears automatically when an operation symbol (Ans) is pressed. However, has to be pressed for the subtraction part. Press 56-Ln fx-CG50 Quick Start Guide...
- Page 6 The values for Scale determines the location for the marks on the axes and the gridlines. Press shown, pressing return to the editor. To draw the graph, press u(DRAW). When a graph is displayed the key can be used to zoom in, the key to zoom out, and$!BN to scroll. 6 fx-CG50 Quick Start Guide...
- Page 7 To graph this function, first, deselect the previous equation by pressing so the cursor is on , then press q(SELECT)N. Note, the = sign is not highlighted. The cursor should now be on . Press n2fs+40fl. fx-CG50 Quick Start Guide...
- Page 8 To determine the price that is predicted to make the most money, press w(MAX). The results, $10 and $200, are shown at the bottom of the screen. To mark the point and keep the coordinates on the display, press fx-CG50 Quick Start Guide...
- Page 9 Now, both graphs will be drawn. Press u(DRAW). To find the intersection points for the two graphs, press y J(INTSECT). 38 shirts are sold at the price of $1, for a total of $38. (These graphs also intersect at (20, 0) where no shirts were sold.) fx-CG50 Quick Start Guide...
- Page 10 To set the initial value, end value and the increment, press y(SET). Enter the values for Start, End and Step. Press after entering each value, then press To display the table, press u(TABLE). Use to scroll through the table. Note:valuesinthex-columncanalsobechanged manually.Pressanyvaluedesired,then pressl.Here,thevalue of 3 was changed to 7. 10 fx-CG50 Quick Start Guide...
- Page 11 A. A dialogue box opens displaying the new desired value, then, press Notice, the previous graph is drawn in faint yellow. Use to change the value of a different variable or the value for Step. fx-CG50 Quick Start Guide 11...
- Page 12 Note, equations must be in standard form to solve. To solve, press q(SOLVE). Both solutions are displayed. Note, when solutions are not rational, both a decimal and an exact solution are displayed. The third screenshot displays the solutions to . fx-CG50 Quick Start Guide...
- Page 13 2a -b + 6c = 5 . (QUIT). The Equation menu can also be used to solve linear systems. Within the Equation menu, press Press (SIMUL), then (3). Enter all 12 values, pressing after each one. To solve this system, press (SOLVE). fx-CG50 Quick Start Guide...
- Page 14 To draw the graph, press u(DRAW). 2. Find the asymptotes for the conic graph. Ly (G-Solv) y(ASYMPT). To draw the asymptotes, press The slope for each line is also displayed. fx-CG50 Quick Start Guide...
- Page 15 To find the coordinates of the vertices, press r(VERTEX). To find the coordinates of the foci, press q(FOCUS). In each case, press move to the second point. To mark points and label the coordinates on the display, press fx-CG50 Quick Start Guide...
- Page 16 If necessary, scroll to Data and change to List1. Display can be used to select percentages or counts with the chart. Press q(GRAPH1). The color and shading of plots can be changed by using L5(FORMAT). 16 fx-CG50 Quick Start Guide...
- Page 17 For Type , select q(Hist). Start Width Press dq(GRAPH1). Select values to determine the rectangles that will be plotted. Press q(1-VAR) to see the statistical analysis of the data. fx-CG50 Quick Start Guide 17...
- Page 18 Graph Type To change to a box-and-whisker plot (boxplot or median box plot), press du(SET). Scroll to and press (Trace) w(MedBox). Press dq(GRAPH1). To display the minimum, maximum, and quartiles, press to display the next value. 18 fx-CG50 Quick Start Guide...
- Page 19 To display the table, press u(TABLE). (V-Window) This sequence can also be viewed as a graph. Before plotting the graph, set a window by pressing Press To see the graph, (Trace) press u(GPH-PLT). To trace on the graph, press fx-CG50 Quick Start Guide...
- Page 20 To insert the =, press Once the equation is entered, press u(SOLVE). It will take 70 quarters or 17 years for the investment to double. 20 fx-CG50 Quick Start Guide...
- Page 21 For FV, enter To determine how long it will take for the account to double in value to $200.00, press q(REPEAT). then press q(n). This value agrees with the previous result from the Equation menu. fx-CG50 Quick Start Guide 21...
- Page 22 Amusem~1.g3p Scroll down to the folder and press q(OPEN). Scroll down to and press q(OPEN). (FORMAT) Press Scroll down to the equation for the circle and press To change the color, press 3(Red). 22 fx-CG50 Quick Start Guide...
- Page 23 C O N I C G R A P H S Press q(MODIFY). Modify the coefficients to find a good model. fx-CG50 Quick Start Guide 23...
- Page 24 PICTURE PLOT As an alternate to Modify, the PRIZMTM fx-CG50 allows you to plot points on a image and use regression to find a model. 1. What is an equation for a line in the image? From the Main Menu, press ((I).
- Page 25 The display is improved if the graph is not blue, so scroll to Y2 and press To save the result, press y(COPY). Press (DRAW) to view the equation of the line. The graph is drawn but as a thin blue line. To draw the graph that was saved, press ir(DefG)u(DRAW). fx-CG50 Quick Start Guide 25...
- Page 26 PICTURE PLOT In a similar manner, a quadratic model can be used for another portion of the bridge. 26 fx-CG50 Quick Start Guide...
- Page 27 N OT ES fx-CG50 Quick Start Guide 27...
- Page 28 See the complete line of Casio calculators fx-CG50 Quick Start Guide...