Table of Contents
Advertisement
Quick Links
Advertisement
Table of Contents

Related Manuals for Texas Instruments TI Voyage 200


Summary of Contents for Texas Instruments TI Voyage 200
- Page 1 Introductory Handbook for the TI Voyage 200 c 2009 - Portland Community College...
-
Page 2: Table Of Contents
Contents The Layout of Your Calculator Functions Keys ........Blue 2nd and Green Diamond . - Page 3 Home Screen F-Menus F1: Tools ..........16 5.1.1 8: Clear Home .
-
Page 4: The Layout Of Your Calculator
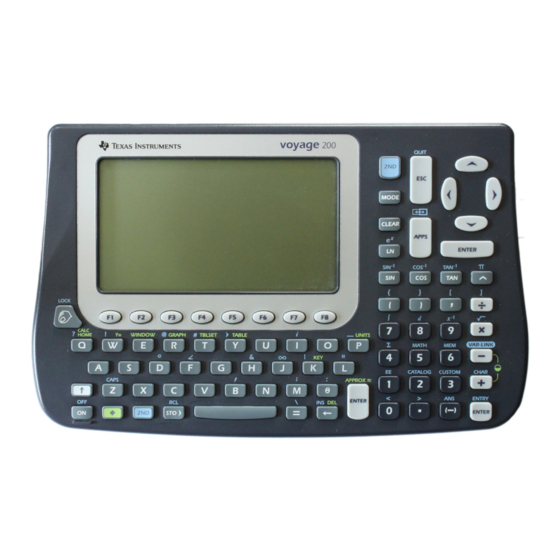
Chapter 1 The Layout of Your Calculator Functions Keys Immediately beneath your calculator’s screen is the following: These buttons, through , are your function keys. As with regular computers, function keys all you access to additional features of the different applications you will use. How these are used in the various applications will be explained in the appropriate sections of the handbook. -
Page 5: Arrow Keys
CHAPTER 1. THE LAYOUT OF YOUR CALCULATOR Arrow Keys At the top right of your calculator, you have the following arrow keys: These will allow you to move up, down, left, or right in graphs, menus, etc. Delete and Clear button, located on the bottom of the keyboard and to the right of the spacebar, will delete one space to the left of the cursor. -
Page 6: The Most Basic Basics
Chapter 2 The Most Basic Basics Turning the Calculator On and Off To turn on your calculator, press located in the lower left corner. To turn off your calculator, press and then since ”OFF” is above in blue. Note: Your calculator will turn itself off after a few minutes of inactivity to save power. Adjusting the Screen Contrast To make the screen darker, hold down and press... -
Page 7: The Home Screen
CHAPTER 2. THE MOST BASIC BASICS The Home Screen The Home Screen that is highlighted in the picture in section 2.3 is where you will do all of the calculations that you normally think of doing on a calculator, such as adding, subtracting, etc. To get to the Home screen either: a. -
Page 8: The Settings
Chapter 3 The Settings The MODE Button Before you do anything else, you want to make sure the settings on the calculator are what you will want for most of the mathematics courses you’ll take. Keep in mind you might use different settings in certain classes, but your instructor will inform you when these settings need to be changed. -
Page 9: Changing A Setting
CHAPTER 3. THE SETTINGS Changing a Setting Press to view the first page of settings. If your calculator is brand new, your ”Display Digits” option is probably set to ”FLOAT6.” You want to change that from ”FLOAT6” to ”FLOAT.” To do so, scroll down with the up/down arrows to the ”Display Digits”... -
Page 10: Performing Calculations
Chapter 4 Performing Calculations Go to your Home Screen by pressing Clearing the Home Screen If you have anything in your Home Screen, you’ll want to clear it out now. To do this, access the Tools menu, . Option 8 is ”Clear Home.” There are two options for using this command. a. -
Page 11: Negative Numbers Vs. Subtraction
CHAPTER 4. PERFORMING CALCULATIONS Example: To divide 6 by 7, type With the division, notice it told you that 6 divided by 7 is 6/7. This is because the calculator will give you the exact value if you do not use any decimals in what you type in to the calculation. If you had entered something with a decimal point, the calculator would give you an approximate value. -
Page 12: Square Roots
CHAPTER 4. PERFORMING CALCULATIONS Square Roots Above , you will find the symbol in blue. Press to use the square root. Example: To calculate 32, you would type With the square root, you should notice a few things: a. When you press , it gave you the radical and the opening parenthesis. -
Page 13: Cube Roots And Other Radicals
CHAPTER 4. PERFORMING CALCULATIONS Cube Roots and Other Radicals The calculator does not have a button for any roots other than the square root. To calculate the n root of a number, you have two options. a. Use the fact that and enter the radical as a fractional exponent. -
Page 14: Absolute Values
CHAPTER 4. PERFORMING CALCULATIONS Absolute Values The calculator does not have a key for the absolute value. There are two ways to use the absolute value command. a. Find the command abs( in the calculator’s catalog. Press and scroll to abs(. To chose this command, use the arrow keys to move the little black triangle so that it points at abs( and then press Example: To calculate... -
Page 15: Home Screen F-Menus
Chapter 5 Home Screen F-Menus Go to your Home Screen by pressing Clear your Home Screen by pressing As was mentioned before, the Home Screen is where you will perform most of your calculations. But it is important to recognize that you can do much more than just addition, subtraction, multi- plication, and division here. -
Page 16: F1: Tools
CHAPTER 5. HOME SCREEN F-MENUS F1: Tools Press for the Tools menu and scroll up and down to see all of the options. This menu has some of the ”Edit” menu options you have Microsoft Word, as well as some others. Notice that next to the 8 is an . -
Page 17: F2: Algebra
CHAPTER 5. HOME SCREEN F-MENUS F2: Algebra Press for the Algebra menu and scroll up and down to see all of the options. This menu has many algebra-related commands and will be helpful in any mathematics course. 5.2.1 1: solve( ”solve(”... -
Page 18: 2: Factor
CHAPTER 5. HOME SCREEN F-MENUS 5.2.2 2: factor( ”factor(” will factor an expression for you and uses the format f actor(expression). If you enter in a prime polynomial, the result will simply be the expression you entered. Example: Factor x 4. -
Page 19: F3: Calculus
CHAPTER 5. HOME SCREEN F-MENUS F3: Calculus Press for the Calculus menu and scroll up and down to see all of the options. This menu has many calculus-related commands and will be helpful in MTH 251 and higher. These options are outside the intended scope of this handbook. Please see your instructor of as- sistance with this menu. - Page 20 CHAPTER 5. HOME SCREEN F-MENUS Example: Evaluate f ( 5), using f (x) = 9x + 1 from above. f has already been defined, otherwise you would do that now. To evaluate f ( 5), you need to enter ”f ( 5)”. Type Example: Solve f (x) = 7, using f (x) = 9x + 1 from above.
-
Page 21: F5: Progamio
CHAPTER 5. HOME SCREEN F-MENUS F5: ProgamIO Press for the ProgramIO menu. This menu is outside the scope of this handbook. F6: Clean Up Press for the Clean Up menu. 5.6.1 1: Clear a-z... ”Clear a-z...” will delete all saved single-variable values. This means that function definitions, values, etc. -
Page 22: Graphing Equations/Functions
Chapter 6 Graphing Equations/Functions Above the three letter keys, , and you’ll see the following words in green: Y=, WINDOW, and GRAPH. These are the three things you needs to graph functions and each options represents a step in the process of graphing functions. - Page 23 CHAPTER 6. GRAPHING EQUATIONS/FUNCTIONS To enter in a function to graph, type the function in the command line. Example: You want to graph y = 2x + 1. Enter that in for y1 by using the arrows to move the cursor next to y1.
-
Page 24: Checking Window Settings
CHAPTER 6. GRAPHING EQUATIONS/FUNCTIONS Checking Window Settings Press to enter the WINDOW screen. The standard viewing window is [ 10, 10] for both the x and y axes. If the viewing window is different, you can manually reset it to the standard viewing window but scrolling up and down with the arrow keys and entering 10 or 10 as appropriate. -
Page 25: Clearing Previous Functions From The Y= Screen
CHAPTER 6. GRAPHING EQUATIONS/FUNCTIONS Clearing Previous Functions From the Y= Screen Go to the Y= screen by pressing Clear any saved functions by using the up/down arrows to highlight a function and then press to delete the function from memory. Do this for any function you no longer need. Changing the Window Settings Go to the Y= menu, Example:... - Page 26 CHAPTER 6. GRAPHING EQUATIONS/FUNCTIONS The problem with this window is that you cannot see part of the graph. What you need to do is to adjust the viewing window to go down further on the vertical axis. Go back to the WIN- DOW screen by pressing .
-
Page 27: F-Menus While Graphing
CHAPTER 6. GRAPHING EQUATIONS/FUNCTIONS F-Menus While Graphing Some, but not all, of the available F-Menu commands in the GRAPH screen will be explained. Graph y1 = x 5x + 1 in the standard viewing window. All explanations will be done with this function as the example and viewed on the standard view- ing window. - Page 28 CHAPTER 6. GRAPHING EQUATIONS/FUNCTIONS location of the second corner, also by moving the cursor with the arrow keys. As you move the cursor for the second corner, you will see a box being drawn on the graph. This is the box you’ll zoom in on.
- Page 29 CHAPTER 6. GRAPHING EQUATIONS/FUNCTIONS 6: ZoomSTD ZoomSTD will automatically reset all the window settings to the standard viewing window and regraph the function(s). 7: ZoomTrig ZoomTrig will reset the window settings to a predefined [-3.3π, 3.3π] on the x-axis, and [-4, 4] on the y-axis.
-
Page 30: F3: Trace
CHAPTER 6. GRAPHING EQUATIONS/FUNCTIONS C: SetFactors... SetFactors... allows you to set the zooming factor for ZoomIn and ZoomOut. It includes xFact and yFact settings for 2-dimension and zFact for 3-dimensional graphs. 6.6.2 F3: Trace Trace allows you to use the cursor to trace your graph using the left/right arrow keys. It displays the coordinates of the cursor’s location. -
Page 31: F5: Math
CHAPTER 6. GRAPHING EQUATIONS/FUNCTIONS 6.6.3 F5: Math 1: Value Value will allow you to calculate a y-value when you enter in an x-value and it will visually move the cursor to this (x, y) coordinate. In some ways this is similar to what you can do with the Trace feature. - Page 32 CHAPTER 6. GRAPHING EQUATIONS/FUNCTIONS 2: Zero Zero will identify the zeros (a.k.a. the x-coordinate of an x-intercept) of your function. To use this command, the calculator will ask for a lower bound and upper bound, which tells the calculator which x-values to look between. If more than one zero is found, the least (left-most) zero will be identified.
- Page 33 CHAPTER 6. GRAPHING EQUATIONS/FUNCTIONS 3: Minimum Minimum will find the minimum y-value between your identified lower bound and upper bound and it will visually move the cursor to this (x, y) coordinate. Example: Find the minimum y-value between the x-values of 0 and 2. Press to use the Minimum command.
- Page 34 CHAPTER 6. GRAPHING EQUATIONS/FUNCTIONS 4: Maximum Maximum is the counter-part for the Minimum command. Maximum will find the maximum y-value between your identified lower bound and upper bound and it will visually move the cursor to this (x, y) coordinate. Example: Find the maximum y-value between the x-values of -3 and 0.
- Page 35 CHAPTER 6. GRAPHING EQUATIONS/FUNCTIONS 5: Intersection Intersection will allow you to determine where two different functions intersect, between your identified lower bound and upper bound and it will visually move the cursor to this (x, y) coor- dinate. In addition to identifying the lower bound and upper bound, you will need to identify which two functions you want to consider.
-
Page 36: Using The Table
Chapter 7 Using the Table Above the three letter keys, , and you’ll see the following words in green: Y=, TBLSET, and TABLE. These are the three things you needs to graph functions and each options represents a step in the process of graphing functions. - Page 37 CHAPTER 7. USING THE TABLE To enter in a function to use in the table, type the function in the command line. Example: Enter y = x + 2 for y1. Use the arrows to move the cursor next to y1 and then type in to the command line.
-
Page 38: The Table Settings
CHAPTER 7. USING THE TABLE The Table Settings Press to enter the TBLSET screen. There are four potential settings that you can adjust. The bottom setting, Independent, is the most important. Independent: Auto or Ask If this is set to Auto , your table will be automatically generated using the other three settings. If this is set to Ask , you will need to enter in each x-value one at a time for the table to have any information. -
Page 39: Using The Table
CHAPTER 7. USING THE TABLE Using the Table Using the equations from the first section of this chapter and the settings from the second section, press to view the table. The first column contains the x-values that have come from the Independent: AUTO settings. The second column contains the corresponding y-values for the function saved as y1.