Table of Contents
Advertisement
Quick Links
Advertisement
Table of Contents

Related Manuals for Teledyne Lecroy HDO8000


Summary of Contents for Teledyne Lecroy HDO8000
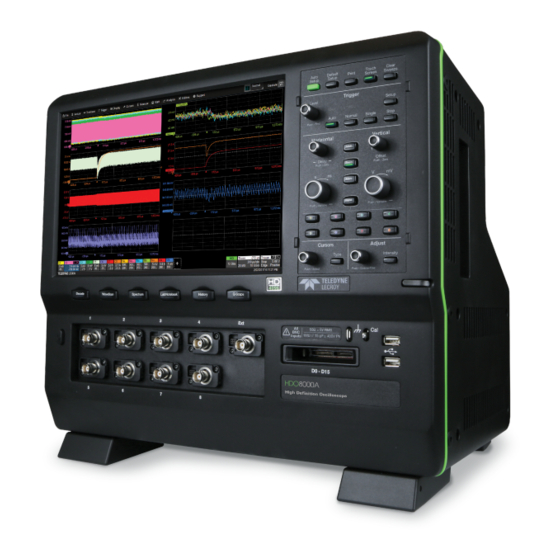
- Page 1 Operator's Manual HDO8000 / HDO8000A MDA800 / MDA800A Oscilloscopes...
- Page 2 Teledyne LeCroy, Inc. documentation for internal educational purposes. Teledyne LeCroy is a trademark of Teledyne LeCroy, Inc., Inc. Other product or brand names are trademarks or requested trademarks of their respective holders. Information in this publication supersedes all earlier versions.
-
Page 3: Table Of Contents
Contents About This Manual Safety Oscilloscope Overview and Set Up Front of Oscilloscope Removable Hard Drive Back of Oscilloscope Front Panel Signal Interfaces Probes Powering On/Off Software Activation Language Selection Connecting to Other Devices/Systems Using MAUI Touch Screen MAUI with OneTouch Working With Traces Zooming Print/Screen Capture... - Page 4 HDO8000A/MDA800A High-Definition Oscilloscope Operator's Manual Measure Measure Dialog Parameter Set Up List of Standard Measurements Measure Table Parameter Math Using Web Editor Using Histograms Using Trends Using Tracks Track vs. Trend EMC Pulse Parameter Software Package Math Math Function Set Up List of Standard Math Operators Average Function Copy Function...
- Page 5 LabNotebook Report Generator Share Print Email & Report Settings Using the File Browser Utilities Utilities Dialog Disk Utilities Preferences Dialogs Maintenance Restart/Reboot Instrument Restore Default Setup Changing Screen Settings Touch Screen Calibration Software and File Management X-StreamDSO Firmware Update Switching Windows Users Technical Support Returning a Product for Service Index...
-
Page 6: About This Manual
HDO8000A/MDA800A High-Definition Oscilloscope Operator's Manual About This Manual Thank you for purchasing a Teledyne LeCroy Motor Drive Analyzer (MDA) or HDO8000 oscilloscope. We're certain you'll be pleased with the detailed features unique to our instruments. This manual covers the operation and maintenance of all instruments in the MAUI HDO8000/MDA800 series, although HDO8000A is shown here. - Page 7 Safety Precautions Use indoors only . Use only within the operational environment listed. Do not use in wet or explosive atmospheres. Maintain ground. The AC inlet ground is connected directly to the frame of the instrument. To avoid electric shock, connect only to a mating outlet with a safety ground contact. Caution: Interrupting the protective conductor inside or outside the oscilloscope, or disconnecting the safety ground terminal, creates a hazardous situation.
- Page 8 HDO8000A/MDA800A High-Definition Oscilloscope Operator's Manual Cooling The instrument relies on forced air cooling with internal fans and vents. Take care to avoid restricting the airflow to any part. In a benchtop configuration, leave a minimum of 15 cm (6 inches) around the sides between the instrument and the nearest object.
-
Page 9: Oscilloscope Overview And Set Up
Oscilloscope Overview and Set Up Oscilloscope Overview and Set Up Front of Oscilloscope A. Touch screen display G. External trigger input B. Front panel H. Mixed-Signal interface C. Shortcut buttons I. Ground and Calibration output D. Built-in stylus holder J. USB ports E. -
Page 10: Removable Hard Drive
HDO8000A/MDA800A High-Definition Oscilloscope Operator's Manual Removable Hard Drive The side of the MDA/HDO8000 houses a removable hard drive. To remove the drive: 1. Loosen the two knobs that secure the cover and remove it. You may use a screwdriver to loosen the knobs. -
Page 11: Back Of Oscilloscope
Oscilloscope Overview and Set Up Back of Oscilloscope A. Built-in carrying handle F. USB 2.0 ports B. Ref in/out for reference clock G. DisplayPort for external monitor C. Auxiliary output H. Audio in/out D. USBTMC for remote control I. AC power inlet E. -
Page 12: Front Panel
HDO8000A/MDA800A High-Definition Oscilloscope Operator's Manual Front Panel Front panel controls duplicate functionality available through the touch screen and are described here only briefly. Knobs on the front panel function one way if turned and another if pushed like a button. The first label describes the knob’s “turn”... - Page 13 Oscilloscope Overview and Set Up Horizontal Controls The Delay knob changes the Trigger Delay value (S) when turned. Push the knob to return Delay to zero. The Horizontal Adjust knob sets the Time/division (S) of the acquisition system when the trace source is an input channel.
-
Page 14: Signal Interfaces
Model Channels Input All HDO8000/HDO8000A and MDA800/MDA800A 1 to 8 The ProBus interface completely integrates the probe with the channel. Upon connecting a Teledyne LeCroy probe, the probe type is recognized and some setup information, such as input coupling and attenuation, is performed automatically. -
Page 15: Probes
Digital Setup Using the Digital Leadset for detailed instructions. Probes The oscilloscope is compatible with the included passive probes and most Teledyne LeCroy active probes that are rated for the instrument’s bandwidth. Probe specifications and documentation are available at teledynelecroy.com/probes. Passive Probes The passive probes supplied are matched to the input impedance of the instrument but may need further compensation. -
Page 16: Powering On/Off
The operating software (firmware and standard applications) is active upon delivery. At power-up, the instrument loads the software automatically. Free firmware updates are available periodically from the Teledyne LeCroy website at: teledynelecroy.com/support/softwaredownload Registered users can receive an email notification when a new update is released. Follow the instructions Firmware Update to download and install the software. -
Page 17: Connecting To Other Devices/Systems
Oscilloscope Overview and Set Up Connecting to Other Devices/Systems Use the menu options listed below to configure connections to other devices. The instrument is preset to accept a DHCP network address over a TCP/IP connection. Connect a cable from an Ethernet port on the back panel to a network access device. Go to Utilities > Utilities Setup > Remote to find the IP address. - Page 18 HDO8000A/MDA800A High-Definition Oscilloscope Operator's Manual Note: If using TCP/IP, you can connect over the LAN or directly to the controller. Be sure the oscilloscope is on the same subnet as the controller. Depending on the host, you may need to use a cross-over cable to make a direct connection.
-
Page 19: Using Maui
Using MAUI Using MAUI MAUI, the Most Advanced User Interface, is Teledyne LeCroy's unique oscilloscope user interface. MAUI is designed for touch—all important controls for vertical, horizontal, and trigger are only one touch away. Touch Screen The touch screen is the principal viewing and control center. The entire display area is active: use your finger or a stylus (not included) to touch, drag, swipe, or draw a selection box. - Page 20 HDO8000A/MDA800A High-Definition Oscilloscope Operator's Manual If an action can be “undone”, the Undo button restores the oscilloscope to the prior state. Grid The grid displays the waveform traces. Every grid is 8 Vertical divisions representing the full number of 4096 Vertical levels possible at the current resolution and 10 Horizontal divisions each representing acquisition time.
- Page 21 Using MAUI Grid Indicators These indicators appear around or on the grid to mark important points on the display. They are matched to the color of the trace to which they apply. When multiple traces appear on the same grid, indicators refer to the foreground trace—the one that appears on top of the others.
- Page 22 HDO8000A/MDA800A High-Definition Oscilloscope Operator's Manual Descriptor Boxes Trace descriptor boxes appear just beneath the grid whenever a trace is turned on. They function to: Inform—descriptors summarize the current trace settings and its activity status. Navigate—touch the descriptor box once to activate the trace, again to open the setup dialog. Arrange—drag-and-drop descriptor boxes to move traces among grids.
- Page 23 Using MAUI Horizontal (time) cursor readout, including the time between cursors and the frequency, is shown beneath the TimeBase and Trigger descriptor boxes. See the Cursors section for more information. Dialogs Dialogs appear at the bottom of the display for entering setup data. The top dialog will be the main entry point for the selected functionality.
- Page 24 HDO8000A/MDA800A High-Definition Oscilloscope Operator's Manual Histogram, Trend, and Track buttons appear in the Action toolbar at the bottom of the Parameter (Pn) dialogs. They allow you to create a Math function to plot the parameter while remaining on the measurement dialogs. Message Bar At the bottom of the oscilloscope display is a narrow message bar.
-
Page 25: Maui With Onetouch
Using MAUI MAUI with OneTouch Touch, drag, swipe, pinch and flick can be used to create and change setups with one touch. Just as you change the display by using the setup dialogs, you can change the setups by moving different display objects. - Page 26 HDO8000A/MDA800A High-Definition Oscilloscope Operator's Manual Copy Setups To copy the setup of one trace to another of the same type (e.g., channel to channel, math to math), drag- and-drop the source descriptor box onto the target descriptor box. To copy the setup of a measurement (Pn), drag-and-drop the source column onto the target column of the Measure table.
- Page 27 Using MAUI Position Cursors To change cursor measurement time/level, drag cursor markers to new positions on the grid. The cursor readout will update immediately. To place horizontal cursors on zooms or other calculated traces where the source Horizontal Scale has forced cursors off the grid, drag the cursor readout from below the Timebase descriptor to the grid where you wish to place the cursors.
- Page 28 HDO8000A/MDA800A High-Definition Oscilloscope Operator's Manual Store to Memory To store a trace to internal memory, drag-and-drop its trace descriptor box onto the target memory (Mn) descriptor box. Move Trace To move a trace to a different grid, drag-and-drop the trace descriptor box onto the target grid. If you are in a multi-tabbed Q-Scape display mode, you can move traces between tabs this way.
- Page 29 Using MAUI Pan/Swipe Trace To pan a trace, activate it to bring it to the forefront, then drag the waveform trace right/left or up/down. If it is the source of any other trace, that trace will move, as well. For channel traces, the Timebase descriptor box will show the new Horizontal Delay value. For other traces, the zoom factor controls show the new Horizontal Center.
- Page 30 HDO8000A/MDA800A High-Definition Oscilloscope Operator's Manual Zoom To create a new zoom trace, touch then drag diagonally to draw a selection box around the portion of the trace you want to zoom. Touch the Zn descriptor box to open the zoom factor controls and adjust the zoom exactly.
-
Page 31: Working With Traces
Using MAUI Working With Traces Traces are the visible representations of waveforms that appear on the display grid. They may show live inputs (Cn, Digitaln, SEn), a math function applied to a waveform (Fn), a stored memory of a waveform (Mn), a zoom of a waveform (Zn), or the processing results of special analysis software. - Page 32 HDO8000A/MDA800A High-Definition Oscilloscope Operator's Manual Turning On/Off Traces Turn On/Off Analog Trace From the front panel, press the Channel button. From the touch screen, choose Vertical > Channel x Setup. You can also touch the Add New box and select Channel, or drag another Channel (Cn) descriptor box to the Add New box.
- Page 33 Using MAUI Adjusting Traces To adjust Vertical Scale (gain or sensitivity) and Vertical Offset, just activate the trace and use the front panel Vertical knobs. To make other adjustments—such as channel pre-processing or the math function rescaling—touch the trace descriptor box twice to open the appropriate setup dialog. Adjusting Trace Settings Many entries can be made by selecting from the pop-up that appears when you touch a control.
- Page 34 HDO8000A/MDA800A High-Definition Oscilloscope Operator's Manual Moving Traces Use any of these methods to move traces from grid to grid. See OneTouch Help for ways to pan traces within the same grid. Drag-and-Drop You can move a trace from one grid to another by dragging its descriptor box to the desired grid. This is a convenient way to quickly re-arrange traces on the display.
- Page 35 Using MAUI Labeling Traces The Label function gives you the ability to add custom annotations to the trace display. Once placed, labels can be moved to new positions or hidden while remaining associated with the trace. Create Label 1. Select Label from the context menu, or touch the Label Action toolbar button on the trace setup dialog.
-
Page 36: Zooming
HDO8000A/MDA800A High-Definition Oscilloscope Operator's Manual Zooming Zooms magnify a selected region of a trace by altering the Horizontal Scale relative to the source trace. Zooms may be created in several ways, using either the front panel or the touch screen. You can adjust zooms the same as any other trace using the front panel Vertical and Horizontal knobs or the touch screen zoom factor controls. - Page 37 Using MAUI Zn Dialog Behind the main Zoom dialog is a separate tab for each potential zoom trace (Z1-Zn). Each Zn dialog reflects the center and scale for that zoom. Use it to adjust the zoom magnification. Trace Controls Trace On shows/hides the zoom trace. It is selected by default when the zoom is created. Source lets you change the source for this zoom to any channel, math, or memory trace while maintaining all other settings.
- Page 38 HDO8000A/MDA800A High-Definition Oscilloscope Operator's Manual Creating Zooms Any type of trace can be zoomed by creating a new zoom trace (Zn) following the procedures here. Zoom traces open in the next empty grid, with the zoomed portion of the source trace highlighted. If there are no more available grids, zooms will open in the same grid as the source trace.
- Page 39 Using MAUI Adjust Zoom Scale The zoom's Horizontal units will differ from the signal timebase because the zoom is showing a calculated scale, not a measured level. This allows you to adjust the zoom factor using the front panel knobs or the zoom factor controls however you like without affecting the timebase (a characteristic shared with math and memory traces).
-
Page 40: Print/Screen Capture
HDO8000A/MDA800A High-Definition Oscilloscope Operator's Manual Print/Screen Capture The front panel Print button captures an image of the touch screen and outputs it according to your Print settings. It can be used to save a LabNotebook, create an image file of waveform traces, or send the image to a networked printer, etc. -
Page 41: Acquisition
Acquisition Acquisition The acquisition settings include everything required to produce a visible trace on screen and an acquisition record that may be saved for later processing and analysis: Vertical axis scale at which to show the input signal, and probe characteristics that affect the signal Horizontal axis scale at which to represent time, sampling mode and sampling rate Acquisition... -
Page 42: Vertical
HDO8000A/MDA800A High-Definition Oscilloscope Operator's Manual Vertical Vertical, also called Channel, settings usually relate to voltage level and control traces along the Y axis. Note: While Digital settings can be accessed through the Vertical menu on Mixed Signal oscilloscopes, they are handled quite differently. See Digital. The amount of voltage displayed by one vertical division of the grid, or Vertical Scale (V/div), is most quickly adjusted by using the front panel Vertical knob. - Page 43 Probe Attenuation values for third-party probes may be entered manually on the Cn dialog. The instrument will detect it is a third-party probe and display these fields. When a Teledyne LeCroy probe is connected to a channel input, the Attenuation field becomes a button to access the Probe dialog, a tab added to the right of the Cn tab.
- Page 44 HDO8000A/MDA800A High-Definition Oscilloscope Operator's Manual Rescale Settings The rescale settings provide the same capability as the Rescale math function (y=ax+b, where the original value is x, Units/V is a, and Add is b), only applied directly to the channel trace rather than to a separate function trace.
- Page 45 Acquisition used when performing high-precision voltage measurements and zooming with high vertical gain, for example. ERes is disabled. Inversion Invert changes the apparent polarity of the signal, substituting an equivalent negative value for a positive one, and vice versa, so that the waveform appears to be "flipped" on screen. Cable De-embedding Cable De-Embedding allows you to remove the effects of cables used in the test setup.
- Page 46 Auto Zero corrects for DC offset drifts that naturally occur from thermal effects in the amplifier of active probes. Teledyne LeCroy probes incorporate Auto Zero capability to remove the DC offset from the probe's amplifier output to improve the measurement accuracy.
- Page 47 Acquisition Sensor Setup If your system includes a SAM40 Sensor Acquisition Module (available for High Definition oscilloscopes), the Vertical menu will offer an option for PMU Sensor Menu. Choose this to open the Sensor Setup dialog. Similar to the Channel Setup dialog, Sensor Setup is a collection of all the available sensor inputs, allowing you to quickly enable/disable an input.
- Page 48 HDO8000A/MDA800A High-Definition Oscilloscope Operator's Manual Note: Channel inputs can be rescaled on the Cn dialog, while the output unit of measurement parameters and math functions can be changed using the Units subdialog that appears next to the respective Pn or Fn dialog. The same units of measure are supported.
-
Page 49: Digital (Mixed Signal)
Acquisition Digital (Mixed Signal) When a Mixed Signal device is connected to the oscilloscope, digital input options are added to the Vertical menu. There are set up dialogs for each possible digital group, Digital1 to Digitaln, which correspond to digital buses. You choose which lines make up each digital group, what they are named, and how they appear on the display. - Page 50 HDO8000A/MDA800A High-Definition Oscilloscope Operator's Manual Digital Setup Using Digital Leadset The digital leadset enables input of up-to-16 lines of digital data. Physical lines can be preconfigured into different logical groups, Digitaln, corresponding to a bus. The transitions for each line may be viewed through different displays.
- Page 51 Acquisition Digital Group Setup To set up a digital group: 1. From the menu bar, choose Vertical > Digitaln Setup, or press the front panel Dig button and select the desired Digitaln tab. 2. On the Digitaln set up dialog, check the boxes for all the lines that comprise the group. Touch the Right and Left Arrow buttons to switch between digital banks as you make line selections.
- Page 52 HDO8000A/MDA800A High-Definition Oscilloscope Operator's Manual Digital Display Setup Choose the type and position of the digital traces that appear on screen for each digital group. 1. Choose a Display Mode: Lines (default) shows a time-correlated trace indicating high, low, and transitioning points (relative to the Threshold) for every digital line in the group.
- Page 53 Acquisition Renumbering Digital Lines Labels can also be "swapped" between lines. This procedure helps in cases where the physical lead number is different from the logical line number you would like to assign to that input. It can save time having to reattach leads or reconfigure groups.
-
Page 54: Timebase
HDO8000A/MDA800A High-Definition Oscilloscope Operator's Manual Timebase Timebase (Horizontal) settings control traces along the X axis. The timebase is shared by all channels. The time represented by each horizontal division of the grid, or Time/Division, is most easily adjusted using the front panel Horizontal knob. Full Timebase set up is done on the Timebase dialog, accessed either by choosing Timebase >... - Page 55 Acquisition Sampling Rate These controls specify how the instrument samples when in Real Time mode. Maximum Sample Points is the number of samples taken per acquisition when you choose to Set Maximum Memory. It changes to show Sampling Rate, the number of samples taken per time division, when using a Fixed Sampling Rate.
- Page 56 HDO8000A/MDA800A High-Definition Oscilloscope Operator's Manual Sampling Modes The Sampling Mode determines how the instrument samples the input signal and renders it for display. Real Time Sampling Mode Real Time sampling mode is a series of digitized voltage values sampled on the input signal at a uniform rate.
- Page 57 Acquisition Note: Roll mode sampling is not available when using another form of digital interleaving. If processing time is greater than acquisition time, the roll mode buffer is overwritten. The instrument warns, "Channel data is not continuous in ROLL mode!!!" and rolling starts again. Sequence Sampling Mode In Sequence Mode sampling, the completed waveform consists of a number of fixed-size segments.
- Page 58 HDO8000A/MDA800A High-Definition Oscilloscope Operator's Manual Sequence Mode Set Up The Sequence dialog appears only when Sequence Mode sampling is selected. Use it to define the number of fixed-size segments to be acquired. 1. From the menu bar, choose Timebase > Horizontal Setup..., then Sequence Sampling Mode. 2.
- Page 59 Acquisition Viewing Sequence Segments When in Sequence sampling mode, you can view individual segments easily using the front panel Zoom button. A new zoom of the channel trace defaults to Segment 1. You can view other segments by changing the First and total Num(ber) of segments to be shown on the Zn dialog.
- Page 60 HDO8000A/MDA800A High-Definition Oscilloscope Operator's Manual Clock Source Settings An external reference clock (applied via the REF In input) is used to synchronize the instrument's internal timebase to an external frequency source. This allows multiple instruments to lock their timebases to a common source.
- Page 61 Acquisition History Mode History Mode allows you to review any acquisition saved in the history buffer, which automatically stores all acquisition records until full. Not only can individual acquisitions be restored to the grid, you can "scroll" backward and forward through the history at varying speeds to capture details or changes in the waveforms over time.
- Page 62 HDO8000A/MDA800A High-Definition Oscilloscope Operator's Manual Replay Acquisition History This is a good way to begin using History Mode. Watching a "movie" of the history allows you to see waveform changes that are invisible during real-time acquisition. Select View History to enable the display, then use the Navigation buttons or the slider bar at the bottom of the dialog to "scroll"...
-
Page 63: Trigger
Acquisition Trigger Triggers define the event around which digitized information is displayed on the grid. Different Trigger Types are used to select different events in the trigger source waveforms: edge voltages, pulse widths, high/low states, etc. These may be a single channel event or a complex pattern of events across several channels. - Page 64 HDO8000A/MDA800A High-Definition Oscilloscope Operator's Manual Trigger Types The Trigger Type sets the triggering conditions. Basic Types Edge triggers upon a achieving a certain voltage level in the positive or negative slope of the waveform. Width triggers upon finding a positive- or negative-going pulse width when measured at the specified voltage level.
- Page 65 Acquisition edge must cross the thresholds faster or slower than a selected period of time. Trigger Set Up To open the Trigger dialog, press the front panel Trigger Setup button or touch the Trigger descriptor box. Different controls will appear depending on the Trigger Type selected (e.g., Slope for Edge triggers).
- Page 66 HDO8000A/MDA800A High-Definition Oscilloscope Operator's Manual Level For analog triggers, enter the voltage Level at which the triggering condition must occur. Use the Find Level button to set the level to the signal mean. Trigger types that require multiple crossings to define the triggering condition—such as Window, SlewRate and Runt—...
- Page 67 Acquisition Patterns A triggering logic pattern may be set on digital lines, analog channels, or a combination of both. Digital Pattern A digital pattern is set on a single bus (group) manually or by applying a hexadecimal value, while the remaining lines are disabled ("Don't Care").
- Page 68 HDO8000A/MDA800A High-Definition Oscilloscope Operator's Manual Analog Pattern 1. On the Trigger dialog, select the Pattern trigger type. 2. Select the Boolean Operator that describes the relationship among analog inputs (e.g., C1 must be High AND C2 must be Low). 3. For each input in the trigger pattern, select what State it must be in compared to the threshold Level.
- Page 69 Acquisition Serial Trigger The Serial trigger type will appear if you have installed serial data trigger and decode options. Select the Serial type then the desired Protocol to open the serial trigger setup dialogs. For setup instructions, see the software instruction manual at teledynelecroy.com/support/techlib under Manuals >...
- Page 70 HDO8000A/MDA800A High-Definition Oscilloscope Operator's Manual Once you've selected the A and B events on the Qualified dialog, set up the conditions on the respective "Event" dialogs exactly as you would a single-stage trigger. QualFirst Trigger The QualFirst trigger, which is used in Sequence sampling mode, is set up exactly like the Qualified trigger.
- Page 71 Acquisition Positive Edge trigger with Holdoff by time counted from the last trigger time. Note: Because there is only one trigger per acquisition, the trigger event will always belongs to the new acquisition. The processing time shown here is for purposes of illustration only. Regardless of where in the acquisition record the trigger event was found (first edge or last), the display will show time pre- and post-trigger based on your Time/Div and Delay settings.
- Page 72 HDO8000A/MDA800A High-Definition Oscilloscope Operator's Manual Holdoff Set Up To add Holdoff to an Edge or Pattern trigger, touch the Trigger descriptor box or press the front panel Trigger Setup button, then open the Holdoff tab. Choose to Holdoff by Time (the clock) or Events. If using Holdoff by Time, enter the Time in S to wait before triggering.
- Page 73 Acquisition Software Assisted Trigger Software Assisted Trigger is used to find the trigger-level crossing point closest to the hardware trigger point. It then adjusts the time offset of the waveform so that it is aligned with the specified trigger level and slope.
- Page 74 HDO8000A/MDA800A High-Definition Oscilloscope Operator's Manual TriggerScan TriggerScan is a debugging tool that helps you quickly discover waveform anomalies by automating the process of building triggers designed to find rare events in an acquisition. Triggerscan trains the system by looking at acquired waveforms. During the training, TriggerScan analyzes the waveforms to determine what waveforms normally look like.
- Page 75 Acquisition 3. To delete a trigger from the list: highlight the trigger in the Trigger List, then touch the Delete Selected button. All trigger setups can be deleted in one step by touching the Delete All button. 4. Optionally: Enter a Dwell Time the time instrument should wait before loading the next trigger. Check Stop On Trigger.
- Page 76 HDO8000A/MDA800A High-Definition Oscilloscope Operator's Manual...
-
Page 77: Display
Display Display Display settings affect the number and style of grids that appear on screen and some of the visual characteristics of traces, such as persistence. The oscilloscope features multi-grid display, where each separate grid represents the full number of 4096 vertical levels. - Page 78 HDO8000A/MDA800A High-Definition Oscilloscope Operator's Manual A Q-Scape Mosaic display mode configured with different grid modes in each tab.
-
Page 79: Display Set Up
Display Display Set Up To access the Display dialog, choose Display > Display Setup. Q-Scape Display Mode On instruments with Q-Scape display, the Display Mode determines the number and layout of display tabs. Q-Scape Display. Grid Mode The Grid Mode setting determines the number and layout of display grids, each of which represents the full number of vertical levels. - Page 80 HDO8000A/MDA800A High-Definition Oscilloscope Operator's Manual Grid Intensity To dim or brighten the background grid lines, touch Grid Intensity and enter a value from 0 to 100. Grid on top superimposes the grid over the waveform. Note: Some waveforms may be hidden from view with the grid on top. Axis labels display the values represented by each division of the grid, based on your vertical scale and timebase.
-
Page 81: Q-Scape Display
Display Q-Scape Display Q-Scape divides the screen into multi-tab displays that can each be configured with different multi-grid display modes. Display Mode The Display Mode setting determines the number and layout of display tabs, each of which can in turn have different numbers and styles of grids within them. - Page 82 HDO8000A/MDA800A High-Definition Oscilloscope Operator's Manual In Q-Scape modes, channel, math, memory, and zoom descriptors appear in the tab where the trace is open, while Timebase and Trigger descriptors remain outside the tabs, since they are not associated with any one trace. Note: If you switch from Normal mode into any Q-Scape mode, all traces will move to Tab 1, from which you can drag-and-drop to redistribute them to other grids.
-
Page 83: Persistence Display
Display Persistence Display The Persistence feature retains waveform traces on the display for a set amount of time before allowing them to gradually "decay," similar to the analog-style display of old, phosphor screen oscilloscopes. The display is generated by repeated sampling of events over time and the accumulation of the sampled data into "persistence maps". - Page 84 HDO8000A/MDA800A High-Definition Oscilloscope Operator's Manual 3d Mode persistence creates a topographical view of your waveform from a selection of shadings, textures, and hues. The advantage of the topographical view is that areas of highest and lowest intensity are shown as peaks and valleys, in addition to color or brightness. The shape of the peaks (pointed or flat) can reveal further information about the frequency of occurrences in your waveform.
-
Page 85: Cursors
Cursors Cursors Cursors are markers (lines, cross-hairs, and arrows) that identify horizontal and vertical values where they intersect the X or Y axis. Use cursors to make fast, accurate measurements of points on the waveform. The equations in this section use the following notational conventions: X1 and X2 = cursor and/or value where cursor intersects x-axis Y1 and Y2 = cursor and/or value where cursor intersects y-axis y@X1= vertical value at point where X1 cursor intersects source trace... - Page 86 HDO8000A/MDA800A High-Definition Oscilloscope Operator's Manual The Horizontal Abs(olute) cursor displays a single line, X1. The readout below the Timebase and Trigger descriptors shows the horizontal value where X1 intersects the x-axis, in whatever is the x-axis unit of the source trace. The readout on the source trace descriptor box shows the vertical value where X1 intersects the source trace, y@X1, in whatever is the y-axis unit of the source trace.
- Page 87 Cursors Vertical Cursors Vertical cursors intersect the y-axis and show the vertical value at that point (e.g., a voltage). These cursors can go "off trace" to show vertical scale values that are not represented in the acquisition. Vertical cursors have no horizontal readout below the Timebase descriptor, as they do not have an x-axis element. As they are set by divisions, they remain in the same position and do not "readjust"...
-
Page 88: Apply And Position Cursors
HDO8000A/MDA800A High-Definition Oscilloscope Operator's Manual Apply and Position Cursors To turn on cursors, either: From the menu bar, choose Cursors and select the desired cursor type from the drop-down list. On the front panel, press the Cursor button to turn on cursors, then continue pressing to cycle through all the cursor types. -
Page 89: Standard Cursors Dialog
Cursors Standard Cursors Dialog These controls can be used instead of the front panel controls to turn on cursors or to refine the cursor position. Access the dialog by choosing Cursors > Cursors Setup from the menu bar. Cursor Type buttons select the type of cursor displayed on the grid. The Show controls determine what values are shown in the vertical readout when using relative cursors: Absolute shows specific voltages for the two cursor locations. - Page 90 HDO8000A/MDA800A High-Definition Oscilloscope Operator's Manual...
-
Page 91: Measure
Measure Measure Parameters are tools that give you access to a wide range of waveform properties, such as Rise Time, RMS voltage and Peak-Peak voltage. The instrument offers a quick selection of standard parameters, or you can create a user-defined set of parameters (My Measure) drawn from all available measurements. On instruments equipped with CustomDSO (XDEV), custom scripts may be used to calculate a parameter. -
Page 92: Measure Dialog
HDO8000A/MDA800A High-Definition Oscilloscope Operator's Manual Measure Dialog The Measure Dialog gives quick access to measurement features. Besides turning on/off parameters, use the Measure dialog to display statistics, histicons help markers for standard and user-defined parameter sets. You can also gate the standard parameter sets to limit the horizontal scope of the measurement. - Page 93 Measure Statistics Checking Statistics On on the Measure dialog adds the mean, min, max and sdev of each parameter to the measured value shown on the Measure table. Statistics for each parameter are calculated once per acquisition and accumulate until you either Clear Sweeps or the measurement buffer is full.
- Page 94 HDO8000A/MDA800A High-Definition Oscilloscope Operator's Manual Gating Measurements All measurements are calculated on only that portion of the waveform trace that is visible on the grid and within the measurement gates. Any setting that moves the trace outside the observation window or makes it appear "clipped"...
- Page 95 Measure Help Markers Help Markers clarify measurements by displaying lines, labels and hysteresis bands to mark the points being measured on the trace. For "@Level" parameters, markers make it easier to see where your waveform intersects the chosen level. If you change the set of parameters displayed, the markers will change, as well.
-
Page 96: Parameter Set Up
HDO8000A/MDA800A High-Definition Oscilloscope Operator's Manual Parameter Set Up Use the Pn dialogs to define a new set of measurement parameters ("My Measure"). 1. From the menu bar, choose Measure > Measure Setup. 2. Choose Measure Mode My Measure. 3. Open the Pn dialog and check On to activate the parameter. 4. - Page 97 Measure For two-input parameters, such as Dtime@level, you can specify the Slope used for each input separately to determine the points on each waveform to be compared. There are three possible settings for Slope: Positive, use the rising edge of a pulse Negative, use the falling edge of a pulse Both, use either edge, whichever next occurs that meets the other criteria Here, the P1 Half Period parameter uses a Slope of Both, resulting in 10 measurements in this five period...
- Page 98 HDO8000A/MDA800A High-Definition Oscilloscope Operator's Manual Level Level is the point on the Vertical (Y) axis used to take a measurement. The default Level for measurements is 0 V or 50% amplitude, the center grid line when there is no Vertical Offset . When Level can be specified, it can usually be set as either: An Absolute number of Volts, or whatever is the vertical unit of the source waveform A Percent of waveform amplitude, as determined by the Top-Base calculation...
- Page 99 Measure Periodic and Cyclic Measurements Some measurement set up dialogs display a checkbox for Show one value per period or Cyclic. Per period measurements compute one measurement per full waveform period in the acquisition. The value returned is the mean of all the per period measurements. Usually, per period is an option for Vertical parameters, like Amplitude, that would normally compute only one measurement per acquisition.
- Page 100 HDO8000A/MDA800A High-Definition Oscilloscope Operator's Manual Counting Periods/Cycles Per period and cyclic measurements are subject to the other measurement settings, such as the Slope and Level from which to count the waveform periods. Always visit the subdialogs that appear when checking Show one value per period or Cyclic to determine if there are further settings to be made. When the measure gates are in their default positions of 0 and 10 div, the periods/cycles are counted across the full width of the grid.
- Page 101 Measure Note that although the Help Markers overlay the first two periods, the measurement value of -1.686 ns reported is actually the final measurement comparing the last two periods, as would be shown by looking at a WaveScan of the same acquisition. When the Dperiod@level Group Size is changed to 2, the measurement is taken every other period, and because only two measurements can be made out of the five period total (periods 1 to 3 and 2 to 4), the P1 Num changes to 2.
- Page 102 HDO8000A/MDA800A High-Definition Oscilloscope Operator's Manual Dperiod@level also allows you to also specify how the Group Size interval is treated, as a separator or a summation. Use One Value Per Group (shown above) measures every nth cycle, the first in each group. Sum All Values in Group (shown below) calculates the sum of all the cycles in the group and compares it to that of the next group.
- Page 103 Measure 2. On the Accept subdialog, select Values In Range and enter the start and stop values, or touch the Find Range button to quickly display the most recently measured range of values. Note: The correct units for the measurement (V, s, Hz, dB, etc.) are automatically displayed. If you select a simple ratio parameter that yields a dimensionless number (such as power factor), units are omitted.
-
Page 104: List Of Standard Measurements
HDO8000A/MDA800A High-Definition Oscilloscope Operator's Manual List of Standard Measurements Note: Unless otherwise stated, measurements are calculated according to IEEE standards. Additional measurements may be available depending on the software options installed. The keyword to use in remote control programs appears in Summary on the Pn dialog. Waveform Measurements Amplitude Difference between the upper and lower levels in two-level (bi-modal) signals. - Page 105 Measure Delta Delay Time from the first 50% level crossing of Source1 to the first 50% level crossing of Source2. Delta Delay can be used to measure the propagation delay between two signals by triggering on one and measuring the Delay of the other. It may yield a negative result in cases where the Source2 crossing occurs before the Source1 crossing.
- Page 106 HDO8000A/MDA800A High-Definition Oscilloscope Operator's Manual Edge to Edge Time from the specified edge on Source1 to the specified edge on Source2. Edge@level Number of edges in waveform that cross the specified threshold Level, measured on rising edges (Pos Slope), falling edges (Neg Slope), or next crossing (Both Slope). See Slope, Level and Hysteresis.
- Page 107 Measure (Pos Slope), from only falling edges to rising edges (Neg Slope), or from every crossing to the next (Both Slope). See Slope, Level and Hysteresis. Hold Time Time from the first data signal edge at specified slope and level (Source2), to nearest previous clock signal edge at specified slope and level (Source1).
- Page 108 HDO8000A/MDA800A High-Definition Oscilloscope Operator's Manual Overshoot- Amount of overshoot following falling edges, represented as percentage of amplitude. Overshoot- is calculated using the formula (Base - Minimum)/Amplitude x 100. On signals that do not have two major levels (e.g., triange waveforms), this measurement may not give predictable results. Overshoot+ Amount of overshoot following rising edges, represented as a percentage of amplitude.
- Page 109 Measure Rise@level Duration of a pulse waveform's rising edge between user-defined transition levels, averaged for all rising edges between the measurement gates. The two values used to compute the rise time are calculated as: Low = lower threshold x Amplitude/100 + Base High = upper threshold x Amplitude/100 + Base Slope, Level and Hysteresis.
- Page 110 HDO8000A/MDA800A High-Definition Oscilloscope Operator's Manual TIE@level Difference between the measured crossing time at the specified slope and level and the ideal expected time. The measurement may be given in time (S) or unit interval (UI). A UI equals one clock period. The Virtual Clock (set up on the VClock subdialog) enables you to simulate your choice of Standard (1.544 MHz) or Custom reference clocks.
- Page 111 Measure Histogram Measurements These measurements can be made on histogram math functions. You will receive an error status if you attempt to place them on a pulse waveform or other incompatible source. FWXX Full Width at xx%, width of the largest area histogram peak at a user-specified percentage of the population of the highest peak.
- Page 112 HDO8000A/MDA800A High-Definition Oscilloscope Operator's Manual Hist range The Max-to-Min range of a histogram. Hist rms Root mean square of the values in a histogram. Hist sdev Standard deviation of the values in a histogram. Hist top Value of the right-most histogram peak. Hist X@peak Value of the nth highest histogram peak.
- Page 113 Measure Custom Measurements These "measurements" enable you to insert a custom script into the oscilloscope process and read back results into the parameter in real time.The script must yield a numeric result. Custom measurements are standard on WaveMaster, LabMaster, DDA and SDA models. They are enabled with the XDEV option on others.
-
Page 114: Measure Table
HDO8000A/MDA800A High-Definition Oscilloscope Operator's Manual Measure Table Parameter readouts (P1-Pn) appear in a table below the grid. The value row shows the measurements taken for each parameter on the last acquisition. Optional statistics and histicons can be added to the Measure table readout. -
Page 115: Parameter Math
Measure Parameter Math In addition to measuring waveforms, you can set up a parameter that performs mathematical operations on the results of other parameters. Parameter math differs from math functions in that the input and the output are still numerical values that display in the Measure table. Math functions, on the other hand, input and output waveform traces that appear on the grid. - Page 116 HDO8000A/MDA800A High-Definition Oscilloscope Operator's Manual 1. Choose Measure > Measure Setup from the menu bar. 2. Touch the Pn tab of the output parameter to display the parameter setup dialog. 3. Touch the Math on Parameters button. 4. Touch Math Operator and choose P Script. 5.
-
Page 117: Using Web Editor
Measure Using Web Editor Whereas with Parameter Math you can apply a single math operation to measurement parameters, the Web Editor enables you to create processes that chain many operations on multiple inputs, including custom math and measurements (with the XDEV option), and yield multiple outputs. These processes are integral to the operation of the instrument;... - Page 118 HDO8000A/MDA800A High-Definition Oscilloscope Operator's Manual 5. On the Source Filter subdialog, deselect any types (e.g., zooms) that you do not want to use in the process. This simplifes the display and reduces the need to scroll. 6. On the Wed Editor dialog, choose the type of process to add to the flow. You can Add Math, Add Measure, or Add Param Math.
- Page 119 Measure 10. Continue to add processes as needed, pinning the output of each block to the input of the next block in the flow. The final process should be the same type as the terminal (in this example, a measurement). Tip: The color of the input/output arrows indicates which connections are compatible.The flow does not need to be strictly sequential, as many processes can accept inputs that have undergone other processes.
-
Page 120: Using Histograms
HDO8000A/MDA800A High-Definition Oscilloscope Operator's Manual Using Histograms Histograms display the statistical distribution of parameter values using bars of varying heights to represent measurement frequency. The Histogram math function plots the number of parameter measurements that fall within a small range, known as a bin, as a function of the parameter value. Each bin is represented by a bar on the chart. - Page 121 Measure Measuring rise time, setup / hold time, and propagation delay of electronic devices Detecting and diagnosing circuit problems, such as crossover distortion Histogram Calculation Histograms are calculated on the portion of the waveform within the acquisition window and the measurement gates, just as are the parameters.
- Page 122 HDO8000A/MDA800A High-Definition Oscilloscope Operator's Manual Histogram Buffer Enter the maximum #Values in one bin of the histogram. This determines the total number of measurements that are represented by a bar at full height. Once this number is reached, the histogram will be rescaled according to the Vertical Scale method selected, as it continues to accumulate data.
- Page 123 Measure Width should be to ensure that values will distribute across the histogram, showing a meaningful deviation from center. When the ideal range required to form a good distribution is not apparent, the instrument's range finding function, Find Center and Width, can be used to calculate an optimal range and redraw the histogram using it.
-
Page 124: Using Trends
HDO8000A/MDA800A High-Definition Oscilloscope Operator's Manual Using Trends The Trend math function plots a waveform composed of parameter measurements arranged in the order the measurements were made. The vertical units are the source parameter values, and the horizontal unit is the measurement number. The Trend contains a single value for each unique measurement, and therefore may not be time synchronous with the source waveform. -
Page 125: Using Tracks
Measure Using Tracks A Track is a waveform composed of parameter measurements that are time synchronous with the source waveform. The vertical units are those of the source parameter and the horizontal units are seconds. Due to the time synchronization, the number of points in the Track function is identical to the number of samples in the source waveform, and a Track is limited to the samples in a single acquisition. -
Page 126: Track Vs. Trend
HDO8000A/MDA800A High-Definition Oscilloscope Operator's Manual Track vs. Trend The table below summarizes the differences between Track and Trend. Track Trend (Parameter value vs. time) (Parameter value vs. event) Cumulative? No, resets after every acquisition Cumulative over unlimited number of acquisitions, up to two billion events Time correlates to other data? Yes Monitors Frequency domain? No, points are not evenly spaced in time... -
Page 127: Math
Math Math Math function traces (Fn) display the result of applying a mathematical operation to a source trace. The output of a math function is always another trace, whereas the output of a measurement parameter is a tabular readout of the measurement. Math can be applied to any channel (Cn), zoom (Zn), or memory (Mn) trace. - Page 128 HDO8000A/MDA800A High-Definition Oscilloscope Operator's Manual 3. Choose a single f(x) or dual g(f(x) operator function. You can also choose Web Edit, in which case this function is added as a terminal to the processing web. See the instructions for Using Wed Edit to set up the function.
-
Page 129: List Of Standard Math Operators
Math List of Standard Math Operators Note: There may be additional operators available depending on the software options installed on the oscilloscope. The keyword to use in remote control programs appears in Summary on the Fn dialog. Standard Operators Absolute Calculates distance away from zero for every point in the waveform. - Page 130 HDO8000A/MDA800A High-Definition Oscilloscope Operator's Manual ERes Applies a noise reduction and smoothing filter by adding a specified number of bits. See Enhanced Resolution. Calculates the antilog to the base e of the source; that is, e raised to the power equal to the source. Exp10 Same as Exp, using base 10.
- Page 131 Math Log10 Performs a log base 10 of a waveform. Values less than or equal to zero are set to underflow. Phistogram Creates a histogram based on the displayed pixels of a persistence map falling within a user-defined vertical and/or horizontal box (slice). The source trace must have Persistence turned "on." Product For every point in the waveform, the value of Source1 is multiplied by the value of Source 2.
- Page 132 HDO8000A/MDA800A High-Definition Oscilloscope Operator's Manual Sinx/x Performs 10-to-1 interpolation using a Sin(x)/x filter. Sparse “Thins,” or decimates, an incoming acquisition by dropping sample points at regular intervals. Sparsing Factor specifies the number of points to drop between retained samples (e.g., factor of 4 retains 1 then drops 4).
- Page 133 Math Custom Math Operators These "operators" enable you to insert a custom script into the oscilloscope process and view the resulting waveform in real time. Excel math Custom math performed in Excel. The operator will transfer one or two waveforms (as a series of time- value pairs) into an Excel spreadsheet and display the resulting waveform.
-
Page 134: Average Function
HDO8000A/MDA800A High-Definition Oscilloscope Operator's Manual Average Function The summed or continuous average of all data samples from multiple acquisitions can be displayed as a new waveform trace using the Average function. Setting Up Averaging To apply Continuous or Summed Averaging as a Math function: 1. -
Page 135: Copy Function
Math By setting a Sweeps value, you establish a fixed weight that is assigned to the old average once the number of sweeps is reached. For example, for a sweeps (weight) value of 4: Sweep New Average = 1 (no old average yet) (new data +0 * old average)/(0 + 1) = new data only (new data + 1*old average)/(1 + 1) = 1/2 new data +1/2 old average (new data + 2 * old average)/(2 + 1) = 1/3 new data + 2/3 old average... -
Page 136: Eres Function
HDO8000A/MDA800A High-Definition Oscilloscope Operator's Manual ERes Function ERes (Enhanced Resolution) filtering increases vertical resolution, allowing you to distinguish closely spaced voltage levels. The instrument's ERes function is similar to smoothing the signal with a simple, moving-average filter, but is more efficient concerning bandwidth and pass-band filtering. Use ERes: On single-shot acquisitions or where the data record is slowly repetitive (and you cannot use averaging). - Page 137 Math With low-pass filters, the actual SNR increase obtained in any particular situation depends on the power spectral density of the noise on the signal. The improvement in SNR corresponds to the improvement in resolution if the noise in the signal is white (evenly distributed across the frequency spectrum).
-
Page 138: Fast Wave Port Function
HDO8000A/MDA800A High-Definition Oscilloscope Operator's Manual Fast Wave Port Function Fast Wave Port is an Advanced Customization (XDEV) function of Teledyne LeCroy X-Stream oscilloscopes that enables you to insert a custom algorithm written in the C/C++ language into the oscilloscope's processing stream. It also maximizes data throughput from the acquisition system to your custom algorithm for purposes of debugging or external processing. -
Page 139: Fft Function
Math FFT Function For a large class of signals, you can gain greater insight by looking at spectral representation rather than time description. Signals encountered in the frequency response of amplifiers, oscillator phase noise and those in mechanical vibration analysis, for example, are easier to observe in the frequency domain. If sampling is done at a rate fast enough to faithfully approximate the original waveform (usually five times the highest frequency component in the signal), the resulting discrete data series will uniquely describe the analog signal. - Page 140 HDO8000A/MDA800A High-Definition Oscilloscope Operator's Manual Window Type Applications and Limitations Rectangular Normally used when the signal is transient (completely contained in the time-domain window) or known to have a fundamental frequency component that is an integer multiple of the fun- damental frequency of the window.
-
Page 141: Interpolate Function
Math Interpolate Function The Interpolate operator enables you to generate a trace that interpolates data points into the source trace according to your selected method and upsampling factor. Linear interpolation, which inserts a straight line between sample points, is best used to reconstruct straight-edged signals such as square waves. -
Page 142: Rescale Function
HDO8000A/MDA800A High-Definition Oscilloscope Operator's Manual Rescale Function The Rescale function allows you to create a new function trace that rescales another trace by applying a multiplication factor (a) and additive constant (b). You can also use it as a way to view the function source in a different unit of measure. - Page 143 Math Note: These same mnemonics can be used in remote control programs and customization scripts. Specify only the base unit in code, do not add prefixes. Note: Time and dimensionless units are available only for certain measurements and for use in code where relevant.
- Page 144 HDO8000A/MDA800A High-Definition Oscilloscope Operator's Manual Category Unit Mnemonic Pressure Pascal atmosphere, technical atmosphere, standard Torr TORR pounds/square inch Temperature degrees Kelvin degrees Celsius degrees Fahrenheit Energy Joule British Thermal Unit calorie Rotating Machine radians/second RADPS frequency (Hertz) revolutions/second revolutions/minute torque N•m torque in•oz INOZ torque in•lb...
- Page 145 Math Category Unit Mnemonic Electrical Ampere Volt Watt power, apparent power, reactive power factor capacitance (Farad) Coulomb Siemen electrical field strength electrical displacement field CPM2 permittivity FARADPM conductivity SIEPM Time second minute hour HOUR week WEEK...
- Page 146 HDO8000A/MDA800A High-Definition Oscilloscope Operator's Manual Category Unit Mnemonic Dimensionless percent percent min-max PCTMNMX decibel decibel milliwatt decibel Volt decibel millivolt DBMV decibel microvolt DBUV decibel microampere DBUA decibel referred to carrier decade DECADE unit interval Q-scale byte BYTE baud BAUD least significant bit poise POISE...
-
Page 147: Phistogram Function
Math Phistogram Function The Phistogram function creates a histogram of the samples within a vertical or horizontal "slice" of a persistence map to reveal the features that are only visible when several acquisitions have been superimposed on one another. Vertically, each bin contains a class of similar amplitude levels; horizontally, each bin contains a class of similar time values. -
Page 148: Ptrace Functions
HDO8000A/MDA800A High-Definition Oscilloscope Operator's Manual Ptrace Functions The Ptrace Mean, Ptrace Range, and Ptrace Sigma math functions (found in the Jitter Functions sub- menu of the Math Operator selector) compute a vector trace based on a persistence map of underlying signal acquisitions without destroying the underlying raw data. -
Page 149: Math Dialog
Math Math Dialog Once a math function has been created and saved on the Function (Fn) dialog, use the main Math dialog to quickly enable/disable it. You can also use this dialog to quickly turn on/off zoom traces. To open the Math dialogs, touch the front panel Math button, or from the menu bar choose Math > Math Setup. - Page 150 HDO8000A/MDA800A High-Definition Oscilloscope Operator's Manual...
-
Page 151: Memory
Save (External) Waveform Files to Memory Trace (.trc) files saved on other Teledyne LeCroy instruments can also be saved to internal memory. Use the Recall Waveform function to save external files to memory. Then, you can use the Memories dialog restore them to the touch screen. -
Page 152: Restoring Memories
HDO8000A/MDA800A High-Definition Oscilloscope Operator's Manual Restoring Memories The Memories dialog is a convenient panel for restoring saved memories to the display. Access the Memories dialog by pressing the front panel Mem button or choosing Math > Memory Setup. Check On next to the memory trace you wish to display. A description of the memory showing the source channel and creation time appears next to each Mn on the dialog. -
Page 153: Analysis Tools
Analysis Tools Analysis Tools The Analysis menu tools complement the standard math and measurements to help you understand the behavior of waveforms. WaveScan searches single or multiple acquisitions for events that meet specific criteria. Pass/Fail Testing shows whether waveforms or measurements meet a set of defined criteria. CustomDSO (XDEV) enabes you to insert custom VBScript (VBS) or 3rd-party programs such as Excel™, Mathcad™, and MATLAB™... - Page 154 HDO8000A/MDA800A High-Definition Oscilloscope Operator's Manual Setting Up WaveScan Set up your source channel and triggers before setting up the scan. 1. Press the front panel Stop button to stop acquisition. 2. Choose Analysis > WaveScan. 3. Check Enable. 4. Choose the Source waveform. 5.
- Page 155 Analysis Tools Non-monotonic Mode Non-monotonic Mode looks for edges that cross a threshold more than once between high and low levels. All events that meet the criteria of slope, hysteresis, and level are presented in a table and highlighted in the source trace.
- Page 156 HDO8000A/MDA800A High-Definition Oscilloscope Operator's Manual Serial Pattern Mode Serial Pattern Mode is used for finding 2- to 64-bit patterns in digital sequences. It is ideal for bursted patterns where a PLL cannot lock. Serial Pattern Mode settings are: Viewing. Choose to enter the pattern as Binary or Hex(adecimal). Binary/Hex.
- Page 157 Analysis Tools Scan Overlay To apply monochromatic persistence to a Scan Overlay: 1. Select Scan Overlay when setting up the wave scan, then open the Scan Overlay dialog. 2. Check Persistence On. 3. Enter a Saturation level as a percentage. All samples above the saturation level are assigned the highest color intensity.
- Page 158 HDO8000A/MDA800A High-Definition Oscilloscope Operator's Manual WaveScan Search Search is used to find events in traces—usually zoom (Zn) traces—that match user-defined criteria. To search within WaveScan: 1. Select the Zoom view. 2. After stopping the acquisition, open the WScanZ1 dialog that appears behind the WaveScan dialog. 3.
-
Page 159: Pass/Fail Testing
Analysis Tools PASS/FAIL Testing PASS/FAIL testing allows you to define a set of qualifying conditions that an acquisition may "PASS" or "FAIL" when tested against, then take actions depending on the result. Mask testing compares sampled values to a pre-defined area of the grid (the "mask") to see if they fall within or without. - Page 160 HDO8000A/MDA800A High-Definition Oscilloscope Operator's Manual 1. Open the Make Mask subdialog. 2. If desired, enter a new Destination File Name and path, or touch Browse and select a previous file to overwrite. The file name should end with the .msk extension. 3.
- Page 161 Analysis Tools Param(eter) Compare PASS/FAIL queries (Qn) can be configured to compare different parameter measurements (Pn) to each other, or to a user-defined limit or statistical range. The Summary field shows the logic represented by the query. Check it to ensure your selections are producing the test you want. Comparing a Measurement to a Limit This method compares the result of a selected parameter to a user-defined limit or statistical range.
- Page 162 HDO8000A/MDA800A High-Definition Oscilloscope Operator's Manual Define PASS/FAIL Tests The queries define the conditions that, if met, would result in "true" but don't in themselves determine the test result. You must separately define what constitutes a "PASS" or a "FAIL" on the Actions dialog. A PASS or FAIL result can be made to produce various additional actions, such as sending a pulse to another device.
-
Page 163: Spectrum Analyzer
Spectrum Analyzer is standard on HDO6000, HDO8000, and MDA800 oscilloscopes. It is optional on other models. Set Up Spectrum Trace 1. Choose Analysis > Spectrum Analyzer. On the Spectrum Analyzer dialog, be sure Enabled is checked so that the spectrum trace is displayed. - Page 164 HDO8000A/MDA800A High-Definition Oscilloscope Operator's Manual The remainder of the steps are optional. 4. Adjust the resolution by unchecking Auto (the default) and entering a new Resolution BW. Note: Changing Resolution Bandwidth in FFT mode is equivalent to changing the Timebase to increase or decrease memory.
- Page 165 Analysis Tools Peaks and Markers Two special annotations/overlays help you find frequencies of interest in the spectrum trace. Peaks The peaks features is an automatic and continuous identification of waveform peaks. As the range of frequencies measured changes, peak values are recalculated and markers are moved. The values tabulated are always absolute values for the marked peak.
- Page 166 HDO8000A/MDA800A High-Definition Oscilloscope Operator's Manual Markers You can apply up-to-20 markers to frequencies of interest. Unlike peaks (which change dynamically), markers remain in place unless you manually re-assign them to a different frequency. However, you can associate different measurements with the markers, and new values are automatically calculated and added to the tabular display.
- Page 167 Analysis Tools To reassign markers: 1. Select the marker from the table or from the Marker pop-up menu. This is now the Active Marker, indicated by a thin, dashed cursor line, and all Marker Controls apply to this marker. 2. To move the marker to: The Next Peak in either direction, touch the Left/Right Arrow.
- Page 168 HDO8000A/MDA800A High-Definition Oscilloscope Operator's Manual Display Spectrogram The spectrogram is a 2D or 3D rendering of the historical data, up-to-256 spectra displayed in a vertically stacked display. The spectrogram can be shifted/rotated on any of its two or three axes and can be generated in colorized or monochrome versions to more easily visualize high-occurrence samples.
-
Page 169: Saving Data (File Functions)
Note: Only traces saved in Teledyne LeCroy proprietary formats can be recalled to the display. Use the Binary format (.trc) for analog waveforms, or WaveML (.xml) for digital waveforms. - Page 170 3. Choose the Source waveform. To quickly save all displayed waveforms separate trace files, touch the All Displayed button. 4. Select a file Format. Binary is Teledyne LeCroy's .trc file format. Binary results in the smallest possible file size. Binary files can be converted to ASCII using Teledye LeCroy utilities such as WaveStudio.
- Page 171 Saving Data (File Functions) Save Setup You can quickly save oscilloscope configurations to one of the internal setup panels or to a LeCroy System Setup (.lss) file, a text-based Automation program. Setups can be easily recalled to restore the oscilloscope to the saved state. Save Setup to Memory 1.
- Page 172 HDO8000A/MDA800A High-Definition Oscilloscope Operator's Manual Save Table The Save Table function saves tabular measurement data displayed on screen to an Excel or ASCII file. 1. From the menu bar, choose File > Save, then choose Table. 2. To save only one of the tables displayed, touch Source and navigate to the selection. By default, data from all visible tables are saved to separate files.
- Page 173 Saving Data (File Functions) Save Screen Image The full touch screen display or selected portions of it can be captured, saved to an image file, and marked with custom annotations. 1. From the menu bar, choose File > Save, then choose Screen Image. 2.
- Page 174 HDO8000A/MDA800A High-Definition Oscilloscope Operator's Manual Auto Save Data that appears on the oscilloscope display, such as waveforms, measurement readouts and decoder data, can be very dynamic and difficult to read from the oscilloscope unless you stop the acquisition. Auto Save enables you to automatically store waveform and table data to file with each new trigger. The file can later be recalled to the oscilloscope or saved permanently to external storage.
-
Page 175: Recall
Saving Data (File Functions) Recall Setups saved to internal memory or to .LSS file can be recalled to restore the oscilloscope to the saved state. Waveform data stored to .TRC or .XML files can be recalled into a memory and from there restored to the screen. - Page 176 HDO8000A/MDA800A High-Definition Oscilloscope Operator's Manual Recall Setup Choose File > Recall Setup... from the menu bar. Recall Setup from Memory 1. Choose to Recall From Memory. 2. Touch one of the six Recall buttons under Recall From Internal Setup..Note: If a setup has been stored to a location, it is labeled with the save date/time. Otherwise, the slot is labeled Empty.
-
Page 177: Labnotebook
Saving Data (File Functions) LabNotebook The LabNotebook feature allows you to create and save composite files containing a screen capture of all displayed waveforms, as well as all waveform and setup data at the time of capture. The Flashback feature instantly recalls the setups and waveforms stored with LabNotebook Entries, enabling you to restore the exact state of the instrument at a later date to perform additional analysis. - Page 178 HDO8000A/MDA800A High-Definition Oscilloscope Operator's Manual 5. The system will auto name the file "MyLabNotebook" followed by a counter number. To change this to something more descriptive, or to change the file path, enter the name in LabNotebook Entry, or touch Browse and use the File Browser.
- Page 179 Saving Data (File Functions) Tool Function More Activates a Custom line color field. The default color is Yellow. To choose another, touch the color swatch, then select from the Color dialog. You can enter RGB values, or choose from the spec- trum.
- Page 180 HDO8000A/MDA800A High-Definition Oscilloscope Operator's Manual Recall and Preview 1. Enter the path to the file in LabNotebook Entry, or touch Browse and navigate to the file. 2. Touch View On/Off to open it in the Preview window. 3. While the file is in preview, you may Edit Description, Annotate Screen...
- Page 181 Saving Data (File Functions) Manage Attachments To append external files to the LabNotebook composite (such as images of the DUT, mask files, test scripts, or anything relevant to the entry): 1. Browse to and select the LabNotebook Entry. If the file is in the Selected Folder, just use the Up/Down Arrow keys to select it.
-
Page 182: Report Generator
HDO8000A/MDA800A High-Definition Oscilloscope Operator's Manual Report Generator The Report Generator feature allows you to output a preformatted report consisting of an annotated screen image and a summary of the setups in place when it was captured. The report can be sourced from an existing LabNotebook, or it can be newly generated from the current state of the oscilloscope. -
Page 183: Share
Saving Data (File Functions) From Current State If you are creating a report from the current state of the instrument, the procedure is much like that above, except that you will also be able to enter a new Description, Annotate Screen Image, and select your capture Area/Color Preferences as you would normally do when first creating a LabNotebook. -
Page 184: Print
HDO8000A/MDA800A High-Definition Oscilloscope Operator's Manual Print Print dialog settings control how the oscilloscope's Print function behaves. This includes the front panel Print buttons, as well as the File > Print option. Print captures an image of the touch screen display, but there are several options as to what it does next with the image: Send it to a Printer Copy it to the Windows Clipboard... -
Page 185: Email & Report Settings
Saving Data (File Functions) Email & Report Settings This dialog contains additional settings used by the File Sharing and Report Generator functions. Email Settings 1. Select to use MAPI or SMTP. 2. If you chose SMTP, touch SMTP Server and enter the network address of your mail server. 3. -
Page 186: Using The File Browser
HDO8000A/MDA800A High-Definition Oscilloscope Operator's Manual Using the File Browser Selecting Browse on any of the File menu dialogs opens a File Browser that enables you to perform basic disk utility functions, as well as making file path/name and format selections. The additional file actions available depend on the actions available on the underlying dialog (Save file, Email report, etc.). - Page 187 Saving Data (File Functions) Auto Naming Selections The checkboxes to turn on/off the Source prefix and the Counter number suffix used to autogenerate file names will appear on the File Browser. These selections are linked to those on the underlying dialog, and changing the value in either place causes it to change everywhere.
- Page 188 HDO8000A/MDA800A High-Definition Oscilloscope Operator's Manual...
-
Page 189: Utilities
The Service button to the far right of the dialog launches a section of the application reserved for qualified Teledyne LeCroy service personnel. An access code is required to enter this section. Status The Utilities Status dialog displays information about your instrument including model number, serial number, firmware version, and installed hardware and software options. - Page 190 The Remote dialog contains settings to configure remote control of the instrument and also network access. Supported remote control protocols are: TCPIP (Ethernet). If you choose this option, also install Teledyne LeCroy's VICP drivers on the controller. These are included in the VICP Passport plug-in, available free from teledynelecroy.com/support/softwaredownload...
- Page 191 Utilities Set Up Remote Control 1. From the menu bar, choose Utilities > Utilities Setup, then touch the Remote tab. 2. On the Remote dialog, make a Control From selection. 3. If using TCPIP and wish to restrict control to specific network clients, choose Yes under Security. Enter the IP addresses or DNS names of the authorized controllers in a comma-delimited list.
- Page 192 HDO8000A/MDA800A High-Definition Oscilloscope Operator's Manual Auxiliary Output Use the Aux Output dialog to configure the output of the Aux Out port and Cal Out port. Auxiliary Output The Aux Out port outputs a 3.3 V CMOS into high impedance pulse following the selected event. Trigger Enabled sends a pulse when the trigger is ready (Ready indicator lit), but not necessarily triggered.
- Page 193 Utilities Date/Time Date/Time settings control the instrument's timestamp. These numbers appear in the message bar and on tables/records internal to the oscilloscope application, such as History Mode and WaveScan. To access the Date/Time dialog, choose Utilities > Utilities Setup from the menu bar, then touch the Date/Time tab.
- Page 194 HDO8000A/MDA800A High-Definition Oscilloscope Operator's Manual Options Many optional software packages are available to extend the Analysis functions of the instrument. When you purchase an option, you will receive a key code by email that activates the new functionality. Use the Options dialog to activate software options by installing the key code. This dialog also displays the ScopeID and Serial #.
-
Page 195: Disk Utilities
Utilities Disk Utilities Use the Disk Utilities dialog to manage files and folders on your instrument's hard drive. Disk Space information is shown at the far right of the dialog for convenience. Note: These tasks can also be accomplished using the standard Microsoft Windows file management tools. -
Page 196: Preferences Dialogs
HDO8000A/MDA800A High-Definition Oscilloscope Operator's Manual Preferences Dialogs Preference settings have mostly to do with the appearance and performance of the instrument itself, rather than its interaction with other devices/systems. These settings are called "non-volatile," because they are not lost when the oscilloscope is restarted and do not change when a setup panel is recalled. Access the Preferences dialogs by choosing Utilities >... - Page 197 Utilities Calibration Calibration ensures that the output from the analog-to-digital converters (ADCs) accurately represents the input. The oscilloscope is calibrated at the factory at 23 °C (± 2 °C) prior to shipment. So that it maintains specified performance, it is factory set to perform an automatic calibration routine upon power up. Note: Warm the oscilloscope for at least 20 min.
- Page 198 HDO8000A/MDA800A High-Definition Oscilloscope Operator's Manual Acquisition The Acquisition preference settings determine how traces behave as Vertical Offset or Horizontal Delay changes. Choose Utilities > Preference Setup to open the Acquisition dialog. Offset Setting constant in: Volts keeps the amount of Offset in the amount of Volts specified, regardless of the V/div setting. As the Offset is adjusted, the trace will appear to move up or down relative to the zero level.
- Page 199 Utilities Color Color dialog settings assign the colors used for channel, math, and memory traces. All dialogs, tables, and trace descriptor boxes will match the color of the trace assigned here. You can choose different colors to be used on the instrument and in print. Note: Print colors are used only when the Colors control is set to Print on any of the File menu dialogs (Save Screen Image, Print, etc.).
- Page 200 Miscellaneous These other Preference settings are located on the Miscellaneous dialog. To add the Teledyne LeCroy logo to print output, check Print Teledyne LeCroy Logo When Printing Grid Area Only. This identifies the instrument as the source of the image.
-
Page 201: Maintenance
Maintenance Maintenance Topics in this section describe procedures for keeping the instrument in optimal working condition. Restart/Reboot Instrument To restart the MAUI oscilloscope application, choose File > Exit from the menu bar, then touch the Start DSO desktop shortcut. To reboot the instrument, which includes restarting the Windows OS: 1. -
Page 202: Touch Screen Calibration
HDO8000A/MDA800A High-Definition Oscilloscope Operator's Manual Touch Screen Calibration Periodically calibrate the touch screen to maintain its accuracy and responsiveness. We recommend that you use a stylus rather than your finger for this procedure. 1. From the menu bar, choose Utilities > Utilities Setup. 2. -
Page 203: X-Streamdso Firmware Update
Maintenance X-StreamDSO Firmware Update The XStreamDSO firmware installer updates multiple oscilloscope components including the MAUI application, required DLLs, device drivers and low-level microcode for integrated circuits. The update does not modify or delete any saved panel setups, waveforms, screen captures, calibration constants, or other data stored on the D: drive. -
Page 204: Switching Windows Users
You may create as many other new user accounts on the oscilloscope as you wish, provided you are logged in as LCRYADMIN when doing so. Contact your local Teledyne LeCroy office for instructions on creating new users without disrupting oscilloscope performance. -
Page 205: Technical Support
Resources Teledyne LeCroy publishes a free Technical Library on its website. Manuals, tutorials, application notes, white papers, and videos are available to help you get the most out of your Teledyne LeCroy products. Visit: teledynelecroy.com/support/techlib The Datasheet published on the product page contains the detailed product specifications. -
Page 206: Returning A Product For Service
4. Pack the product case in a cardboard shipping box with adequate padding to avoid damage in transit. 5. Mark the outside of the box with the shipping address given to you by Teledyne LeCroy; be sure to add the following: ATTN: <RMA code assigned by Teledyne LeCroy>... -
Page 207: Index
Index Index channel 34 descriptor box 14 frequency 7 persistence 76 setup 35 cleaning vi acquisition clock optimiztion 188 external 52 pre-processing 14, 36 reference 52 sampling mode 46 sample 52 settings 190 color 191 action toolbar 15 persistence 75 activating traces 23 cooling vi altitude v... - Page 208 HDO8000A/MDA800A High-Definition Oscilloscope Operator's Manual dialogs 15 frequency 128 display 9, 69 response 7, 131 controls 71, 192 front panel 192 extended 9, 74 gain 35, 190 grid 12, 71 gating measurements 86 optimization 188 GPIB 182 persistence 75 grid 12, 55 email 175-176 auto grid 69 enhanced resolution 14, 36, 128...
- Page 209 Index interfaces 6 pass/fail testing 151, 153 ProBus 6 processing web 109 interpolation 36, 133 readout 106 inversion 14, 37 statistics 85 IP address 9, 182 measurements; status 106 measuring terminals v labelling traces 27, 170 memory 143-144, 161, 163 LabNotebook 11, 169-170 descriptor box 14 recall 171...
- Page 210 HDO8000A/MDA800A High-Definition Oscilloscope Operator's Manual power roll sampling mode 48 ratings vi sample clock 10, 52 standby 8 sample points 47, 133 pre-processing 14 sample rate 47-48 pre-trigger delay 46 sampling mode 46 preferences 188 real-time 48 printing 9, 32, 176, 192 RIS 48 probes 7 roll 48...
- Page 211 Index timestamp 185 trend 116, 118 trigger 55 tables 164 automating 66 auto save 166 controls 55, 57, 62 TCP/IP 9 counter 62, 190 technical support 197-198 delay 46 temperature v descriptor box 14 timebase 46, 190 holdoff 62 clock 52 software assisted 65 controls 46 time 62...
- Page 212 HDO8000A/MDA800A High-Definition Oscilloscope Operator's Manual XY plots 72 zoom 22, 24, 28 controls 28, 192 descriptor box 14 multi-zoom 28 undo 12 zoom+gate 28...