
Subscribe to Our Youtube Channel
Summary of Contents for PicoQuant HydraHarp 400
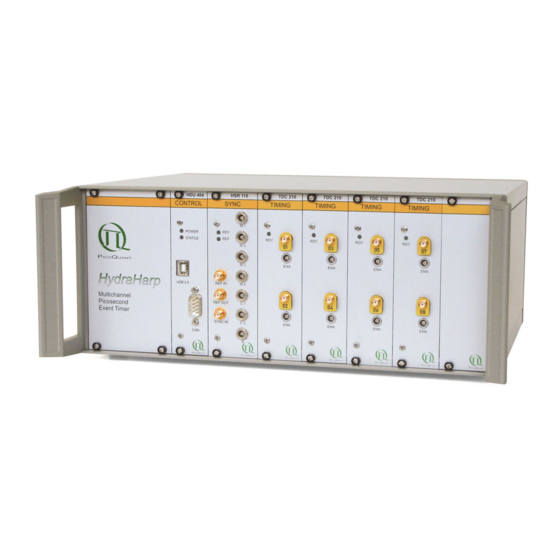
- Page 1 HydraHarp 400 Picosecond Histogram Accumulating Real–time Processor Time–Correlated Single Photon Counting System with USB Interface User's Manual and Technical Data Version 3.0.0.1...
- Page 2 License and Copyright Notice With the HydraHarp 400 product you have purchased a license to use the HydraHarp software. You have not purchased any other rights to the software itself. The software is protected by copyright and intellectual property laws.
-
Page 3: Table Of Contents
PicoQuant GmbH HydraHarp 400 Software V. 3.0.0.1 Table of Contents 1. Introduction..............................2. Primer on Time–Correlated Single Photon Counting..................6 2.1. Count Rates and Single Photon Statistics....................2.2. Timing Resolution............................ 2.3. Photon Counting Detectors........................2.3.1. Photomultiplier Tube (PMT)......................2.3.2. Micro Channel Plate PMT (MCP)..................... - Page 4 PicoQuant GmbH HydraHarp 400 Software V. 3.0.0.1 6.2. Menus..............................6.2.1. File Menu............................6.2.2. Edit Menu............................6.2.3. View Menu............................. 6.2.4. Help Menu............................. 6.3. Toolbar..............................6.4. Control Panel............................6.4.1. Sync–Input............................. 6.4.2. Inputs 1…4............................ 6.4.3. Inputs 5…8............................ 6.4.4. Acquisition............................. 6.5. Axis Panel.............................. 6.5.1. Time Axis Group..........................
-
Page 5: Introduction
(TOF) and Optical Time Domain Reflectometry (OTDR) as well as any kind of coincidence correlation. The HydraHarp 400 is a cutting edge TCSPC system with Universal Serial Bus (USB) interface. Its new modular design provides a flexible number of input channels and allows innovative measurement approaches. -
Page 6: Primer On Time-Correlated Single Photon Counting
PicoQuant GmbH HydraHarp 400 Software V. 3.0.0.1 2. Primer on Time–Correlated Single Photon Counting In order to make use of a powerful analysis tool such as time–resolved fluorescence spectroscopy, one must record the time dependent intensity profile of the emitted light. While in principle, one could attempt to record the time decay profile of the signal from a single excitation / emission cycle, there are practical problems to prevent such a simple solution in most cases. -
Page 7: Count Rates And Single Photon Statistics
(e.g. for molecule transition detection) dead– times can be a problem. The HydraHarp 400 has an extremely short dead time of typically less than 80 ns, imposing the smallest losses possible with instruments of comparable resolution today. -
Page 8: Timing Resolution
PicoQuant GmbH HydraHarp 400 Software V. 3.0.0.1 2.2. Timing Resolution The most critical component in terms of timing resolution in TCSPC measurements will usually be the detector. However, as opposed to analog transient recording, the time resolution of TCSPC is not limited by the pulse response of the detector. -
Page 9: Photon Counting Detectors
25 ps. Microchannel plates are in this respect the best match for the HydraHarp 400 but they are limited in permitted count rate and provide lower sensitivity towards the red end of the spectrum compared to suitably optimized SPADs. -
Page 10: Other And Novel Photon Detectors
The hybrid PMT modules of PicoQuant's PMA Hybrid series alleviate this problem by encapsulating the high voltage supply, the detector, a peltier cooler and even a protective shutter in a compact housing. - Page 11 Newer CFD designs achieve the same objective by differentiating the input signal and triggering on the zero crossing of the differentiated signal. This is the case for the HydraHarp 400. This has the benefit of adaption to different detector types without a need for changing physical delay lines.
- Page 12 CFD at one of the inputs. The HydraHarp 400 is revolutionary in this respect, as it allows to work in forward start stop mode, even with fast lasers. This is facilitated by two design features: 1) The independent operation of the time digitizers, and 2) a programmable divider in front of the sync input.
- Page 13 This signal (a narrow negative pulse) is also fed to the TCSPC electronics via a high quality 50 Ω coax cable. When using the HydraHarp 400 in combination with the PDL 800–B, the sync pulse adapter LTT 100 (brass cube with SMA connectors) or a 10 dB attenuator should be inserted directly at the sync output of the laser driver.
-
Page 14: Further Reading
Indeed one can measure lifetimes significantly smaller than the IRF with this method. Additionally, the rms residue from the fit can be used to assess the quality of the fit and thereby the reliability of the lifetime measurement. The FluoFit decay fit software package from PicoQuant provides this functionality. 2.5. Further Reading 1. -
Page 15: Hardware And Software Installation
. In order to use the HydraHarp software with the HydraHarp 400 hardware, a device driver must be installed. The HydraHarp 400 is a USB ‘plug and play’ device, this means the necessary resources and drivers are allocated automatically by the operating system. -
Page 16: Software Installation
The default location is: \Program Files\PicoQuant\HydraHarp400v30. Setup will also create a dedicated "program folder" for the new HydraHarp 400 software that will later appear in the Start Menu. You can accept the default folder name or select another according to your own naming policies. -
Page 17: Device Installation
The inputs for the detector / sync signals are SMA connectors located on the front panel of the HydraHarp 400, labelled IN and SYNC IN. In case of time resolved fluorescence experiments with a pulsed excitation source, the sync signal must be connected to the SYNC IN input and the detector signal must be connected to an IN port. -
Page 18: Installation Troubleshooting
After driver installation Windows should report the device as ready to use. If you wish to verify correct installation you can check the presence of 'HydraHarp 400' as a USB device in the Windows Device Manager. For troubleshooting see the next section. -
Page 19: Software Overview
This allows you to use the software without the HydraHarp hardware, e.g. to view or print files on another computer. If the HydraHarp 400 is correctly installed and there are still device related errors, you can use the Windows Device Manager for troubleshooting (see the corresponding section above). If problems cannot be resolved, see section 7 for support. - Page 20 PicoQuant GmbH HydraHarp 400 Software V. 3.0.0.1 When the HydraHarp software is running with functional hardware it continuously collects information about the input signals and the current acquisition settings. If these settings together with the input rates indicate possible errors, the software will activate a warning icon in the status bar.
-
Page 21: The Toolbar
PicoQuant GmbH HydraHarp 400 Software V. 3.0.0.1 4.3. The Toolbar The toolbar is displayed across the top of the HydraHarp main window, below the menu bar. The toolbar provides quick mouse access to frequently used commands and tools. Note that some buttons may be grayed out (disabled) dependent on the installed software components and / or the state of the hardware. -
Page 22: The Control Panel
PicoQuant GmbH HydraHarp 400 Software V. 3.0.0.1 4.4. The Control Panel The HydraHarp control panel is a dialog box for setting the parameters for hardware adjustment and data acquisition. It is implemented as a ‘non–modal’ dialog box, i.e. it does not have to be closed before the main window can continue. -
Page 23: The Axis Panel
PicoQuant GmbH HydraHarp 400 Software V. 3.0.0.1 4.5. The Axis Panel The axis settings panel is a dialog box for setting the axis range for the histogram display in the main window. It is implemented as a ‘non–modal’ dialog box, i.e. it does not have to be closed before the main window can continue. -
Page 24: The Trace Mapping Dialog
PicoQuant GmbH HydraHarp 400 Software V. 3.0.0.1 4.6. The Trace Mapping Dialog The HydraHarp software can measure histograms in up to 512 memory blocks. Out of these up to 8 curves can be displayed. The Trace Mapping dialog is used to select the curves to display. It also allows to view curve details and cleanup. -
Page 25: Specific Measurement Tasks
TCSPC first. The document is on your distribution CD. This will help you getting started more quickly. In order to acquire any data, the input channels and the SYNC input of the HydraHarp 400 must be set to match their electrical input signals. The HydraHarp input channels are designed identically, all with a Constant Fraction Discriminator (CFD). - Page 26 Dependent on the number of installed TDC modules your HydraHarp may have 2, 4, 6 or 8 input channels. As noted before, the HydraHarp 400 input channels are designed electrically identical, each with a CFD. The signals must consist of pulses with falling active edge. The pulse edges must be steep (2 ns rise / fall time or faster).
- Page 27 PicoQuant GmbH HydraHarp 400 Software V. 3.0.0.1 the next section for instructions). If there are counts coming in, you can try to set an upper limit of the count axis so that the histogram is scaled for best viewing. Start with logarithmic display so that weak signals can be seen.
- Page 28 PicoQuant GmbH HydraHarp 400 Software V. 3.0.0.1 The warning icon can be clicked to display a list of current warnings together with a brief explanation of each warning (see also section 8.1). Note that the software can detect only a small subset of possible error conditions.
-
Page 29: Setting Up And Running Interactive Measurements
PicoQuant GmbH HydraHarp 400 Software V. 3.0.0.1 5.2. Setting Up and Running Interactive Measurements The primary mode of operation of the HydraHarp software is interactive histogramming mode. This is what the main window of the software is dedicated to. The user can set up measurement parameters, start measurements and immediately see histogram data on the screen. -
Page 30: Time Tagged Mode Measurements
5.3.2. T2 Mode In T2 mode all timing inputs of the HydraHarp 400 and the SYNC input are functionally identical. There is no dedication of the SYNC input channel to a sync signal from a laser. It may be left unconnected or can be used for an additional detector signal. -
Page 31: T3 Mode
The HydraHarp software installation CD contains demo programs showing how T3 mode files can be read. The implementation of custom measurement programs requires the HydraHarp programming library, which is available as a separate option. Another alternative for advanced TTTR data collection and analysis is the SymPhoTime software offered by PicoQuant. Page 31... -
Page 32: Running A Basic Tttr Mode Measurement
PicoQuant GmbH HydraHarp 400 Software V. 3.0.0.1 5.3.4. Running a basic TTTR Mode Measurement A TTTR mode measurement (T2 or T3 mode) will typically be started after all control panel settings have been tested in normal interactive histogramming mode (oscilloscope or integration). The acquisition time (measurement time) and the file for saving the data are the only parameters that can be set separately. -
Page 33: External Markers
This marker scheme is a very special innovative feature of the PicoQuant TCSPC electronics. It is worth noting that this technology enabled PicoQuant GmbH to develop the leading edge MicroTime 200 Fluorescence Lifetime Microscope. -
Page 34: Tttr Mode Measurements With Real-Time Correlation
Note that T2 and T3 mode files cannot be distinguished by their file extension. They all get stored as *.ptu . However, you can use the PicoQuant File Info shell extension that will be installed by the HydraHarp software setup to inspect individual header items of a *.ptu or *.phu file. This includes the measurement mode. Just right-click on the file in Windows explorer and select Properties. - Page 35 If you need to perform further or more thorough FCS analysis on the collected data you can use the SymPhoTime software from PicoQuant. On the right hand side there are controls for the axis ranges of the correlator display. Note that they affect only the display.
-
Page 36: Time-Resolved Excitation And Emission Spectra
Note that most of the monochromators can be controlled only through dedicated stepper motor hardware from PicoQuant or selected vendors, usually installed as part of a complete PicoQuant spectrometer. Custom confi - gurations can only be supported upon special request. - Page 37 PicoQuant GmbH HydraHarp 400 Software V. 3.0.0.1 Monochromator Initialization Before use, the monochromator must be initialized. This means, it has to seek its mechanical reference position (determined by a micro switch). Physical calibration values are kept in a monochromator configuration file (monochromator.cfg) which is generated by the system supplier at the time of delivery.
- Page 38 PicoQuant GmbH HydraHarp 400 Software V. 3.0.0.1 If there is a large difference between the current monochromator position and the position entered, the movement will take some time. If you wish to interrupt this process, press the Stop button. The monochromator immediately will slow down and stop.
- Page 39 Trace Mapping dialog. You can furthermore use the software tool FluoPlot from PicoQuant to visualize and analyze the data in various 2D and 3D representations with a multitude of options for colouring, scaling and changing view aspects in 3D. The figures below show FluoPlot visualizations from a TRES measurement of mixed oxazine dyes in ethanol.
- Page 40 OpenGL version 1.5 or higher. Speedy handling of large data files requires sufficient memory. Further data analysis may need to be performed by dedicated software, either custom programs or specialized solutions available from PicoQuant. Page 40...
-
Page 41: Controls And Commands Reference
PicoQuant GmbH HydraHarp 400 Software V. 3.0.0.1 6. Controls and Commands Reference 6.1. Main Window The Title Bar The title bar is located along the top of a window. To move the window, drag the title bar. Note: You can also move dialog boxes by dragging their title bars. - Page 42 PicoQuant GmbH HydraHarp 400 Software V. 3.0.0.1 Restore command Use this command to return from an enlarged window to the previous size. Note: The command is only available for already maximized or minimized windows. Shortcut Mouse: Click the maximize button on the title bar;...
-
Page 43: Menus
PicoQuant GmbH HydraHarp 400 Software V. 3.0.0.1 6.2. Menus 6.2.1. File Menu The File menu offers the following commands: Clears all histogram data and restores default settings. Open Opens an existing histogram file. Save Saves a histogram file. Save As…... - Page 44 PicoQuant GmbH HydraHarp 400 Software V. 3.0.0.1 Files of type Select the type of file you want to open. The default HydraHarp extension is .phu Save command Use this command to save the current histogram data to its current name and directory. When you save a histogram for the first time, HydraHarp displays the Save As…...
-
Page 45: Edit Menu
PicoQuant GmbH HydraHarp 400 Software V. 3.0.0.1 Shortcut Keys: <Alt>+F V Print Setup command Use this command to select a printer and a printer connection. This command presents a Print Setup dialog box, where you specify the printer and its connection. -
Page 46: View Menu
PicoQuant GmbH HydraHarp 400 Software V. 3.0.0.1 6.2.3. View Menu The View menu offers the following commands: Toolbar Shows or hides the toolbar. Status Bar Shows or hides the status bar. Axis Panel Shows the axis settings panel. Control Panel Shows the control panel. -
Page 47: Help Menu
<Alt>+H C About HydraHarp... command Use this command to display the copyright notice and version number of your HydraHarp software and hardware, if installed. It also provides access to the PicoQuant Web site and software updates. Shortcut Keys: <Alt>+H A... -
Page 48: Toolbar
PicoQuant GmbH HydraHarp 400 Software V. 3.0.0.1 6.3. Toolbar Toolbar buttons of special interest are explained in some more detail here: Context Help When you choose the Context Help button, the mouse pointer will change to an arrow and question mark. Then click somewhere in the HydraHarp window, such as on another toolbar button. - Page 49 PicoQuant GmbH HydraHarp 400 Software V. 3.0.0.1 Trace Map Launches the Trace Mapping dialog. The HydraHarp can measure histograms in up to 512 memory blocks. Out of these, up to 8 curves can be displayed. The trace map dialog is used to select the curves to display. Tick the individual "Show"...
-
Page 50: Control Panel
PicoQuant GmbH HydraHarp 400 Software V. 3.0.0.1 6.4. Control Panel The control panel consists of several pages (tabbed sheets) containing edit boxes and other controls for related parameters. These pages are described in the following subsections. Note that the settings of the control panel as well as the position of the control panel on the screen will be stored in the registry and retrieved at the next program start. -
Page 51: Inputs 5
PicoQuant GmbH HydraHarp 400 Software V. 3.0.0.1 Zero Cross edit box and spin control Here the zero cross level of the Constant Fraction Discriminator (CFD) for the Input Channels 1…4 can be set. Units are millivolts (mV), the permitted range is 0 to 40. Type the value as an integer in the edit box and press <Enter>... - Page 52 PicoQuant GmbH HydraHarp 400 Software V. 3.0.0.1 possible to shift the acquisition window relative to the sync frame by means of the offset. Note that working with very long time spans (low sync rates) also requires long acquisition times to mimnimize noticeable “steps” in the acquired histograms.
- Page 53 PicoQuant GmbH HydraHarp 400 Software V. 3.0.0.1 Oscilloscope Mode: The selection Oscilloscope from the selection box "Mode" selects the current acquisition mode Oscilloscope for the HydraHarp. In oscilloscope mode the acquisition and display, once started, repeats at intervals given by the current acquisition time setting. The histogram accumulation always starts from scratch.
-
Page 54: Axis Panel
PicoQuant GmbH HydraHarp 400 Software V. 3.0.0.1 6.5. Axis Panel The controls of the Axis Panel are used to customise the main window's curve display. Apply–button All mouse actions on the spin controls on this dialog result in instant modification of the display. If you choose to alter the values in the edit fields by keyboard, you have to finish your changes by pressing <Enter>... -
Page 55: Trace Mapping Dialog
PicoQuant GmbH HydraHarp 400 Software V. 3.0.0.1 6.6. Trace Mapping Dialog The HydraHarp software can measure histograms in up to 512 memory blocks. Out of these, up to 8 curves can be displayed. The trace mapping dialog is used to select the curves to display. Tick the individual boxes ‘Show’... -
Page 56: About Hydraharp
PicoQuant GmbH HydraHarp 400 Software V. 3.0.0.1 TTTR Marker Settings Group Here you can set the signal specifications for external marker signals used in TTTR mode (T2 and T3 mode). The settings for the different markers are independent from each other. The following table applies to each of... - Page 57 PicoQuant GmbH HydraHarp 400 Software V. 3.0.0.1 Zoom In Take a closer look at the printed page. Zoom Out Take a larger look at the printed page. Page Setup Change the layout of the printed page. Close Return from print preview to the editing window.
-
Page 58: Problems, Tips & Tricks
7.2. USB interface In order to deliver maximum throughput, the HydraHarp 400 uses (dependent on the model you purchased) USB 2.0 or USB 3.0 bulk transfers. Correspondingly, the HydraHarp must rely on having a suitable host interface of appropriate speed rating. -
Page 59: Warming Up And Calibration
7.7. Support and Bug Reports The HydraHarp 400 TCSPC system has gone through extensive testing. Nevertheless, it is a very cutting edge product and we would like to offer you our support in any case of problems with the system. Do not hesitate to contact PicoQuant in case of difficulties with your HydraHarp. - Page 60 Of course we also appreciate good news: If you have obtained exciting results with one of our systems, please let us know, and where appropriate, please mention the instrument in your publications. The simplest way of doing this in case of the HydraHarp 400 is citing the original publication about the instrument . At our web–site we also maintain a large bibliography of publications referring to our instruments.
-
Page 61: Appendix
PicoQuant GmbH HydraHarp 400 Software V. 3.0.0.1 8. Appendix 8.1. Warnings When the HydraHarp software is running with functional hardware it continuously collects information about the input signals and the current acquisition settings. If these settings together with the input rates indicate possible errors, the software will indicate this by means of a warning icon. - Page 62 PicoQuant GmbH HydraHarp 400 Software V. 3.0.0.1 Warning Histo Mode T2 Mode T3 Mode WARNING_SYNC_RATE_TOO_HIGH In histogramming or T3 mode: The divided pulse rate at the sync input is higher than 12.5 MHz (deadtime limit). Use a larger divider if possible.
- Page 63 PicoQuant GmbH HydraHarp 400 Software V. 3.0.0.1 Warning Histo Mode T2 Mode T3 Mode WARNING_TIME_SPAN_TOO_SMALL This warning is issued in histogramming and T3 mode when the sync period (1/SyncRate) is longer that the start to stop time span that can be covered by the histogram or by the T3 mode records.
-
Page 64: Data File Formats
HydraHarp software actually uses. It is recommended to go by a specific file, have one of the demos read it and then look at the list of header items you get. You can also use the PicoQuant File Info shell extension that will be installed by the HydraHarp software setup to inspect individual header items of a *.ptu or *.phu file. -
Page 65: Tttr Mode File Format
PicoQuant GmbH HydraHarp 400 Software V. 3.0.0.1 8.2.2. TTTR Mode File Format HydraHarp data files from T2 and T3 Mode (*.ptu) created by the HydraHarp software are tagged binary files which contain both the setup parameters and the actual event data. There can be only one measurement per file. -
Page 66: Hardware Technical Data
PicoQuant GmbH HydraHarp 400 Software V. 3.0.0.1 8.3. Hardware Technical Data 8.3.1. Specifications All information given here is reliable to our best knowledge. However, no responsibility is assumed for possible inaccuracies or omissions. Specifications and external appearance are subject to change without notice. - Page 67 PicoQuant GmbH HydraHarp 400 Software V. 3.0.0.1 TTTR Engine T2 mode resolution 1 ps T3 mode resolution 1, 2, 4, 8, …, 33 554 432 ps FIFO buffer depth (records) 2 097 152 USB 2.0 typ. 9 · 10 events ⁄ s...
-
Page 68: Connectors
Software V. 3.0.0.1 8.3.2. Connectors Apart from the SMA connectors for the input signals the HydraHarp 400 provides several connectors for other purposes such as experiment control. The following table lists their function and signal types, sorted by the module they belong to. For details on the signal specifications (voltages, pulse widths etc.) see section 8.3.1. -
Page 69: Indicators
Software V. 3.0.0.1 8.3.3. Indicators The HydraHarp 400 front panel provides several LED indicators signalling the instrument status. The following table lists their function, sorted by the module they belong to. Note that precise status information should be obtained from the software. -
Page 70: Using The Software Under Linux
Every line in the hotplug usermap files is for one device, the line starts with a name that will also be used for a handler script. Since there are two HydraHarp 400 models (USB 2.0 and USB 3.0) the HydraHarp usermap file has two lines as shown below. - Page 71 50-udev.rules. Don't change this file as it could be overwritten when you upgrade udev. Instead, put your custom rule for the HydraHarp in a separate file. The contents of this file for the handling of the current HydraHarp 400 models should be: ATTR{idVendor}=="0d0e", ATTR{idProduct}=="0004", MODE="666"...
Need help?
Do you have a question about the HydraHarp 400 and is the answer not in the manual?
Questions and answers