Table of Contents
Advertisement
Quick Links
ATSAMB11 BluSDK SMART Example Profiles Application
Introduction
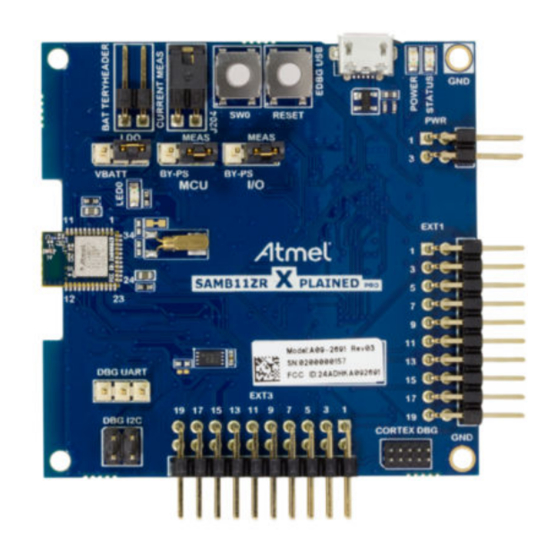
This document describes how to set the ATSAMB11-MR/ZR evaluation boards for various example
applications supported by the Advanced Software Framework (ASF). This document also provides the list
of supported IDEs to be used in conjunction with the ATSAMB11-MR/ZR evaluation boards (see
2-1). The part number of the ATSAMB11-MR Xplained Pro (XPro) board is ATSAMB11MR-XPRO and the
part number of the ATSAMB11-ZR Xplained Pro board is ATSAMB11ZR-XPRO.
Note: All example applications are included in the BluSDK SMART software package.
Figure 1. ATSAMB11 Xplained Pro Boards
Features
•
Observer Application
•
Proximity Monitor Application:
–
Device discovery and disconnection
–
Services and characteristics discovery
–
Services – Link Loss service, Immediate Alert service, and Tx Power service
–
Setting up Path Loss and Link Loss
–
Received Signal Strength Indicator (RSSI) sampling
•
Proximity Reporter Application:
–
Advertisement
–
Pairing/bonding
–
Services – Link Loss service (mandatory), Immediate Alert service, and Tx Power service
©
2017 Microchip Technology Inc.
User's Guide
User Guide
ATSAMB11
Table
DS70005335A-page 1
Advertisement
Table of Contents

Subscribe to Our Youtube Channel
Related Manuals for Microchip Technology ATSAMB11


Summary of Contents for Microchip Technology ATSAMB11
-
Page 1: Introduction
IDEs to be used in conjunction with the ATSAMB11-MR/ZR evaluation boards (see Table 2-1). The part number of the ATSAMB11-MR Xplained Pro (XPro) board is ATSAMB11MR-XPRO and the part number of the ATSAMB11-ZR Xplained Pro board is ATSAMB11ZR-XPRO. - Page 2 Device discovery and disconnection – Pairing/bonding – Alert notification service – Alert on incoming call • Multi-Role Peripheral Multi-Connect Application: – Supports eight connections • L2CAP Throughput Application: – L2CAP central User Guide DS70005335A-page 2 © 2017 Microchip Technology Inc.
- Page 3 Direct Test Mode (DTM) Application: – DTM setup procedure – Downloading DTM firmware • AT Command Application – Reset the link layer – Set device configuration – Start scan – Stop scan User Guide DS70005335A-page 3 © 2017 Microchip Technology Inc.
-
Page 4: Table Of Contents
4.2. Build Procedure..........................17 4.3. Application Configuration......................24 5. Application Demo....................26 5.1. Demo Setup..........................26 5.2. Console Logging........................28 5.3. Running the Demo........................28 6. Adding a BLE Standard Service................77 User Guide DS70005335A-page 4 © 2017 Microchip Technology Inc. - Page 5 The Microchip Web Site....................99 Customer Change Notification Service................99 Customer Support......................99 Microchip Devices Code Protection Feature..............99 Legal Notice.........................100 Trademarks......................... 100 Quality Management System Certified by DNV............101 Worldwide Sales and Service..................102 User Guide DS70005335A-page 5 © 2017 Microchip Technology Inc.
-
Page 6: Functional Overview
If the alert level is “HIGH_ALERT” then the LED blinks faster (1 second interval) • If the alert level is “MILD_ALERT” then the LED blinks moderately (2 second interval) • If the alert level is “NO_ALERT” the LED must be off User Guide DS70005335A-page 6 © 2017 Microchip Technology Inc. -
Page 7: Proximity Monitor Application
Notification Provider Incoming Call Notification ® The programmed ATSAMB11-MR/ZR (Notification Consumer) must be paired with an iPhone to display the received incoming call notification on a console. The Bluetooth SIG defined Alert Notification profile provides similar functionality for Android devices. -
Page 8: Time Information Profile Application
Boot keyboard output report (keyboard only) This example application simulates a function of a mouse or keyboard. Once the connection procedure is implemented between a mobile phone and the ATSAMB11-MR/ZR board, the board can act as a mouse or a keyboard. -
Page 9: Device Information Service Application
The Heart Rate profile provided by Bluetooth SIG defines three characteristics for the exchange of heart rate parameters between the sensor and monitor. The characteristics of the profile are used to transfer heart rate parameters like bpm, R-R interval measurements, and other parameters like body sensor User Guide DS70005335A-page 9 © 2017 Microchip Technology Inc. -
Page 10: Blood Pressure Profile Application
The blood pressure feature characteristic is used to describe the supported features of the blood pressure sensor The ATSAMB11-MR/ZR simulates a blood pressure sensor (GATT server role) and sends simulated values to the blood pressure monitor (Microchip SmartConnect mobile application). -
Page 11: Find Me Profile Application
• Phone alert client – device that receives the alerts and alerts the user The phone alert client (a GATT client) configuration is implemented on the ATSAMB11-MR/ZR (see Table 2-1). The example application utilizes the SW0 button on the supported hardware platform to demonstrate the notification use-cases. -
Page 12: Multi-Role Peripheral Multi-Connect Application
The ATSAMB11-MR/ZR is exchanging the data as a GAP central once the link is established. Again, the Multi-Role application is started to advertise using connectable advertisement packets as a GAP peripheral and gets connected to the remote device, which sends a connection request and exchanges the data on the new link established. -
Page 13: Ibeacon Application
The Direct Test mode (DTM) application is used to establish performance of Tx and Rx tests between two ATSAMB11-MR/ZR modules. The BLE Performance Analyzer is a performance analysis tool that is part of the Wireless Composer tool in Atmel Studio. This tool will be used at both ends (one assuming the role of a transmitter and the other the role of a receiver) for execution of tests. - Page 14 Table 1-1. AT Command Set Command Description Syntax Reset Reset the link layer AT+RESET Configuration Set device configuration AT+CFG_DEF Start Scan Start scan operation AT+SCAN Stop Scan Stop an ongoing scan operation AT+STOP User Guide DS70005335A-page 14 © 2017 Microchip Technology Inc.
-
Page 15: Supported Hardware Platforms And Ides
ATSAMB11 Supported Hardware Platforms and IDEs The following table provides the supported hardware platforms and IDEs for the ATSAMB11-MR/ZR. Table 2-1. BluSDK – Supported Hardware and IDEs Platform Supported IDEs SAMB11MR-XPRO ATSAMB11G18A Atmel Studio v7.0 and Keil SAMB11ZR-XPRO ATSAMB11-ZR210CA Atmel Studio v7.0 and Keil... -
Page 16: Hardware Setup
ATSAMB11 Hardware Setup The following figure illustrates the connection of the ATSAMB11-MR/ZR XPro board to the host PC using a micro-USB cable. Figure 3-1. EDBG USB Port User Guide DS70005335A-page 16 © 2017 Microchip Technology Inc. -
Page 17: Software Setup
SAMB11-MR/ZR Xplained Pro board, which is also valid for the other supported hardware platforms (see Table 2-1). Open the Atmel Studio and select File > New > Example Project. User Guide DS70005335A-page 17 © 2017 Microchip Technology Inc. - Page 18 Select the respective example application of the SAMB11-MR/ZR by expanding the “Atmel - Atmel Corp.” in the All Projects tab. This selection automatically populates the Project Name, Location, Solution, Solution Name, and Device. 2.3. Click OK. User Guide DS70005335A-page 18 © 2017 Microchip Technology Inc.
- Page 19 For the Time Information Profile application, the user must select the compiler symbol based on the following: – For Android devices: TP_ANDROID – For iOS devices: NTP_ANDROID Note: This step is applicable only for the Time Information Profile application. User Guide DS70005335A-page 19 © 2017 Microchip Technology Inc.
- Page 20 Figure 4-4. Building Solution for Selected Application Example The generated solution is downloaded into the SAMB11-MR/ZR XPro board through the USB cable. To program the board, go to Tools > Device Programming. User Guide DS70005335A-page 20 © 2017 Microchip Technology Inc.
- Page 21 Figure 4-6. Embedded Debugger Device Programming Window After flashing the example application into the SAMB11-MR/ZR Xpro board, it is ready to be used as a BLE device that supports the selected application example. User Guide DS70005335A-page 21 © 2017 Microchip Technology Inc.
- Page 22 – libs (driver_lib.lib, ble_api.lib) Set the appropriate build symbols (see the following figure): – For ATSAMB11-MR – BLE_MODULE=SAMB11_MR – For ATSAMB11-ZR: BLE_MODULE=SAMB11_ZR Figure 4-7. Selecting SAMB11 Board Type For the Time Information Profile application, the user must select the compiler symbol based on the following: –...
- Page 23 Running the Demo. In the case of Device Information, Simple Broadcaster and Observer application, refer to Application Configuration. To create a custom project using Keil IDE, refer to Customization of Keil Project. User Guide DS70005335A-page 23 © 2017 Microchip Technology Inc.
-
Page 24: Application Configuration
Figure 4-10. Device Information Service Header File for Atmel Studio Figure 4-11. Device Information Service Header File for Keil DEFAULT_MANUFACTURER_NAME DEFAULT_MODEL_NUMBER DEFAULT_SERIAL_NUMBER DEFAULT_HARDWARE_REVISION DEFAULT_SOFTWARE_REVISION DEFAULT_FIRMWARE_REIVSION User Guide DS70005335A-page 24 © 2017 Microchip Technology Inc. - Page 25 These parameters can be modified as per the user requirement. They can be updated in the ble_manager.h file, which is available in the following directory: \asf\thirdparty\wireless \ble_smart_sdk\ble_services\ble_mgr Note: After configuration, follow the steps in Observer Application. User Guide DS70005335A-page 25 © 2017 Microchip Technology Inc.
-
Page 26: Application Demo
Table 5-1. Demo Setup Details for Various Applications Applications (Keywords) BLE Node 1 BLE Node 2 Observer Application Any BLE device can be used as Supported by the ATSAMB11- Peripherals MR/ZR XPro board to act as an Observer application Proximity Reporter Application Supported by the Microchip... - Page 27 MR/ZR XPro board to act as forAndroid devices only, to act as a Notification Consumer Notification Provider Multi-Role Peripheral Multi- Supported by the ATSAMB11-MR/ZR XPro board and Microchip Connect Application SmartConnect application to act as Peripheral or Central User Guide DS70005335A-page 27 ©...
-
Page 28: Console Logging
ATSAMB11 Applications (Keywords) BLE Node 1 BLE Node 2 L2CAP Throughput Application Supported by the ATSAMB11- Supported by the ATSAMB11- MR/ZR XPro board to act as MR/ZR XPro board to act as L2CAP Central L2CAP Peripheral Health Thermometer Profile Supported by the Microchip... - Page 29 Figure 5-2. Dashboard of Microchip SmartConnect Application To scan for the peripheral devices, click the START SCAN option available in scanning page. The device name (for example, ATMEL-PXP) is displayed among the list of scanned devices. User Guide DS70005335A-page 29 © 2017 Microchip Technology Inc.
- Page 30 “Successful connection” upon successful completion of pairing. Figure 5-4. Pairing Request On the device side, the console displays the successful completion of the pairing procedure. On the Microchip SmartConnect app, the supported services are displayed for the device. User Guide DS70005335A-page 30 © 2017 Microchip Technology Inc.
- Page 31 Device. Note: Observer Application Console Baudrate must be set to 921600. Press the Reset button on the ATSAMB11-MR/ZR XPro board. The device is now ready to be used as an Observer and starts to scan for nearby BLE devices. The following figure shows example logs from the Observer application.
- Page 32 Running the Demo. Select the desired service (Link Loss or Immediate Alert) for alert level characteristics configuration. Choose a value from the following: – HIGH ALERT – MILD ALERT – NO ALERT User Guide DS70005335A-page 32 © 2017 Microchip Technology Inc.
- Page 33 Proximity Monitor sends the corresponding alert level. The console log on the Proximity Reporter displays the corresponding alerts and on-board status LED behavior. Figure 5-8. Proximity Reporter Path Loss Plot Across Safe, Mid, and Danger Zone User Guide DS70005335A-page 33 © 2017 Microchip Technology Inc.
- Page 34 Link Loss service is used (for example, Key Fob). When the user is in close proximity, the lock remains open. Subsequently, the user moving out of range can be triggered to close the lock. User Guide DS70005335A-page 34 © 2017 Microchip Technology Inc.
- Page 35 Figure 5-11. Proximity Reporter Console Log for Link Loss After Link Loss, the mobile application attempts to reconnect to the Proximity Reporter. The connection is re-established by moving the mobile phone closer to the reporter. User Guide DS70005335A-page 35 © 2017 Microchip Technology Inc.
- Page 36 Connect one ATSAMB11-MR/ZR device loaded with Proximity Monitor example application code. Follow the steps (1 and 2) from Initializing the Device. Setup another ATSAMB11-MR/ZR device with Proximity Reporter application. Follow all the steps from Initializing the Device. The device starts advertising.
- Page 37 If the reporter device moves out of the proximity of the monitor device, the path loss crosses the threshold values and the corresponding alert value is set. The alert notification is displayed on the console as shown below. User Guide DS70005335A-page 37 © 2017 Microchip Technology Inc.
- Page 38 In the Bluetooth Pairing Request window of the iPhone, enter the pass-key displayed in the console log and click Pair. After the device is connected, “ATMEL-ANCS” appears in the MY DEVICES section on the iPhone. User Guide DS70005335A-page 38 © 2017 Microchip Technology Inc.
- Page 39 The user can set appropriate values for Scan Interval and Scan Window characteristics. The newly updated value of Scan Interval and Scan Window must be displayed on the console log of the device side as shown in the following figure. User Guide DS70005335A-page 39 © 2017 Microchip Technology Inc.
- Page 40 Press the SW0 button on the supported platform device to read the internally supported characteristic values from the Android device. The console log on the device side displays the values for all the characteristics supported by the device. User Guide DS70005335A-page 40 © 2017 Microchip Technology Inc.
- Page 41 Click ATMEL-HID to start the pairing procedure. A pop-up requesting for the pass-key appears. Enter the pass-key “123456” and click Pair. Figure 5-24. Bluetooth Pairing Request After the pairing is completed, the connected device is listed under Paired devices, as shown in the following figure. User Guide DS70005335A-page 41 © 2017 Microchip Technology Inc.
- Page 42 Next 5 button presses – cursor moves left – Next 5 button presses – cursor moved up The same sequence is repeated based on the user input. The console log is shown in the following screen. User Guide DS70005335A-page 42 © 2017 Microchip Technology Inc.
- Page 43 Perform the following steps to disable the ULP mode for HID Keyboard device application. Before building the project, ensure that the “NENABLE_ULP” symbol is used, as shown in the following figure. User Guide DS70005335A-page 43 © 2017 Microchip Technology Inc.
- Page 44 Select ATMEL-HID to connect to the supported platform device. Figure 5-30. HID (Keyboard) Device Discovery on Bluetooth Settings Page Click ATMEL-HID to initiate the pairing procedure. Figure 5-31. Pairing Procedure with HID Device User Guide DS70005335A-page 44 © 2017 Microchip Technology Inc.
- Page 45 10. The user can see a complete “Hello Atmel” in the application as shown in the following screen. Figure 5-34. Message Displayed in the Application 5.3.8.2 Enabling ULP Mode Perform the following steps to enable the ULP mode for HID Keyboard device application. User Guide DS70005335A-page 45 © 2017 Microchip Technology Inc.
- Page 46 Before building the project, ensure that the “ENABLE_ULP” symbol is used, as shown in the following figure. Figure 5-35. Selecting ENABLE_ULP Symbol for ULP mode Configure the device using cables and a switch, as shown in the following figure. Figure 5-36. Cables and Switch User Guide DS70005335A-page 46 © 2017 Microchip Technology Inc.
- Page 47 ATSAMB11 Figure 5-37. Configuring the ATSAMB11 to Control ULP Mode Follow the steps (2 through 7) from Disabling ULP Mode. Adjust the switch to connect pin 9 (AON_GPIO_0) to pin 20 (VCC) to disable ULP mode. Important: This step must be performed to proceed with the next steps.
- Page 48 Perform the following steps to run the Device Information Service application demo: Establish the connection between the device and mobile phone using the procedure listed in Running the Demo. When paired, the application displays the Device Information Service. User Guide DS70005335A-page 48 © 2017 Microchip Technology Inc.
- Page 49 Click the Custom Serial Chat icon. The chat screen appears where the text that is to be sent to the remote device is to be entered, and the text coming from the remote device can be seen. Chat text “Hello Atmel” and send to the remote device. User Guide DS70005335A-page 49 © 2017 Microchip Technology Inc.
- Page 50 The user can also write the text on the console for the device and press the ENTER key to transmit the chat text to the mobile application. Figure 5-42. Console Log for Sending Data to Remote Device User Guide DS70005335A-page 50 © 2017 Microchip Technology Inc.
- Page 51 ATSAMB11 Figure 5-43. Chat Text Received from ATSAMB11 Note: For more information on Custom Serial Chat service, refer to Custom Serial Chat Service Specification. 5.3.13 Heart Rate Profile Application Perform the following steps to run the Heart Rate Profile application demo.
- Page 52 The corresponding console logs and mobile application screen are shown in the following figure. User Guide DS70005335A-page 52 © 2017 Microchip Technology Inc.
- Page 53 ATSAMB11 Figure 5-45. Console Log for Blood Pressure Measurements Figure 5-46. Blood Pressure Service Page after Receiving BP Indications User Guide DS70005335A-page 53 © 2017 Microchip Technology Inc.
- Page 54 After the device is connected, the application displays a service page that includes Immediate Alert Service and Generic Information. Since the service level connection is established, notifications are shown based on the alert level settings as depicted in the following figures. User Guide DS70005335A-page 54 © 2017 Microchip Technology Inc.
- Page 55 The notifications are automatically enabled and the application reads the values of “Alert Status”, “Ringer Settings”, and “Ringer Control Point” characteristics. These are updated on the mobile application, as illustrated in the following figure. User Guide DS70005335A-page 55 © 2017 Microchip Technology Inc.
- Page 56 Alert Notification Profile Application Perform the following steps to run the Alert Notification Profile application demo: Establish the connection between the device and mobile phone using the procedure listed in Running the Demo. User Guide DS70005335A-page 56 © 2017 Microchip Technology Inc.
- Page 57 Figure 5-53. Alert Notification Screen on Microchip SmartConnect Application The user can trigger a missed call to the Android device or send an SMS. The corresponding notification then gets displayed on the device side in the console logs. User Guide DS70005335A-page 57 © 2017 Microchip Technology Inc.
- Page 58 The device starts scanning and displays the devices found, as shown in the following figure. Figure 5-55. Multi-Role Peripheral Multi-Connect Application – Scanning Devices Set up another ATSAMB11-MR/ZR device with the Find Me application example loaded. Follow the steps (1 through 3) from Running the Demo.
- Page 59 MR/ZR continues to behave as Find Me Locator (GAP Central) and Battery Service Application (GAP Peripheral) simultaneously with eight active connections. Continuous data transfer happens on all the links by the ATSAMB11-MR/ZR and even if one link gets disconnected, the data transfer happens on the other links.
- Page 60 ATSAMB11 5.3.19 L2CAP Throughput Application This demonstration requires two ATSAMB11-MR/ZR devices. Program one ATSAMB11-MR/ZR device with the L2CAP Peripheral and another one with the L2CAP Central application example. Perform the following steps to run the Throughput application demo: Follow the steps (1 and 2) from Initializing the Device for both devices.
- Page 61 Establish the connection between the device and mobile phone using the procedure listed in Running the Demo. When paired, the application displays the Health Thermometer Service and the Generic Information service. User Guide DS70005335A-page 61 © 2017 Microchip Technology Inc.
- Page 62 5.3.21 iBeacon Application Perform the following steps to run the iBeacon application demo. Follow the steps (1 and 2) from Initializing the Device. Start the Microchip SmartConnect application on the iPhone/Android. User Guide DS70005335A-page 62 © 2017 Microchip Technology Inc.
- Page 63 Figure 5-65. Beacon Radar Application Initial Screen Click iBeacon to check the Major, Minor and RSSI value. The RSSI value is automatically updated based on the movement of the scanner device, as shown in the following figure. User Guide DS70005335A-page 63 © 2017 Microchip Technology Inc.
- Page 64 Perform the following steps to run the AltBeacon application demo. Follow the steps (1 and 2) from Initializing the Device. The beacon application initialization is displayed in the console. Initializing AltBeacon Application BLE AltBeacon Advertisement started User Guide DS70005335A-page 64 © 2017 Microchip Technology Inc.
- Page 65 When the user moves away from the beacon device the configured beacon is not shown, indicating the user moved away from the beacon device. Figure 5-69. AltBeacon Radar Application in Proximity Mode User Guide DS70005335A-page 65 © 2017 Microchip Technology Inc.
- Page 66 The beacon application initialization is displayed on the console. SAMB11 XPro Module:MR SAMB11-MR Initializing SAMB11 SAMB11 Chip ID: 0x2000B1 BD Address:0xF8F005F36701, Address Type:0 BluSmartSDK Firmware Version:6.1.6991 SAMB11 RF Version:0x10000000 Eddystone beacon started User Guide DS70005335A-page 66 © 2017 Microchip Technology Inc.
- Page 67 This telemetric information is obtained from the Eddystone-TLM frames which are interleaved with Eddystone identifying frames (UID/URL). User Guide DS70005335A-page 67 © 2017 Microchip Technology Inc.
- Page 68 Connect to the beacon in Configuration mode as shown in Figure 5-74. Once connected, the configurable beacon parameters are listed out as shown in Figure 5-75. Figure 5-74. Connecting to Beacon in Configuration Mode User Guide DS70005335A-page 68 © 2017 Microchip Technology Inc.
- Page 69 Update the URL, Tx Power mode, beacon period, etc. and then save. Now, disconnect from the beacon and enter the ranging screen. Once disconnected, the beacon device (ATSAMB11-MR/ZR) enters into Beacon mode and start sending Eddystone URL frames with the updated values. The ranging console log screen shows the beacon with new URL value.
- Page 70 Eddystone is the backbone of the Physical Web initiative from Google. For more information on the Physical Web, refer to https://google.github.io/physical-web/. The following demo shows how the Eddystone application running on an ATSAMB11-MR/ZR device works seamlessly with the Physical Web Android application.
- Page 71 Figure 5-78. URL Configuration on Physical Web App 5.3.24 Direct Test Mode Application This demonstration requires two ATSAMB11-MR/ZR devices loaded with Direct Test Mode example application code. Perform the following steps to run the DTM with Performance Analyzer tool. Start the performance analyzer in the Atmel Studio.
- Page 72 The user must see non-zero packets received at the Rx side, indicating successful transmission and reception. Note: Any side can be replaced by standard compliant test equipment. User Guide DS70005335A-page 72 © 2017 Microchip Technology Inc.
- Page 73 Tx and Rx options. Click Start Rx Test and ensure that the packets are transferred for a certain time period from the Tx device. Figure 5-83. Starting Rx Test Click Stop Test to display the number of successful received packets. User Guide DS70005335A-page 73 © 2017 Microchip Technology Inc.
- Page 74 Baudrate 115200 – Parity None – One Stop bit – One Start bit – No Hardware Handshake RESET command – to reset the device, type “AT+RESET” and then press the <Enter> key. User Guide DS70005335A-page 74 © 2017 Microchip Technology Inc.
- Page 75 Figure 5-86. CFG_DEF Command SCAN command – to scan the BLE device, type “AT+SCAN” and then press the <Enter> key. After scanning for the device, the scan result is shown in the following figure. User Guide DS70005335A-page 75 © 2017 Microchip Technology Inc.
- Page 76 ATSAMB11 Figure 5-87. SCAN Command STOP command – to stop the command handler, type “AT+STOP” and then press the <Enter> key. Figure 5-88. STOP Command User Guide DS70005335A-page 76 © 2017 Microchip Technology Inc.
-
Page 77: Adding A Ble Standard Service
Figure 6-2. ASF BLE Services and Components Window Select the required BLE Services/Profiles Component, as shown in the following figure. 3.1. Select Device Information Services. 3.2. Click Add > Apply > OK. User Guide DS70005335A-page 77 © 2017 Microchip Technology Inc. - Page 78 * @return @ref AT_BLE_SUCCESS operation completed successfully. * @return @ref AT_BLE_FAILURE Generic error. at_ble_status_t dis_info_update(dis_gatt_service_handler_t *dis_serv , dis_info_type info_type, dis_info_data* info_data, at_ble_handle_t conn_handle); /**@brief DIS service and characteristic initialization (Called only once by user). User Guide DS70005335A-page 78 © 2017 Microchip Technology Inc.
- Page 79 *device_info_serv ); /**@brief Register a dis service instance inside stack. * @param[in] dis_primary_service dis service instance * @return @ref AT_BLE_SUCCESS operation completed successfully * @return @ref AT_BLE_FAILURE Generic error. at_ble_status_t dis_primary_service_define(dis_gatt_service_handler_t *dis_primary_service); User Guide DS70005335A-page 79 © 2017 Microchip Technology Inc.
-
Page 80: Custom Serial Chat Service Specification
Note: The chat text is sent as a notification from the sender (mobile app or ATSAMB11-MR/ZR based device). Hence, the client characteristic configuration descriptor is always configured for notifications (in the Custom Serial Chat service instance on the mobile application and host). -
Page 81: Characteristic Descriptors
The client characteristic configuration descriptor is included in the Endpoint characteristic. Sequence Flow Diagram The following figure illustrates the sequence flow diagram of the Custom Serial Chat profile. Figure 7-1. Sequence Flow Diagram User Guide DS70005335A-page 81 © 2017 Microchip Technology Inc. -
Page 82: Customization Of Keil Project
2.2. Click OK. Figure 8-2. Select Device for Target A dialog box is displayed with a list of Software Components. Do not select any software components for the target device. Click OK. User Guide DS70005335A-page 82 © 2017 Microchip Technology Inc. - Page 83 Select “Use MicroLIB” check box • For this sample project, a customized scatter file is used. Using a similar scatter file instead of the memory map from this page is recommended. User Guide DS70005335A-page 83 © 2017 Microchip Technology Inc.
- Page 84 • Be sure to check the “Create HEX File” check box. Figure 8-6. Output Settings 4.3. In the Listing tab, set the parameters (default options), as shown in the following figure. User Guide DS70005335A-page 84 © 2017 Microchip Technology Inc.
- Page 85 ATSAMB11 Figure 8-7. Listing Settings 4.4. In the User tab, set the user settings (default selection), as shown in the following figure. Figure 8-8. User Settings User Guide DS70005335A-page 85 © 2017 Microchip Technology Inc.
- Page 86 Make sure to correctly refer to the included folder in the release package. Figure 8-9. C/C++ Settings 4.6. In the ASM tab, check the “Thumb Mode” check box, as shown in the following figure. User Guide DS70005335A-page 86 © 2017 Microchip Technology Inc.
- Page 87 • Browse to add the manual scatter file “iBeacon.sct” or “iBeacon_samb11.sct” or “app_manual.sct” in scatter file path Note: For more details on sample scatter file, refer to Sample Keil Scatter File. User Guide DS70005335A-page 87 © 2017 Microchip Technology Inc.
- Page 88 In the Initialization File edit box, enter “init_app.ini”. Note: This is the initialization file for linking the application and patches to the bootrom code. This initialization file is available in the sample application directory (<release_dir>\ apps\xxxx). User Guide DS70005335A-page 88 © 2017 Microchip Technology Inc.
- Page 89 In Port, select SW from the drop-down and then click OK. Figure 8-13. SW Interface Selection for Debug Port • Check the “Load Application at Startup” check box, as shown in the following figure. User Guide DS70005335A-page 89 © 2017 Microchip Technology Inc.
- Page 90 SPI flash available on the SAMB11-MR/ZR. Note: This tool uses Python. Be sure to install Python 2.7.3 or later. • Click OK. User Guide DS70005335A-page 90 © 2017 Microchip Technology Inc.
- Page 91 … located in <release_dir>\lib Figure 8-16. Adding Files to Project After adding the files in to the project, build the solution by pressing <F7> or go to Project > Build Target. User Guide DS70005335A-page 91 © 2017 Microchip Technology Inc.
- Page 92 ATSAMB11 To start the Debug session, perform the following: – Before starting the Debug session, erase the SPI Flash in the ATSAMB11-MR/ZR: • Open the file “<release_dir>\tools\EraseFlash.bat to run. An erase procedure starts. • After the erase is completed, the following output message is displayed.
-
Page 93: Memory Map
ATSAMB11 Memory Map The ATSAMB11-MR/ZR has 128 KB ROM and 128 KB RAM. Figure 9-1. ATSAMB11-MR/ZR Memory Map RAM Partition The following figure illustrates the ATSAMB11-MR/ZR RAM partition. User Guide DS70005335A-page 93 © 2017 Microchip Technology Inc. -
Page 94: Sample Gcc Linker File
ATSAMB11 Figure 9-2. ATSAMB11-MR/ZR RAM Partition Sample GCC Linker File The following is a sample GCC Linker file. ram - This defines the user application section as defined in Figure 9.2. The user application code and data resides on the same memory section. The ORIGIN and LENGTH of this section is limited as per Figure 9-2. - Page 95 _srelocate = .; *(.ramfunc .ramfunc.*); *(.data .data.*); . = ALIGN(4); _erelocate = .; } > ram /* .bss section which is used for uninitialized data */ .bss (NOLOAD) : . = ALIGN(4); User Guide DS70005335A-page 95 © 2017 Microchip Technology Inc.
-
Page 96: Sample Keil Scatter File
The application file name must be updated in case of a different file name. Note: The app.c must contain the int app_entry(void) function and also must have #define APP_STACK_SIZE (2048) volatile unsigned char app_stack_patch[APP_STACK_SIZE]; User Guide DS70005335A-page 96 © 2017 Microchip Technology Inc. -
Page 97: Blusdk Smart Software Architecture
ATSAMB11 BluSDK SMART Software Architecture The following diagram illustrates the various layers in the BluSDK SMART Architecture for implementing various applications. Figure 10-1. BluSDK SMART Software Architecture User Guide DS70005335A-page 97 © 2017 Microchip Technology Inc. -
Page 98: Document Revision History
ATSAMB11 Document Revision History Rev A - 09/2017 Section Changes Document Initial Release User Guide DS70005335A-page 98 © 2017 Microchip Technology Inc. -
Page 99: The Microchip Web Site
Microchip’s Data Sheets. Most likely, the person doing so is engaged in theft of intellectual property. • Microchip is willing to work with the customer who is concerned about the integrity of their code. User Guide DS70005335A-page 99 © 2017 Microchip Technology Inc. -
Page 100: Legal Notice
SQTP is a service mark of Microchip Technology Incorporated in the U.S.A. Silicon Storage Technology is a registered trademark of Microchip Technology Inc. in other countries. GestIC is a registered trademark of Microchip Technology Germany II GmbH & Co. KG, a subsidiary of Microchip Technology Inc., in other countries. -
Page 101: Quality Management System Certified By Dnv
® DSCs, KEELOQ code hopping devices, Serial EEPROMs, microperipherals, nonvolatile memory and analog products. In addition, Microchip’s quality system for the design and manufacture of development systems is ISO 9001:2000 certified. User Guide DS70005335A-page 101 © 2017 Microchip Technology Inc. -
Page 102: Worldwide Sales And Service
Sweden - Stockholm Tel: 408-735-9110 Tel: 86-29-8833-7252 Tel: 66-2-694-1351 Tel: 46-8-5090-4654 Tel: 408-436-4270 Fax: 86-29-8833-7256 Fax: 66-2-694-1350 UK - Wokingham Canada - Toronto Tel: 44-118-921-5800 Tel: 905-695-1980 Fax: 44-118-921-5820 Fax: 905-695-2078 User Guide DS70005335A-page 102 © 2017 Microchip Technology Inc.
Need help?
Do you have a question about the ATSAMB11 and is the answer not in the manual?
Questions and answers